Abstract
Purpose: To evaluate the feasibility of line-focused ultrasound for thermal ablation of superficially located tumors.
Methods: A SonoKnife is a cylindrical-section ultrasound transducer designed to radiate from its concave surface. This geometry generates a line-focus or acoustic edge. The motivation for this approach was the noninvasive thermal ablation of advanced head and neck tumors and positive neck nodes in reasonable treatment times. Line-focusing may offer advantages over the common point-focusing of spherically curved radiators such as faster coverage of a target volume by scanning of the acoustic edge. In this paper, The authors report studies using numerical models and phantom and ex vivo experiments using a SonoKnife prototype.
Results: Acoustic edges were generated by cylindrical-section single-element ultrasound transducers numerically, and by the prototype experimentally. Numerically, simulations were performed to characterize the acoustic edge for basic design parameters: transducer dimensions, line-focus depth, frequency, and coupling thickness. The dimensions of the acoustic edge as a function of these parameters were determined. In addition, a step-scanning simulation produced a large thermal lesion in a reasonable treatment time. Experimentally, pressure distributions measured in degassed water agreed well with acoustic simulations, and sonication experiments in gel phantoms and ex vivo porcine liver samples produced lesions similar to those predicted with acoustic and thermal models.
Conclusions: Results support the feasibility of noninvasive thermal ablation with a SonoKnife.
Keywords: SonoKnife, thermal ablation, acoustic edge, line-focus, focused ultrasound
INTRODUCTION
Patients with advanced head and neck tumors remain a challenging group facing a poor prognosis.1, 2 Thermal ablation therapy using various energy sources has gained acceptance in the treatment of some advanced cancers and benign tumors.3, 4, 5, 6, 7, 8, 9, 10, 11, 12, 13 Noninvasive thermal ablation may enhance the efficacy of ionizing radiation therapy and chemotherapy, and potentially reduce the need for surgery, and thus it has the potential to provide significant outcome improvements and lower morbidity rates in this and other high-risk patient populations.6, 14, 15, 16 The SonoKnife, a new concept for a noninvasive (externally applied), scan-able, high intensity line-focused ultrasound thermal therapy system, was conceived for thermal ablation of advanced (persistent or recurrent) superficial head and neck tumors and positive lymph nodes that are located not more than 5 cm from the skin and are not larger than 3 cm in diameter.
Line-focusing may offer some advantages over point- focusing, which is the most common approach using spherically curved radiator. In particular, one of the major drawbacks of point-focused systems is the small volume of tissue ablated with each sonication. Consequently, in order to destroy a solid tumor, many sonications are needed making treatment times undesirably long.11, 17, 18, 19 This significant challenge to focused ultrasound therapy systems has motivated various approaches seeking to expedite treatment times and/or create larger thermal lesions per sonication.18, 20, 21, 22, 23, 24, 25, 26 Line-focusing may also be a potential approach to speed up treatments by ablating larger volumes along the line-focus, while stepping or continuously scanning the line-focus across a target. Moreover, the length of the line-focus can be made variable with the proper design of the radiator (e.g., using an array of independently powered cylindrical elements) thereby adding the ability to conform the ablation zone to target volumes. Another potential advantage is lower peak acoustic intensities produced by the line-focused compared to point-focused devices implying less likelihood for the occurrence of nonlinear propagation and/or cavitation effects.27, 28, 29, 30
This feasibility paper represents the first theoretical and experimental study of the SonoKnife concept as a potential device for thermal ablation (focused ultrasound surgery). We performed a numerical parametric study to determine how the acoustic edge changes with basic design parameters, and how scanning it in one dimension could create a three-dimensional thermal ablation lesion. Moreover, a prototype applicator was constructed based on simulations and the acoustic fields measured in water. The prototype was also used to create lesions in gel phantoms and in porcine liver ex vivo. The data presented here are foundational for future design and construction of the SonoKnife systems suitable for phase I clinical trials of advanced cancers in the head and neck anatomy.
METHODS
Acoustic model
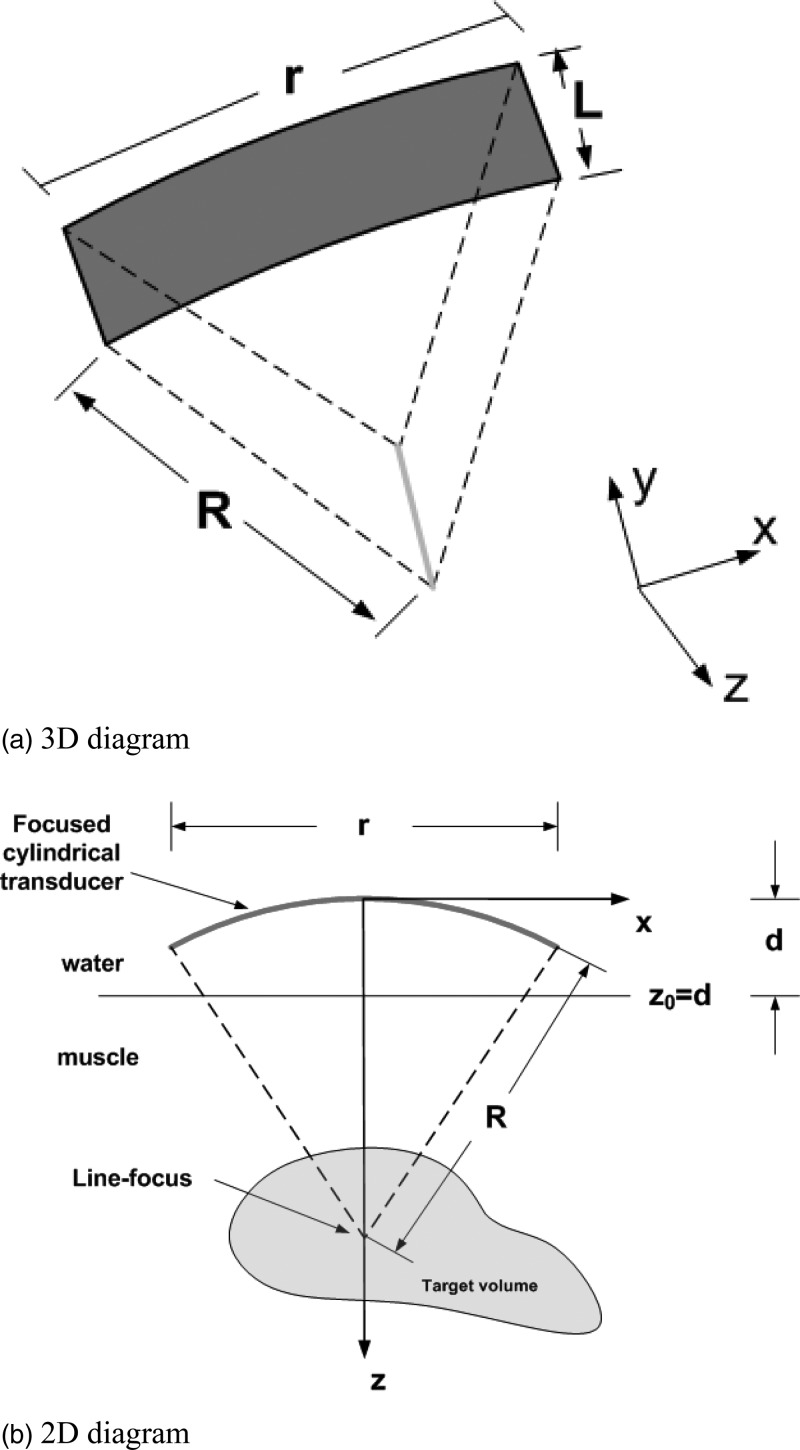
Acoustic simulations were performed using the open-access software package FOCUS from Michigan State University.31 Homogenous muscle tissue was assumed and water was the coupling medium between the transducer surface and the skin (muscle). A schematic diagram of the SonoKnife applicator is shown in Fig. 1. Neither reflections nor refractions were considered at the water-muscle interface. In Fig. 1, parameter R is the radius of curvature of the cylindrical-section transducer, r is the aperture size (width), L is the length of the transducer, and d is the position of water-muscle interface with respect to the center of the transducer’s radiating area as shown on the right of Fig. 1b. The excitation frequency was denoted by f, the tissue acoustic attenuation coefficient was denoted by α, and the transducer surface intensity (emittance) was denoted by Ie. Note that the SonoKnife transducer generates a line-focus instead of the most commonly used ellipsoidal (“point”) focus generated by spherical-section radiators. The nominal, temperature independent, parameter values used are given in Table Table I..
Figure 1.
Schematic diagrams of a SonoKnife transducer with a reference frame. (a) a perspective 3D view. (b) Cross-sectional view in which the length of the cylinder (L) extends perpendicularly to the plane of the paper in the y direction.
Table I.
Nominal parameter values.
| Frequency | Radius of curvature | Aperture width | Length | Transducer to skin distance | Attenuation coefficient | Transducer emittance |
|---|---|---|---|---|---|---|
| f (MHz) | R (mm) | r (mm) | L (mm) | d (mm) | α (Np/cm/MHz) | Ie (W/cm2) |
| 3.0 | 60 | 60 | 30 | 30 | 0.04a | 3.0 |
Reference 63.
The general computational methodology was as follows. A planar source pressure distribution at the water-muscle interface was first computed using a fast near-field method.32, 33 Subsequently, this planar source was used to compute the 3D pressure distribution inside the attenuating medium using the angular spectrum approach.34
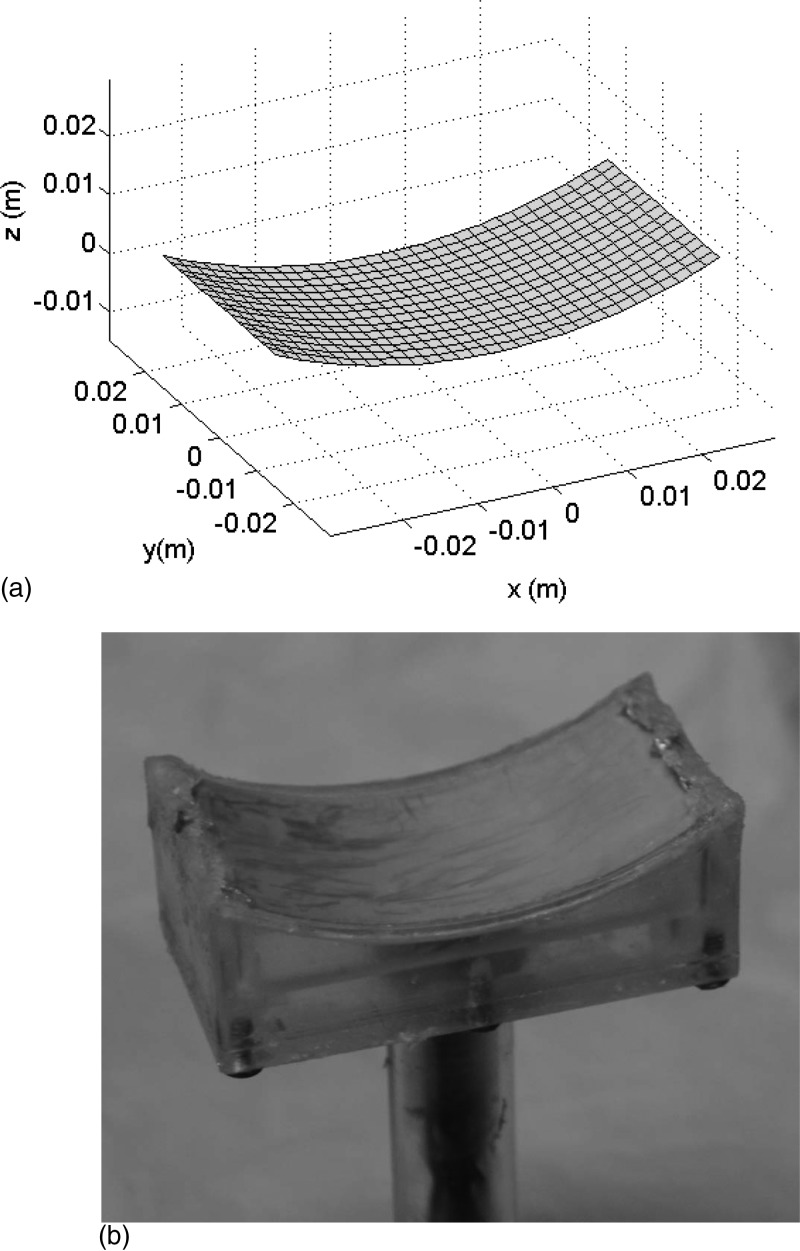
To compute the planar source pressure distribution of the SonoKnife transducer, its radiating area was subdivided into small rectangles as shown in Fig. 2a. Therefore, a pressure distribution generated by the entire transducer was given by the superposition of the pressures produced by each of these small rectangular sources. Mathematically this can be represented as,
| (1) |
where m is the number of rectangles on the transducer’s surface whose dimensions are comparable to the acoustic wavelength and p0m(x, y, z) is the peak acoustic pressure generated by a given small rectangle as explained in detail by Chen and McGough.32, 33
Figure 2.
(a) For modeling purposes, the cylindrical surface of the simulated SonoKnife transducer was composed of an array of small rectangles whose dimensions are comparable to the wavelength. (b) Photograph of the prototype PZT-8 ultrasound transducer used in experiments with an operating frequency of 3.5 MHz, a radius of curvature (R) of 60 mm, a width (r) of 60 mm, and a length (L) of 30 mm. The mount was machined out of Plexiglas.
For fast calculations, the pressure distribution inside the attenuating medium (chosen as muscle is this report) was computed using the angular spectrum method given by,34
| (2) |
where the operator (x inside a circle) denotes the spatial convolution along the x and y directions, p0(x, y, z0) is the pressure distribution of the planar source at z = z0, hp(x, y, Δz) is the spatial propagator associated with the pressure planar source, and Δz = z − z0. The spatial propagator hp(x, y, Δz) is given by,35
| (3) |
where , k is the spatial wave number, and j = (−1)1/2. Acoustic attenuation was incorporated into the complex pressure calculations by replacing the real-value wave number k in Eqs. 1, 2, 3 with a complex wave number k − jαf.
Acoustic field parameters
In all simulations, Ie was assumed uniform and constant at 3 W/cm2; this is a reasonable value since piezoelectric transducers are known to operate in excess of 10 W/cm2. First, the pressure distribution in a large 3D volume was calculated using FOCUS as described above.31 Then the intensity distributions were calculated according to,36
| (4) |
where p(x, y, z) is the pressure amplitude at the point whose coordinates are x, y, and z; ρ is the density of the tissue and c is the speed of sound in tissue. After the intensity was calculated, the acoustic edge was defined as the region within and including the −6 dB intensity surface around the line-focus (equivalent to the volume defined by −3 dB pressure amplitude surface). The field parameters used to characterize the SonoKnife was the peak pressure amplitude Pp, peak intensity Ip, the average intensity Ia within the acoustic edge and the dimensions of the acoustic edge in the x, y, and z directions, which were denoted as Ax, Ay, and Az, respectively.
Thermal model
Pennes’ bio-heat transfer equation (BHTE) was used for temperature simulations.37 In the BHTE, the temperature T, which is a function of space and time, was modeled by the following partial differential equation,
| (5) |
where ρ was previously defined as the tissue density (kg/m3), C is the specific heat of tissue (J/kg/°C), t is the elapsed time, k is the thermal conductivity of tissue (W/m/°C), Wb is the blood perfusion rate (kg/m3/s), Cb is the specific heat of blood (J/kg/°C) (assumed equal to C in this paper), Ta is the arterial blood temperature (assumed to be 37 °C), Qp is the power deposition per unit volume (W/m3), and ∂T/∂t denotes the partial derivative of the temperature with respect to time. For a plane wave, the power deposition Qp can be defined as,38
| (6) |
where α is the linear acoustic attenuation coefficient of tissue. This expression has been used routinely for modeling power deposition by focused ultrasound fields in soft tissues where acoustic scattering can be assumed negligible.38
The transient BHTE was solved numerically using finite differences, that is, Eq. 5 was discretized in both spatial and temporal dimensions as follows,39
| (7) |
where Δt is the time step, (i,j,k) denotes the indices of the spatial grid points in the x, y, and z directions, m denotes the index of the time step, and δ is the uniform spacing between adjacent grid points in the x, y, and z directions. Parameters Δt and δ had to satisfy the following relationship to avoid numerical instability,39
| (8) |
Step-scanning simulations
Step-scanning simulations, to illustrate the feasibility of creating a large thermal ablation zone by scanning the line-focus, were also performed by shifting the contents of the power deposition array as a function of time.40 A linear scan 30 mm long in the x direction, from x = −15 mm to x = 15 mm, was completed in 24 consecutive steps. The dwell (power-on + power-off) time at each step was varied, per a priori simulation trials, in order to create a relatively uniform and ablative thermal dose distribution volume at depth.18, 19 Also based on these trials, the emittance of the transducer was set equal to 6 W/cm2. All nominal acoustic and thermal model parameters and property values (Tables Table I. and Table II.) were held constant except for the blood perfusion term, which was set equal to the nominal value at the start of the simulation but it was set to zero for points reaching a thermal dose of 240 equivalent minutes at 43 °C (EM43), irreversibly. Thermal doses were computed using the well-accepted formulation of Sapareto and Dewey.41 The initial and boundary conditions were set to 37 °C except for the skin which was set to 22 °C to simulate a moderate degree of skin cooling as it is customary with external thermal therapy applicators.42, 43
Table II.
Acoustic and thermal properties of water and muscle.
| Tissue | c(m/s) | ρ(kg/m3) | C(J/kg/°C) | K(W/m/°C) | Wb(kg/m3/s) | α(Np/cm/MHz) |
|---|---|---|---|---|---|---|
| Water | 1500 | 1000 | 4180 | 0.62 | 0 | 2.5 × 10⁻⁴ |
| Muscle | 1569 | 1138 | 3720 | 0.5 | nominal = 5, ablated = 0 | 0.04 |
SonoKnife prototype
Based on preliminary simulation results, a prototype cylindrical section transducer was constructed [Fig. 2b]. Its basic characteristics were an operating frequency of 3.5 MHz, a radius of curvature (R) of 60 mm, a width (r) of 60 mm, and a length (L) of 30 mm. The transducer was made of PZT-8 piezoelectric ceramic material mounted on a custom machined holder. According to radiation force-balance measurements, the electro-acoustic efficiency was 65%. The prototype was tested with up to 120 We (electric) continuous mode for 60 s and up to 200 We at 50% duty cycle. The transducer was enclosed in a plastic housing that circulated cooling-coupling degassed water. The housing used a thin Mylar membrane for transmission of the sound waves into the target medium. The depth of the line-focus was adjustable by moving the transducer relative to the Mylar membrane (along the z direction) via a waterproof shaft-O-ring assembly.
Pressure field measurements in water
Acoustic field measurements were carried out in a tank filled with degassed water equipped with a computer-controlled 3-axis-positioning system that was used to scan a 0.2 mm diameter needle hydrophone (Model HPM02/1, Precision Acoustics, United Kingdom). The transducer, in a fixed location, was impedance-matched and driven by a 50 ohms output power generator (Model 500-018, Advanced Surgical Systems). The acoustic signals were detected by the hydrophone connected to an oscilloscope (Model HP54600A, Hewlett-Packard). The hydrophone was step-scanned around the line-focus in step sizes of 0.4, 0.5, and 0.5 mm along the x, y, and z directions, respectively.
Lesions in gel phantoms
Gel phantoms containing egg whites were used to visualize qualitatively thermal lesions induced by the SonoKnife prototype in a homogeneous medium. The phantoms were made in our laboratory. They were composed of 28.6% water, 24.4% of 40% acrylamide solution (Sigma), 16.8% of 2% Bis acrylamide solution (Fisher), 30% of egg whites, 0.05% ammonium persulfate, and 0.02% Tetramethylethylenediamine (TEMED). This recipe results in a solid gel with acoustical properties close to those of soft tissues (c = 1542 m/s and α = 0.024 Np/cm/MHz).44 The presence of egg whites makes the phantom become opaque when heated. This property allowed us to identify qualitatively the “ablated volume” or lesion shape in three dimensions.44 For our recipe, we measured a transition temperature around 62 °C. After preparation, the mixture was poured into a mold. Once the mixture solidified, it was taken out of the mold and used immediately for experiments.
The general methodology for these measurements was as follows. The SonoKnife prototype was positioned on top of a phantom, with the geometric line-focus set at a desired depth by adjusting the transducer position vertically inside its plastic housing [not shown in Fig. 2b], so that the sound propagation was vertically downward. The sonication parameters (power and time) were chosen based on a priori trials. The sound was coupled across the Mylar membrane using a small amount of ultrasound transmission gel (Aquasonic 100) between the membrane and the phantom. After a sonication, the phantom was photographed from three orthogonal directions to visualize the shape of the lesion in three dimensions.
Thermal ablation of ex vivo porcine liver
Fresh porcine livers were provided by a local vendor (Odom’s Tennessee Pride Sausage, Inc.) on the same day of the experiments and maintained at room temperature. As for the sonications in gel phantoms, a set of trials were conducted to determine sonication parameters for the final experiments.
The general methodology for the ex vivo measurements was similar to the one used for gel phantoms. The SonoKnife prototype [including plastic housing not shown in Fig. 2b] was positioned on top of a liver sample with its geometric line-focus set at a desired depth. The sound was coupled across the Mylar membrane using a small amount of ultrasound transmission gel between the membrane and the liver sample. After a sonication, the ablated sample was first cut along the line-focus and photographed. Subsequently, the sample was cut midway and perpendicularly to the line-focus and photographed. Therefore the two photographs or views for each sample show the thermal lesion across (x direction) and along (y direction) the line-focus.
RESULTS
Focal plane pressure distributions
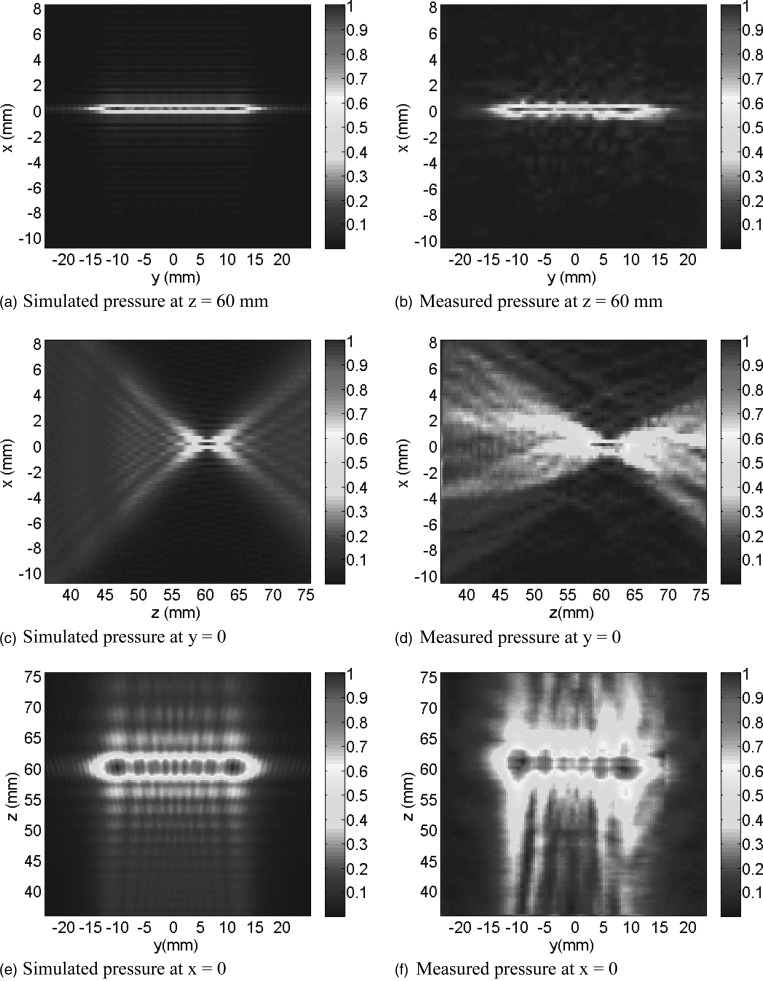
Simulated and measured (in water) pressure amplitude distributions in three orthogonal planes through the line-focus generated by the SonoKnife are plotted in Fig. 3. Nominal parameters (Table Table I.) were used except for frequency, which was that of the SonoKnife prototype (3.5 MHz). As shown, the SonoKnife generates a sharp line-focus whose length in the y direction is close to the length (L) of the SonoKnife transducer.
Figure 3.
Simulated (a, c, and e) and measured (b, d, and f) pressure distributions on the central y–z plane (x = 0), central z–x plane (y = 0) and central y–x plane (z = 60 mm). The frequency was that of the SonoKnife prototype, 3.5 MHz. All other parameters had nominal values (Table Table I.). Both the simulated and measured pressure distributions were self-normalized. See Fig. 1 for the reference frame.
Influence of design parameters
In this section, simulation results are presented showing the influence of each design parameter on field parameters (peak pressure amplitude, peak intensity, and average intensity within the acoustic edge) and the size of the acoustic edge in the x, y, and z directions. In each set of simulations presented in Figs. 45678, only one parameter was varied at a time, while the other parameters were held constant at the nominal parameter values of Table Table I..
Figure 4.
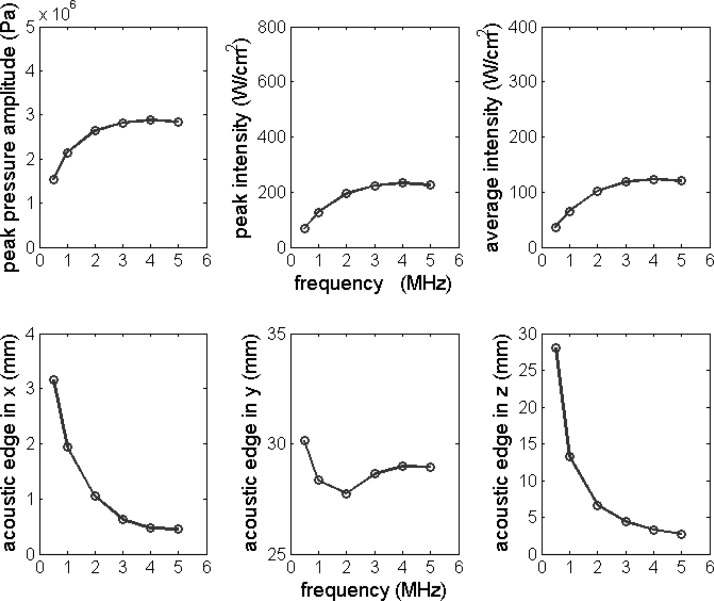
Peak pressure amplitude, peak intensity, average intensity, and acoustic edge dimensions in the x, y, and z directions plotted as a function of excitation frequency f. Nominal parameter values in Table Table I. were used except for the excitation frequency, which was varied from 0.5 to 5.0 MHz.
Figure 5.
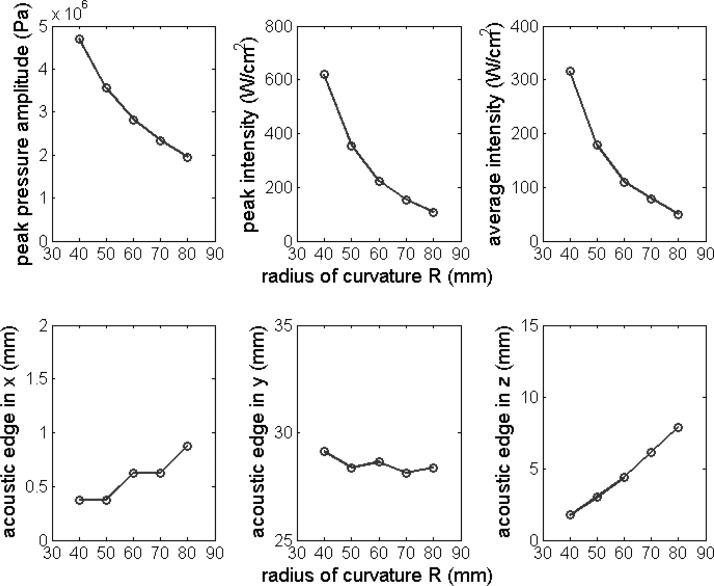
Peak pressure amplitude, peak intensity, average intensity, and the acoustic edge in the x, y, and z directions plotted as the function of the radius of the curvature R. Nominal parameter values in Table Table I. were used except for the radius of curvature R, which was varied from 40 to 80 mm with an interval 10 mm.
Figure 6.
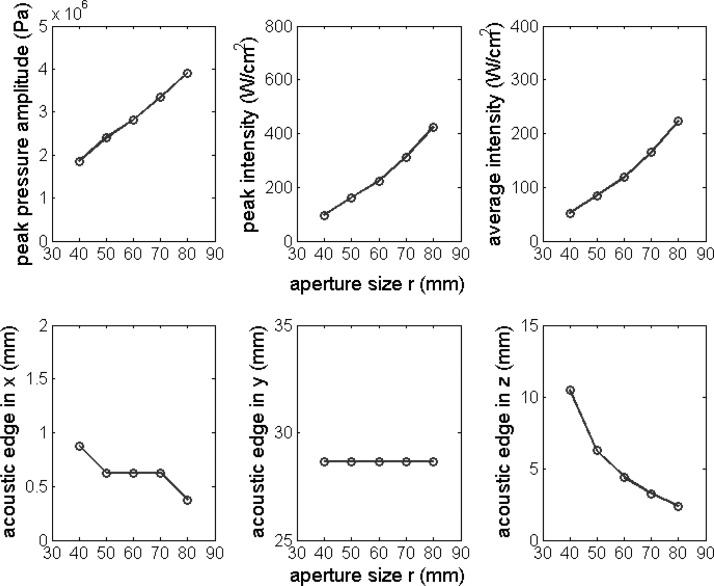
Peak pressure amplitude, peak intensity, average intensity, and the acoustic edge in the x, y, and z directions plotted as a function of aperture size r. Nominal parameter values in Table Table I. were used except for the aperture size r, which was varied from 40 to 80 mm with an interval 10 mm.
Figure 7.
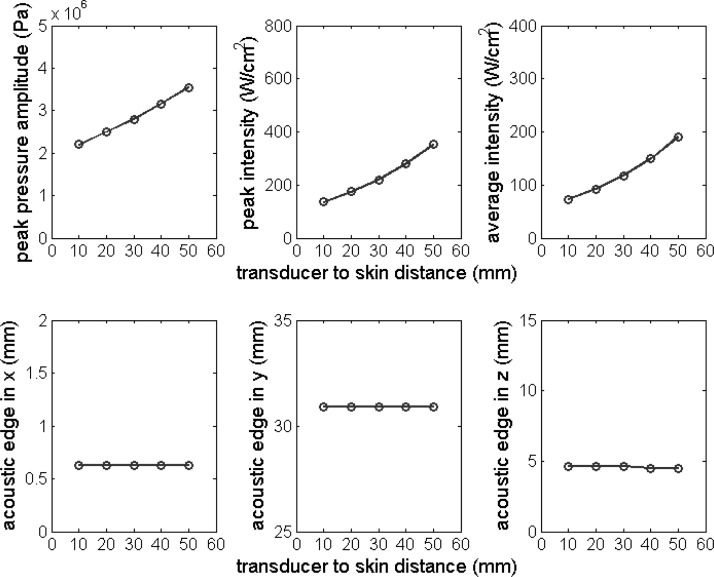
Peak pressure amplitude, peak intensity, average intensity, and the acoustic edge in the x, y, and z directions plotted as the function of transducer to skin distance d. Nominal parameter values in Table Table I. were used except for the transducer to skin distance d, which was varied from 10 to 50 mm with an interval of 10 mm.
Figure 8.
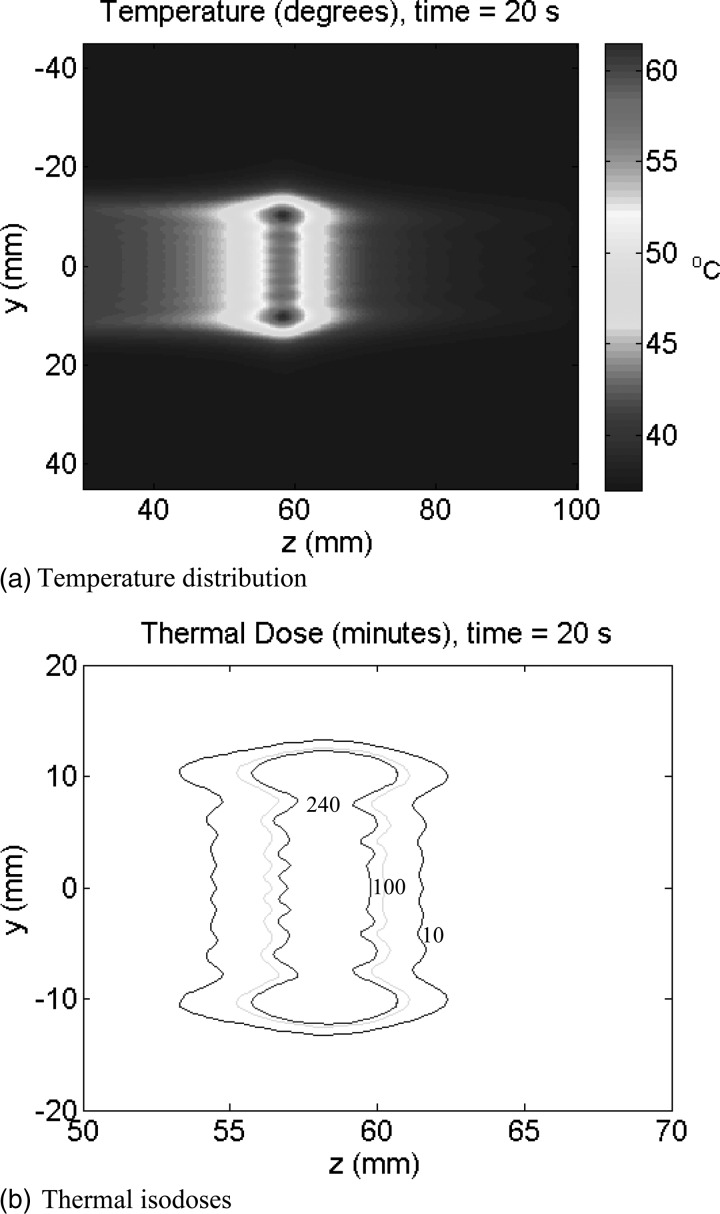
Focal plane temperature and thermal dose distributions on the central y–z plane (x = 0) after 20 s of static sonication. Nominal parameter values were used. Note that in 9(b) the scales were changed to zoom in into the ablation zone. The three iso-contours in 9(b) are the 10 (outer), 100 and 240 (inner) EM43.
Figure 4 shows the influence of frequency (f) on field parameters and size of the acoustic edge. Frequency (f) was varied from 0.5 to 5 MHz. The field parameters first increased rapidly with f, but at about 4 MHz they reached their maximum values. The size of the acoustic edge in the x and z directions decreased with increasing f while in the y direction slightly decreased to a minimum value at 2 MHz, then increased.
Figure 5 shows the influence of radius of curvature (R) on field parameters and the size of the acoustic edge. R was varied from 40 to 80 mm with an interval 10 mm. Field parameters decreased with increasing R. The size of the acoustic edge in the x and z directions increased, while in the y direction decreased slightly with increasing R.
Figure 6 shows the influence of aperture size (r) on field parameters and the size of the acoustic edge. The aperture size (r) was varied from 40 to 80 mm with an interval of 10 mm. Field parameters increased with increasing r. The size of the acoustic edge in the x and z directions decreased with increasing r but it was unaffected by r in the y direction.
Figure 7 shows the influence of the transducer to skin distance (d) on the field parameters and on the acoustic edge dimensions. The parameter d was varied from 10 to 50 mm with an interval of 10 mm. The figure shows that increasing d increases the values of the field parameters while it has no influence on the size of the acoustic edge. The influence of tissue attenuation on the field parameters and the size of the acoustic edge were also studied (results not shown). The pressure attenuation coefficient (α) was varied from 0.02 to 0.08 Np/cm/MHz. While the size of the acoustic edge was not impacted, as was the case of varying d, the field parameters at the focus decreased with increasing α.
Simulated focal plane temperature and thermal dose distributions
Temperature and thermal dose distributions on the focal y–z plane induced by the SonoKnife for nominal parameters listed in Table Table I. are plotted in Fig. 8. The uniform spatial resolution (δ) and the time step (Δt) used in the temperature and thermal dose simulations were 0.333 mm and 0.03 s, respectively. The nominal distance between the focus and the skin was 3 cm. The distributions on the x = 0 plane are shown after 20 s of sonication. The maximum temperature in Fig. 8a reached 61 °C while thermal doses well in excess of 240 EM43 were induced within the sonicated volume as shown in Fig. 8b. The thermal properties of water and muscle used in these simulations are listed in Table Table II..
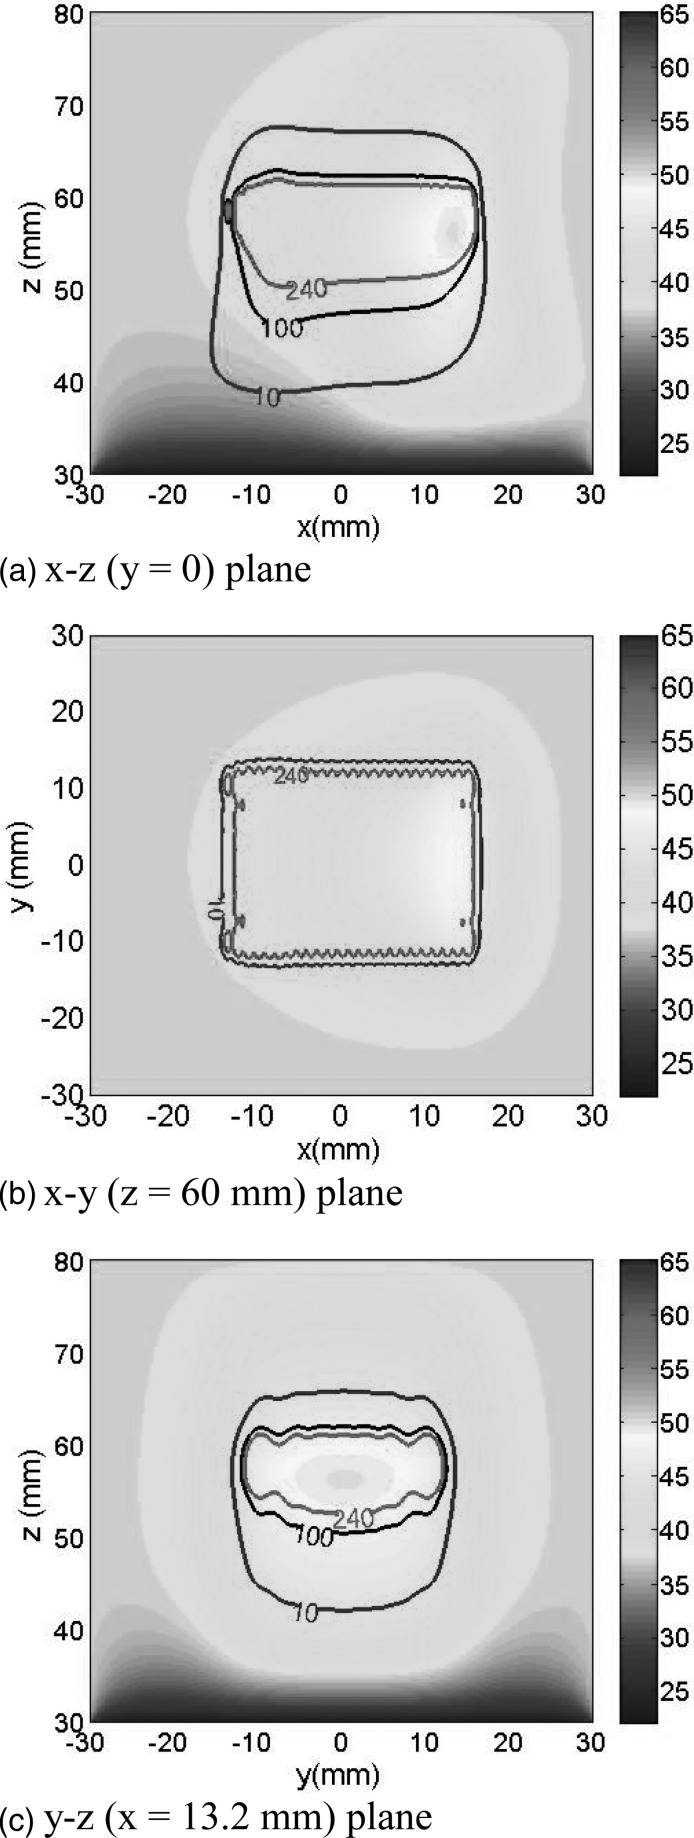
Step-scanning simulation results are presented in Fig. 9. Figures 9a, 9b, 9c show temperature and thermal dose distributions at the y = 0, z = 60 mm, and x = 13.2 mm planes, respectively, after step-scanning the line-focus in the x direction from −15 to 15 mm in steps of 1.25 mm. The power-on times per step were as follows: for scanning steps 1–3, 5.8 s; for steps 4–6, 5.0 s; and for steps 7–24 steps, 4.15 s. The power-off period in-between sonications was 30 s. Therefore, time to complete the entire 30 mm scan was 797 s (13.3 min). Nominal parameter values were used except for the emittance and muscle perfusion. The former was set to 6 W/cm2 and the latter was changed from 5 kg/m3/s to zero for voxels that reached a thermal dose of 240 EM43. The contours shown represent the cumulative 240 EM43 thermal isodoses after the 30 mm scan was completed. Since the plots shown are snapshots at the end of the scan, elevated temperatures appear only in tissues sonicated toward the end of the scan. However, a large volume with thermal doses >240 EM43 was induced in the entire scanned region as shown.
Figure 9.
Temperature and thermal dose distributions on (a) the central z–x plane (y = 0), (b) a y–x plane (z = 60 mm), and (c) a y–z plane (x = 13.2 mm) after step-scanning the acoustic edge in the x direction from −15 to 15 mm. The scanning step was 1.25 mm for a total of 24 steps. For scanning steps 1–3, 4–6, and 7–24, the power-on times were 5.8, 5.0, and 4.15 s/step, respectively. The power-off time in-between sonications was 30 s; consequently, the time to complete the entire scan was 797 s. Nominal parameter values were used except for: the emittance was equal to 6 W/cm3, Wb was set to zero at points that reached 240 EM43, and the skin temperature was held at 22 °C to simulate forced cooling. The contours shown represent the cumulative 10 (blue), 100 (black), and 240 (red) EM43 thermal isodoses after the scan was completed. In (b) only two isodose contours are plotted for clarity.
Visualization of thermal lesions in gel phantoms
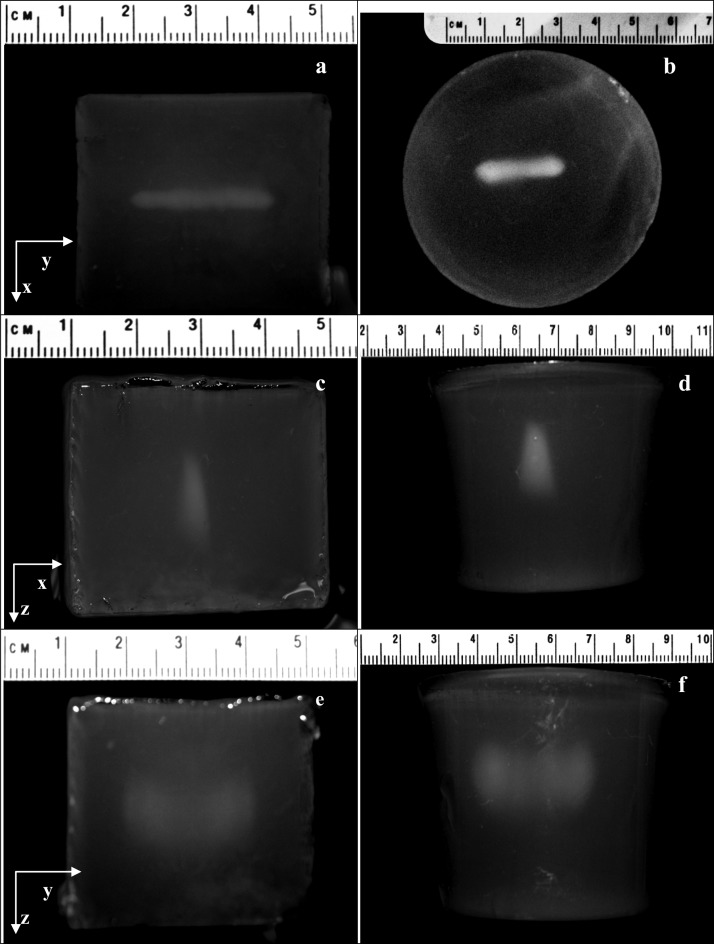
Thermal lesions created by the SonoKnife prototype in gel phantoms are qualitative visualized in the photographs shown in Fig. 10. Based on a priori trials, the static sonications were for 20 s using an acoustic power of 120 W. The line-focus was positioned 1.5 cm deep. Results for a cubical and a cylindrical phantom are shown. Figures 10a, 10b are beam’s eye view photographs (line-of-sight along the z direction). The line-of-sight was in the y direction in Figs. 10c, 10d, showing the projected shape of the lesion across the line-focus. In Figs. 10e, 10f the line-of-sight was in the x direction, showing the projected shape of the lesion along the line-focus. Both lesions were similar. Please note the different scales.
Figure 10.
Photographs of lesions created by the SonoKnife prototype inside gel phantoms. The sonications were for 20 s for an acoustic power of 120 W (no scanning). The line-focus was positioned approximately at 1.5 cm under the phantom surface. Results for two different phantoms are shown, one was cubical (a, c, e) and one cylindrical (b, d, f). (a) and (b) are beam’s eye view photographs (line-of-sight along the z direction). In (c) and (d) the line-of-sight was along the y direction, showing the projected thickness of the lesion across the acoustic edge. In (e) and (f) the line-of-sight was along the x direction, showing the projected length of the lesion along the acoustic edge.
Thermal ablation lesions created in porcine liver ex vivo
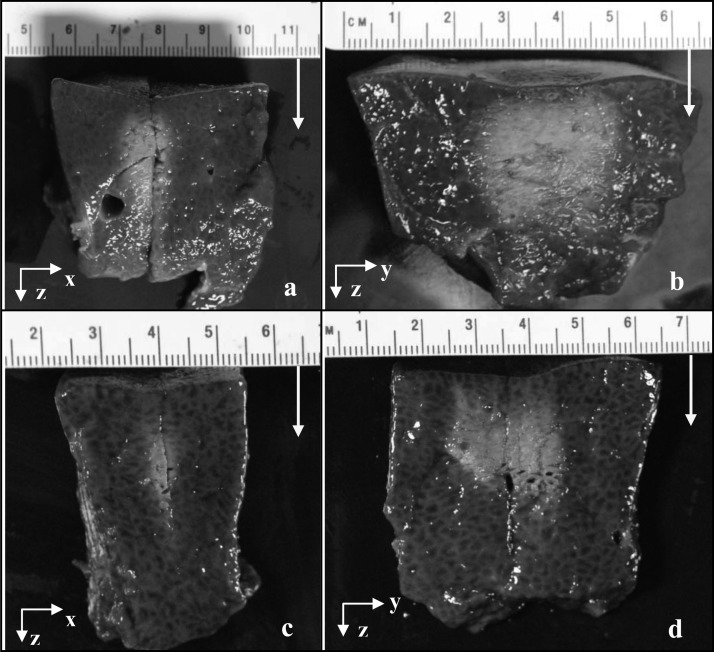
Typical static thermal ablation lesions created by the SonoKnife prototype in porcine liver ex vivo are shown in Fig. 11. Two different lesions and two views for each lesion are shown. An acoustic power of 108 W was used in both cases. For the first lesion, Figs. 11a, 11b, the power-on time was 30 s and the line-focus was aimed at 1.5 cm deep. For the second lesion, Figs. 11c, 11d, the exposure time was 20 s and the line-focus positioned at 2 cm deep. Figures 11a, 11c show x–z planes (across the line-focus) while Figs. 11b, 11d show y–z planes (along the line-focus). The sound propagation direction is indicated by the white arrows.
Figure 11.
Photographs of thermal ablation lesions created by the static SonoKnife prototype in porcine liver ex vivo. Two different lesions are shown, one in (a) and (b), and the other in (c) and (d). The acoustic frequency was 3.5 MHz. The sonications used an acoustic power of 108 W for 30 s aimed at 1.5 cm deep and for 20 s aimed at 2 cm deep for the first and second samples, respectively. In (a) and (c) it can be seen the samples were cut to reveal the lesions in the y–z planes shown in (b) and (d). The yellow arrows denote the direction of acoustic propagation.
Comparison of a SonoKnife to a spherical-section transducer
A simulation using the nominal parameter values was performed to compare a SonoKnife transducer to an equivalent radiating area spherically curved transducer. Amplitudes of pressure distributions of the two transducers on the x = 0 plane were compared (results not shown). As expected, the SonoKnife transducer generated a “large” strip-focus along the y and z directions [as in Fig. 3e] while the spherical transducer generated a sharp ellipsoidal focus along the z direction. Likewise, the peak pressure amplitude of the SonoKnife transducer was an order of magnitude smaller than that of the spherical-section transducer. The field parameters and the size of the acoustic edge in the x, y, and z directions for the SonoKnife transducer and the spherical transducer are listed in Table Table III.. The two transducers had the same radiating surface area of 18.85 cm2 and the same emittance of 3 W/cm2. The peak intensity of the spherical-section transducer was about 20 times larger than the peak intensity of the SonoKnife. The size of the acoustic edge in the x and z directions for the bowl transducer were slightly larger than for the SonoKnife, while the size of the acoustic edge in the y direction for the SonoKnife transducer was 33 times greater than for the spherical-section transducer.
Table III.
Peak pressure amplitude, peak intensity, average intensity, the size of the acoustic edge in the x, y, and z directions for a SonoKnife transducer and a spherical-section transducer with the same radiating surface area and emittance.
| f (MHz) | R (mm) | r (mm) | L (mm) | Peak pressure (MPa) | Peak intensity (W/cm2) | Avg. intensity (W/cm2) | Ax (mm) | Ay (mm) | Az (mm) | |
|---|---|---|---|---|---|---|---|---|---|---|
| Spherical transducer | 3.0 | 60 | 47.95 | — | 12.7 | 4507 | 2455 | 0.875 | 0.875 | 6.625 |
| SonoKnife transducer | 3.0 | 60 | 60 | 30 | 2.82 | 224 | 118 | 0.625 | 28.63 | 4.375 |
DISCUSSION AND CONCLUSIONS
The concept of a cylindrically shaped ultrasound radiator for therapy applications, where the sound is emitted from the radiator’s concave surface, is not new.45, 46, 47, 48, 49 However, the literature does not have many reports on the use of a line-focused acoustic device for thermal therapy except for a 1990 patent by Lele, who proposed it for hyperthermia applications (nonablative temperatures), and the more recent development of slightly focused curvilinear applicators for transurethral prostate thermal therapy.50, 51, 52 Lele’s patent mentioned the potential advantage of lower intensities afforded by line-focusing over point-focusing transducers. To our knowledge, however, strongly line-focused ultrasound applicators have not been studied for noninvasive thermal therapy applications other than hyperthermia. Our current research project seeks to evaluate ultrasonic line-focusing for externally applied thermal ablation of targets up to about 5 cm from the skin surface. A system based on the SonoKnife concept may be able to ablate targets in shorter treatment times by scanning the acoustic edge (i.e., the region enclosed by the −6 dB intensity cloud) than a spherically focused system, with the additional potential advantage of lower instantaneous acoustic intensities to subdue nonlinear propagation phenomena and/or cavitation effects. In this paper, we report the first numerical and experimental characterization of the SonoKnife concept to evaluate feasibility as a first step for ultimate application in humans.
The simulated and measured beam plots of Fig. 3 are in good agreement. They demonstrate that the SonoKnife prototype of Fig. 2b behaved according to linear acoustic theory and support the use of our modeling approach for future treatment planning applications. This figure also illustrates why we have called our device “SonoKnife”. The intensity distributions at the geometric focal depth of Figs. 3a, 3b show the length and the thickness of the acoustic edge. In both simulated and measured fields, the length was 28 mm, which is close to the physical length of the transducer [Fig. 1b], and the thickness was less than 1 mm along the entire length. The comparison of the cylindrical and the spherical transducers presented in Table Table III. showed that the −3 dB isobar thickness in the x direction (Ax) is smaller for the SonoKnife than for the equivalent radiating area curved radiator. The sharpness of the acoustic edge can also be appreciated in Figs. 3c, 3d on central x–z planes (y = 0). Lastly, the beamplots on the y–z planes (x = 0) revealed that the pressure distribution inside the −3 dB isobar is nonuniform; it exhibits multiple lobes with the maximum pressure magnitudes toward the ends of the acoustic edge due to well-documented diffraction effects.
We now discuss results from the numerical parametric study. The variation of the operating frequency is illustrated in Fig. 4. Increasing the frequency increased the values of the field parameters up to about 4 MHz, as expected, as smaller wavelengths allow tighter focusing and thereby higher peak intensities; however, acoustic attenuation increases with frequency thus having the opposite effect. As for the size of the acoustic edge, the curves in Fig. 4 were fitted and found to have linear relationships with the acoustic wavelength (λ = c/f) as follows,
Thus, the higher the frequency, the smaller the size of the acoustic edge in the x and z directions; this is consistent with tighter focusing with increasing frequencies. The length of the acoustic edge varied from ∼28 to 30 mm, implying that it is strongly determined by the value of L (Fig. 1); and it is important to note that it is not much smaller than L. The next parameter varied was the radius of curvature R, which not only affected the geometry of the SonoKnife (effectively increasing the f-number of the transducer) but also the position of the focal depth. In general, as R increased the field became less focused (for a planar transducer R → ∞), and in fact the size of the acoustic edge in the x and z directions increased with R (Fig. 5). Another factor was that the radiating surface area of the transducer decreased about 10% when R increased from 40 to 80 mm because of the corresponding change in the arc length of the cylindrical section. The combined effect was that the value of the field parameters decreased as R increased. The effect of the aperture size r was opposite to the effect of the radius of curvature R, as can be observed in Fig. 6, because increasing r decreased the f-number of the transducer. Thus, field parameters increased and the size of the acoustic edge in the x and z directions decreased with increasing r. In addition, the transducer surface area increased (and thereby the total output power) with r while the focal depth remained unchanged. Increasing the transducer-skin distance d, thereby decreasing the focal depth, increased the values of the field parameters and did not affect the size of the acoustic edge (Fig. 7). Thus, the main effect of increasing d was a corresponding shorter attenuating path-length in muscle. Likewise, variations in the attenuation coefficient did not affect the size of the acoustic edge (results not shown), and as expected, higher attenuation resulted in lower field parameters. A general conclusion that can be drawn from the parametric study is that the field parameters and the size of the acoustic edge are impacted more strongly by the geometry of the transducer than by the soft-tissue type (attenuation coefficient) or depth of the line-focus. Nevertheless, our model neglected scattering. It might be possible that highly scattering tissues or significant scattering increases during thermal ablation may produce larger acoustic edge sizes than predicted here.53
A comprehensive thermal characterization of the SonoKnife including scanning of the acoustic edge to “carve” out solid tumors is beyond the scope of this paper. In general, static and step-scanning simulation results of Figs. 89, respectively, serve to demonstrate that for conservative parameter values the focusing gain of the SonoKnife is sufficient to elevate tissue temperatures above 52 °C and induced thermal doses >240 EM43 in the focal plane in reasonable times. It is well established that heating soft tissues for a few seconds above 50 °C or inducing thermal doses >240 EM43 (∼1 s at 51 °C) causes protein coagulation and necrosis.17, 41, 54, 55 Figure 8 shows the resulting temperature (a) and thermal dose (b) distributions after 20 s of sonication with an static transducer. Two important observations are: first the maximum temperature and thermal dose elevations were located at 1.5 to 2 mm before the focal depth, and second there was some temperature elevation near the skin (from 37 to ∼41 °C), but not significant thermal dose; that is, thermal doses were <<240 EM43 near the skin. Results in Fig. 9 illustrate the feasibility of step-scanning the line-focus to ablate a larger volume at depth. The ablated zone was assumed the volume that reached 240 EM43, which are the regions inside the red contours. Per these contours, the approximate dimensions of the ablated volume in the x, y, and z directions were 28, 22, and 10 mm, respectively. This is a significant volume coverage for a 13 min treatment.
Finally, Figs. 1011 present experimental thermal lesion results in gel phantoms and porcine liver ex vivo, respectively. The transparent gel permits the qualitative visualization in three orthogonal planes of lesions created in a homogeneous medium. The general shapes of the lesions are in good agreement with the pressure distributions of Fig. 3 and the thermal distributions of Fig. 8. There is also agreement with Fig. 8 in that the lesions did not extend all the way to the surface of the phantom in contact with the SonoKnife. There is also good general agreement of Figs. 3, 8, and 10 with Fig. 11, although the lesions appear closer to the top of the samples. This was likely due to the higher acoustic attenuation of fresh porcine liver than of gel phantoms.
In aggregate, the above results support the idea of scanning the acoustic edge of the SonoKnife to destroy relative superficial tumors/nodes in the head and neck. A simple linear array of cylindrical-section elements could be used to change the length of the acoustic edge (in the y direction) to conform to varying tumor geometry as a function of scan position. The size of the tumor would dictate the number of scans of the line-focus at various depths, beginning with the deepest portion of a tumor.
In order to provide a reference, the SonoKnife was compared to a spherical-section transducer having the same radiating area and emittance. The magnitude of the field parameters was lower for the SonoKnife than for the curved radiator by an order of magnitude, while the dimensions of the acoustic edge in the x and z directions were smaller for the SonoKnife. According to this comparison, a fifteenfold increase in focal volume resulted in a twentyfold decrease in peak intensity.
There may be other potential applications of the SonoKnife. For instance, it may be suitable for thermal ablation of cancerous breast lumps and nodes.56 At high powers, it could be used for emergency hemostasis of punctured blood vessels by applying the acoustic edge perpendicularly to vessel’s axis.57 While at low powers, the line-focus may be used for sono-thrombolysis of vein thrombosis or arterial occlusion in the extremities.58, 59 Another potential application is transcostal focused ultrasound surgery of liver tumors by aiming the acoustic edge through the intercostal space to avoid bone overheating.60 Finally, the SonoKnife could be used to treat malignancies in long bones by matching the length of the acoustic edge to the length of diseased bone section.61, 62 Future research will determine those applications for which a line-focus may offer advantages.
In summary, a noninvasive, line-focused scanning ultrasound thermal therapy concept we named SonoKnife was developed and tested. Numerical simulations were performed to characterize the acoustic edge of the SonoKnife using an acoustic model based on the free-access FOCUS software and a thermal model using Pennes’ bio-heat transfer equation. Static transducer simulations showed that a SonoKnife could generate a thermally ablative line-focus while step-scanning simulations support the feasibility of scanning the line-focus to treat “carve” out tumors. The parametric study also showed that the operating frequency was most influential on the dimensions of the acoustic edge, while the radius of curvature was most influential on the values of the field parameters. In general, the geometry of the transducer strongly affected both the field parameters and the size of the acoustic edge. A prototype transducer was built for experiments. Pressure distributions measured in water agreed well with simulated distributions. Lesioning experiments in gel phantom and ex vivo liver provided information on the size and shape of thermal lesions created by the SonoKnife during static sonications and their general agreement with the modeling results. The data presented in this report support the feasibility of the SonoKnife concept for thermal ablation of superficial tumors. Further characterization will include modeling of nonlinear effects in heterogeneous tissues (including bone and air cavities), extensive thermal simulations of a scanning and variable-length acoustic edge, and in vivo studies.
ACKNOWLEDGMENTS
This work was supported by a NIH/NCI grant RC1 CA147697 (PI: EGM). We gratefully acknowledge general research support from the Central Arkansas Radiation Therapy Institute (CARTI). The authors would like to thank Robert J. McGough from Michigan State University for making the FOCUS simulation package an open source, and Xiaozheng Zeng for useful discussions.
References
- Chin D., Boyle G. M., Porceddu S., Theile D. R., Parsons P. G., and Coman W. B., “Head and neck cancer: past, present and future,” Expert Rev. Anticancer Ther. 6 (7), 1111–1118 (2006). 10.1586/14737140.6.7.1111 [DOI] [PubMed] [Google Scholar]
- Lefebvre J. L., “Current clinical outcomes demand new treatment options for SCCHN,” Ann. Oncol. 16 (Suppl 6), vi7–vi12 (2005). 10.1093/annonc/mdi452 [DOI] [PubMed] [Google Scholar]
- Casaril A., Abu Hilal M., Harb A., Campagnaro T., Mansueto G., and Nicoli N., “The safety of radiofrequency thermal ablation in the treatment of liver malignancies,” Eur. J. Surg. Oncol. 34 (6), 668–672 (2008). [DOI] [PubMed] [Google Scholar]
- Margreiter M. and Marberger M., “Focal therapy and imaging in prostate and kidney cancer: high-intensity focused ultrasound ablation of small renal tumors,” J. Endourol 24 (5), 745–748 (2010). 10.1089/end.2009.0624 [DOI] [PubMed] [Google Scholar]
- Esnault O., Franc B., and Chapelon J. Y., “Localized ablation of thyroid tissue by high-intensity focused ultrasound: improvement of noninvasive tissue necrosis methods,” Thyroid 19 (10), 1085–1091 (2009). 10.1089/thy.2009.0121 [DOI] [PubMed] [Google Scholar]
- Timmerman R. D., Bizekis C. S., Pass H. I., Fong Y., Dupuy D. E., Dawson L. A., and Lu D., “Local surgical, ablative, and radiation treatment of metastases,” Ca-Cancer J. Clin. 59 (3), 145–170 (2009). 10.3322/caac.20013 [DOI] [PubMed] [Google Scholar]
- Nguyen C. T. and Campbell S. C., “Salvage of local recurrence after primary thermal ablation for small renal masses,” Expert Rev. Anticancer Ther. 8 (12), 1899–1905 (2008). 10.1586/14737140.8.12.1899 [DOI] [PubMed] [Google Scholar]
- Crocetti L. and Lencioni R., “Thermal ablation of hepatocellular carcinoma,” Cancer Imaging 8 19–26 (2008). 10.1102/1470-7330.2008.0004 [DOI] [PMC free article] [PubMed] [Google Scholar]
- Taran F. A., Tempany C. M., Regan L., Inbar Y., Revel A., and Stewart E. A., “Magnetic resonance-guided focused ultrasound (MRgFUS) compared with abdominal hysterectomy for treatment of uterine leiomyomas,” Ultrasound Obstet. Gynecol. 34 (5), 572–578 (2009). 10.1002/uog.7435 [DOI] [PubMed] [Google Scholar]
- Shen S. H., Fennessy F., McDannold N., Jolesz F., and Tempany C., “Image-guided thermal therapy of uterine fibroids,” Semin Ultrasound CT MR 30 (2), 91–104 (2009). 10.1053/j.sult.2008.12.002 [DOI] [PMC free article] [PubMed] [Google Scholar]
- Hynynen K., “MRI-guided focused ultrasound treatments,” Ultrasonics 50 (2), 221–229 (2010). 10.1016/j.ultras.2009.08.015 [DOI] [PubMed] [Google Scholar]
- Carrafiello G., Lagana D., Mangini M., Fontana F., Dionigi G., Boni L., Rovera F., Cuffari S., and Fugazzola C., “Microwave tumors ablation: principles, clinical applications and review of preliminary experiences,” Int. J. Surg. 6 (Suppl 1) S65–S69 (2008). 10.1016/j.ijsu.2008.12.028 [DOI] [PubMed] [Google Scholar]
- Gough-Palmer A. L. and Gedroyc W. M., “Laser ablation of hepatocellular carcinoma—a review,” World J. Gastroenterol. 14 (47), 7170–7174 (2008). 10.3748/wjg.14.7170 [DOI] [PMC free article] [PubMed] [Google Scholar]
- Penagaricano J. A., Moros E., Novak P., Yan Y., and Corry P., “Feasibility of concurrent treatment with the scanning ultrasound reflector linear array system (SURLAS) and the helical tomotherapy system,” Int. J. Hyperthermia 24 (5), 377–388 (2008). 10.1080/02656730801929923 [DOI] [PMC free article] [PubMed] [Google Scholar]
- Kampinga H. H., “Cell biological effects of hyperthermia alone or combined with radiation or drugs: a short introduction to newcomers in the field,” Int. J. Hyperthermia 22 (3), 191–196 (2006). 10.1080/02656730500532028 [DOI] [PubMed] [Google Scholar]
- Grieco C. A., Simon C. J., Mayo W. W.-Smith, DiPetrillo T. A., Ready N. E., and Dupuy D. E., “Percutaneous image-guided thermal ablation and radiation therapy: outcomes of combined treatment for 41 patients with inoperable stage I/II non-small-cell lung cancer,” J. Vasc. Interv. Radiol. 17 (7), 1117–1124 (2006). 10.1097/01.RVI.0000228373.58498.6E [DOI] [PubMed] [Google Scholar]
- Haar G. T. and Coussios C., “High intensity focused ultrasound: physical principles and devices,” Int. J. Hyperthermia 23 (2), 89–104 (2007). 10.1080/02656730601186138 [DOI] [PubMed] [Google Scholar]
- Fan X. and Hynynen K., “Ultrasound surgery using multiple sonications—treatment time considerations,” Ultrasound Med. Biol. 22 (4), 471–482 (1996). 10.1016/0301-5629(96)00026-9 [DOI] [PubMed] [Google Scholar]
- McDannold N. J., Jolesz F. A., and Hynynen K. H., “Determination of the optimal delay between sonications during focused ultrasound surgery in rabbits by using MR imaging to monitor thermal buildup in vivo,” Radiology 211 (2), 419–426 (1999). [DOI] [PubMed] [Google Scholar]
- Jeong J. S., Cannata J. M., and Shung K. K., “Dual-focus therapeutic ultrasound transducer for production of broad tissue lesions,” Ultrasound Med. Biol. 36 (11), 1836–1848 (2010). 10.1016/j.ultrasmedbio.2010.08.008 [DOI] [PMC free article] [PubMed] [Google Scholar]
- O’Neill B. E., Karmonik C., and Li K. C., “An optimum method for pulsed high intensity focused ultrasound treatment of large volumes using the InSightec ExAblate(R) 2000 system,” Phys. Med. Biol. 55 (21), 6395–6410 (2010). 10.1088/0031-9155/55/21/004 [DOI] [PMC free article] [PubMed] [Google Scholar]
- Liu H. L., Shih T. C., Chen W. S., and Ju K. C., “A novel strategy to increase heating efficiency in a split-focus ultrasound phased array,” Med. Phys. 34 (7), 2957–2967 (2007). 10.1118/1.2746508 [DOI] [PubMed] [Google Scholar]
- Patel P. R., Luk A., Durrani A., Dromi S., Cuesta J., Angstadt M., Dreher M. R., Wood B. J., and Frenkel V., “In vitro and in vivo evaluations of increased effective beam width for heat deposition using a split focus high intensity ultrasound (HIFU) transducer,” Int. J. Hyperthermia 24 (7), 537–549 (2008). 10.1080/02656730802064621 [DOI] [PMC free article] [PubMed] [Google Scholar]
- Sasaki K., Azuma T., Kawabata K. I., Shimoda M., Kokue E. I., and Umemura S. I., “Effect of split-focus approach on producing larger coagulation in swine liver,” Ultrasound Med. Biol. 29 (4), 591–599 (2003). 10.1016/S0301-5629(02)00792-5 [DOI] [PubMed] [Google Scholar]
- Kohler M. O., Mougenot C., Quesson B., Enholm J., Le Bail B., Laurent C., Moonen C. T., and Ehnholm G. J., “Volumetric HIFU ablation under 3D guidance of rapid MRI thermometry,” Med. Phys. 36 (8), 3521–3535 (2009). 10.1118/1.3152112 [DOI] [PubMed] [Google Scholar]
- Li D., Shen G., Luo H., Bai J., and Chen Y., “A study of heating duration and scanning path in focused ultrasound surgery,” J. Med. Syst. [DOI] [PubMed]
- Baron C., Aubry J. F., Tanter M., Meairs S., and Fink M., “Simulation of intracranial acoustic fields in clinical trials of sonothrombolysis,” Ultrasound Med. Biol. 35 (7), 1148–1158 (2009). 10.1016/j.ultrasmedbio.2008.11.014 [DOI] [PubMed] [Google Scholar]
- Farny C. H., Glynn Holt R., and Roy R. A., “The correlation between bubble-enhanced HIFU heating and cavitation power,” IEEE Trans. Biomed. Eng. 57 (1), 175–184 (2010). 10.1109/TBME.2009.2028133 [DOI] [PubMed] [Google Scholar]
- Liu X., Li J., Gong X., and Zhang D., “Nonlinear absorption in biological tissue for high intensity focused ultrasound,” Ultrasonics 44 (Suppl 1), e27–e30 (2006). 10.1016/j.ultras.2006.06.035 [DOI] [PubMed] [Google Scholar]
- Moros E. G., Penagaricano J. A., Novák P., Straube W. L., and Myerson R. J., “Present and future technology for simultaneous superficial thermoradiotherapy of breast cancer,” Int. J. Hyperthermia 26 (7), 699–709 (2010). 10.3109/02656736.2010.493915 [DOI] [PMC free article] [PubMed] [Google Scholar]
- McGough R. J., “FOCUS: Fast Object-oriented C ++ Ultrasound Simulator, http://www.egr.msu.edu/focus-ultrasound,” (2010).
- Chen D., Kelly J. F. and McGough R. J., “A fast near-field method for calculations of time-harmonic and transient pressures produced by triangular pistons,” J. Acoust. Soc. Am. 120 (5 Pt 1), 2450–2459 (2006). 10.1121/1.2356839 [DOI] [PMC free article] [PubMed] [Google Scholar]
- McGough R. J., “Rapid calculations of time-harmonic nearfield pressures produced by rectangular pistons,” J. Acoust. Soc. Am. 115 (5 Pt 1), 1934–1941 (2004). 10.1121/1.1694991 [DOI] [PMC free article] [PubMed] [Google Scholar]
- Williams G. E., Fourier acoustics: Sound radiation and nearfield acoustical holography (Academic, London, 1999). [Google Scholar]
- Liu D. L. and Waag R. C., “Propagation and backpropagation for ultrasonic wavefront design,” IEEE Trans. Ultrason. Ferroelectr. Freq. Control 44 (1), 1–13 (1997). [DOI] [PubMed] [Google Scholar]
- Kinsler L. E., Frey A. R., Coppens A. B., and Sanders J. V., Fundamentals of Acoustics., 4th ed., (John Wiley and Sons, New York, 2000). [Google Scholar]
- Pennes H. H., “Analysis of tissue and arterial blood temperature in the resting human forearm,” J. Appl. Physiol. 1 (2), 93–102 (1948). [DOI] [PubMed] [Google Scholar]
- Cavicchi T. J. and W. D.O′Brien, Jr., “Heat generated by ultrasound in an absorbing medium,” J. Acoust. Soc. Am. 76 (4), 1244–1245 (1984). 10.1121/1.391374 [DOI] [PubMed] [Google Scholar]
- Moros E. G., Dutton A. W., Roemer R. B., Burton M., and Hynynen K., “Experimental evaluation of two simple thermal models using hyperthermia in muscle in vivo,” Int. J. Hyperthermia 9 (4), 581–598 (1993). 10.3109/02656739309005054 [DOI] [PubMed] [Google Scholar]
- Moros E. G., Roemer R. B., and Hynynen K., “Simulations of scanned focused ultrasound hyperthermia—the effects of scanning speed and pattern on the temperature-fluctuations at the focal depth,” IEEE Trans. Ultrason. Ferroelectr. Freq. Control 35 (5), 552–560 (1988). 10.1109/58.8033 [DOI] [PubMed] [Google Scholar]
- Sapareto S. A. and Dewey W. C., “Thermal dose determination in cancer therapy,” Int. J. Radiat. Oncol., Biol., Phys. 10 (6), 787–800 (1984). 10.1016/0360-3016(84)90379-1 [DOI] [PubMed] [Google Scholar]
- Van der Gaag M. L., De Bruijne M., Samaras T., Van der Zee J., and Van Rhoon G. C., “Development of a guideline for the water bolus temperature in superficial hyperthermia,” Int. J. Hyperthermia 22 (8), 637–656 (2006). 10.1080/02656730601074409 [DOI] [PubMed] [Google Scholar]
- Diederich C. J., Stauffer P. R., and Bozzo D., “An improved bolus configuration for commercial multielement ultrasound and microwave hyperthermia systems,” Med. Phys. 21 (9), 1401–1403 (1994). 10.1118/1.597196 [DOI] [PubMed] [Google Scholar]
- Takegami K., Kaneko Y., Watanabe T., Maruyama T., Matsumoto Y., and Nagawa H., “Polyacrylamide gel containing egg white as new model for irradiation experiments using focused ultrasound,” Ultrasound Med. Biol. 30 (10), 1419–1422 (2004). 10.1016/j.ultrasmedbio.2004.07.016 [DOI] [PubMed] [Google Scholar]
- Chen G. S., Cannata J., Liu R. B., Chang H., and Shung K. K., “Design and fabrication of high-intensity focused ultrasound phased array for liver tumor therapy,” Biomed. Eng. Appl. Basis Commun. 21 (3), 187–192 (2009). 10.4015/S1016237209001246 [DOI] [Google Scholar]
- Ho C. S., Ju K. C., Cheng T. Y., Chen Y. Y., and Lin W. L., “Thermal therapy for breast tumors by using a cylindrical ultrasound phased array with multifocus pattern scanning: a preliminary numerical study,” Phys. Med. Biol. 52 (15), 4585–4599 (2007). 10.1088/0031-9155/52/15/015 [DOI] [PubMed] [Google Scholar]
- Ebbini E. S. and Cain C. A., “Optimization of the intensity gain of multiple-focus phased-array heating patterns,” Int. J. Hyperthermia 7 (6), 953–973 (1991). 10.3109/02656739109056461 [DOI] [PubMed] [Google Scholar]
- Lu X. Q., Burdette E. C., Bornstein B. A., Hansen J. L., and Svensson G. K., “Design of an ultrasonic therapy system for breast cancer treatment,” Int. J. Hyperthermia 12 (3), 375–399 (1996). 10.3109/02656739609022526 [DOI] [PubMed] [Google Scholar]
- Bakker J. F., Paulides M. M., Obdeijn I. M., van Rhoon G. C., and van Dongen K. W., “An ultrasound cylindrical phased array for deep heating in the breast: theoretical design using heterogeneous models,” Phys. Med. Biol. 54 (10), 3201–3215 (2009). 10.1088/0031-9155/54/10/016 [DOI] [PubMed] [Google Scholar]
- Lele P. P., United States Patent and Trademark Office, U. S. Patent No.4938216 (July, 3, 1990).
- Ross A. B., Diederich C. J., Nau W. H., Rieke V., Butts R. K., Sommer G., Gill H., and Bouley D. M., “Curvilinear transurethral ultrasound applicator for selective prostate thermal therapy,” Med. Phys. 32 (6), 1555–1565 (2005). 10.1118/1.1924314 [DOI] [PubMed] [Google Scholar]
- Wootton J. H., Ross A. B., and Diederich C. J., “Prostate thermal therapy with high intensity transurethral ultrasound: the impact of pelvic bone heating on treatment delivery,” Int. J. Hyperthermia 23 (8), 609–622 (2007). 10.1080/02656730701744794 [DOI] [PubMed] [Google Scholar]
- Damianou C. A., Sanghvi N. T., Fry F. J., and Maass R.-Moreno, “Dependence of ultrasonic attenuation and absorption in dog soft tissues on temperature and thermal dose,” J. Acoust. Soc. Am. 102 (1), 628–634 (1997). 10.1121/1.419737 [DOI] [PubMed] [Google Scholar]
- Dewhirst M. W., Viglianti B. L., Lora M.-Michiels, Hanson M., and Hoopes P. J., “Basic principles of thermal dosimetry and thermal thresholds for tissue damage from hyperthermia,” Int. J. Hyperthermia 19 (3), 267–294 (2003). 10.1080/0265673031000119006 [DOI] [PubMed] [Google Scholar]
- Peters R. D., Chan E., Trachtenberg J., Jothy S., Kapusta L., Kucharczyk W., and Henkelman R. M., “Magnetic resonance thermometry for predicting thermal damage: an application of interstitial laser coagulation in an in vivo canine prostate model,” Magn. Reson. Med. 44 (6), 873–883 (2000). [DOI] [PubMed] [Google Scholar]
- Wu F., Wang Z. B., Cao Y. D., Zhu X. Q., Zhu H., Chen W. Z., and Zou J. Z., “Wide local ablation of localized breast cancer using high intensity focused ultrasound,” J. Surg. Oncol. 96 (2), 130–136 (2007). 10.1002/jso.v96:2 [DOI] [PubMed] [Google Scholar]
- Vaezy S. and Zderic V., “Hemorrhage control using high intensity focused ultrasound,” Int. J. Hyperthermia 23 (2), 203–211 (2007). 10.1080/02656730601169779 [DOI] [PubMed] [Google Scholar]
- Parikh S., Motarjeme A., McNamara T., Raabe R., Hagspiel K., Benenati J. F., Sterling K., and Comerota A., “Ultrasound-accelerated thrombolysis for the treatment of deep vein thrombosis: initial clinical experience,” J. Vasc. Interv. Radiol. 19 (4), 521–528 (2008). 10.1016/j.jvir.2007.11.023 [DOI] [PubMed] [Google Scholar]
- Raabe R. D., “Ultrasound-accelerated thrombolysis in arterial and venous peripheral occlusions: fibrinogen level effects,” J. Vasc. Interv. Radiol. 21 (8), 1165–1172 (2010). 10.1016/j.jvir.2010.03.020 [DOI] [PubMed] [Google Scholar]
- Aubry J. F., Pernot M., Marquet F., Tanter M., and Fink M., “Transcostal high-intensity-focused ultrasound: ex vivo adaptive focusing feasibility study,” Phys. Med. Biol. 53 (11), 2937–2951 (2008). 10.1088/0031-9155/53/11/012 [DOI] [PMC free article] [PubMed] [Google Scholar]
- Chen W., Zhu H., Zhang L., Li K., Su H., Jin C., Zhou K., Bai J., Wu F., and Wang Z., “Primary bone malignancy: effective treatment with high-intensity focused ultrasound ablation,” Radiology 255 (3), 967–978 (2010). 10.1148/radiol.10090374 [DOI] [PubMed] [Google Scholar]
- Liberman B., Gianfelice D., Inbar Y., Beck A., Rabin T., Shabshin N., Chander G., Hengst S., Pfeffer R., Chechick A., Hanannel A., Dogadkin O., and Catane R., “Pain palliation in patients with bone metastases using MR-guided focused ultrasound surgery: a multicenter study,” Ann. Surg. Oncol. 16 (1), 140–146 (2009). 10.1245/s10434-008-0011-2 [DOI] [PubMed] [Google Scholar]
- Moros E. G. and Hynynen K., “A comparison of theoretical and experimental ultrasound field distributions in canine muscle tissue in vivo,” Ultrasound Med. Biol. 18 (1), 81–95 (1992). 10.1016/0301-5629(92)90011-X [DOI] [PubMed] [Google Scholar]


