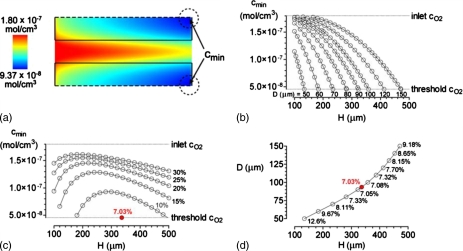
Figure 2.
Optimization for the case of ΔP=20 cm H2O, η=0.7 cP, L=2 cm, K=10−10 cm4∕dyn s, qO2=10−8 mol∕cm3 s, and kO2=1.2×10⁻⁹ mol∕cm3 mm Hg. (a) Color map of oxygen concentration for D=100 μm and H=300 μm. The minimum oxygen concentration cmin in this model is 9.37×10⁻⁸ mol∕cm3. Flow is from left to right. (b) Plots of cmin vs vascular spacing H for various vascular diameters D. (c) Plots of cmin vs H for various vascular volume fractions. (d) Plot of D vs H for models in which cmin=4.56×10⁻⁸ mol∕cm3. Vascular volume fractions are noted as percentages. The optimal D and H (red dots) are 93.6 and 336.2 μm, respectively.

