Abstract
Oxygen and glucose supply is one of the important factors for the growth and viability of the cells in cultivation of tissues, e.g., spheroid, multilayered cells, and three-dimensional tissue construct. In this study, we used finite element methods to simulate the flow profile as well as oxygen and glucose supply to the multilayered cells in a microwell array chip for static and perfusion cultures. The simulation results indicated that oxygen supply is more crucial than glucose supply in both static and perfusion cultures, and that the oxygen supply through the wall of the perfusion culture chip is important in perfusion cultures. Glucose concentrations decline with time in static cultures, whereas they can be maintained at a constant level over time in perfusion cultures. The simulation of perfusion cultures indicated that the important parameters for glucose supply are the flow rate of the perfusion medium and the length of the cell culture chamber. In a perfusion culture chip made of oxygen-permeable materials, e.g., polydimethylsiloxane, oxygen is hardly supplied via the perfusion medium, but mainly supplied through the walls of the perfusion culture chip. The simulation of perfusion cultures indicated that the important parameters for oxygen supply are the thickness of the flow channel and the oxygen permeability of the walls of the channel, i.e., the type of material and the thickness of the wall.
INTRODUCTION
The cell-based assay is an important analytical method in drug discovery.1, 2 However, one of the drawbacks of conventional cell-based assays in the drug discovery is the lowered function of the cells in comparison to cells in vivo. To overcome this drawback, the use of microprocesses, e.g., microfabrication,3, 4, 5 microfluidics,6, 7, 8 and micropatterning,9, 10, 11 is on the rise, and the microprocesses are making it easier to precisely control the “cell culture environment.”12, 13
Recently, we and other research groups have developed the perfusion culture microchamber array chips6, 7, 8 and have applied the perfusion culture microchamber array chips to drug toxicity testing.14 In the perfusion cultures on microchips, the growth and morphology of the cells were affected by the flow rate of the perfusion medium.6, 14 On the other hand, in the static culture, Nakazawa et al. also found that the spheroids in the central area of the microwell array were smaller than that in the periphery area (data not shown). These results indicate that the oxygen and glucose supply is important for the cell growth and cell viability for the perfusion culture in the microchamber array and static spheroid culture in the microwell array.
Generally, most of the microfluidic cell culture chips in the previous studies are made of polydimethylsiloxane (PDMS), which has high gas permeability.15 The high gas permeability potentially enables the oxygen supply through the wall of the chips. Rates of oxygen and glucose supply in a microchamber and microwell on a chip can be formulated by using normal-reaction diffusion equations.16 Sumaru et al.17 reported that the oxygen supply, rather than glucose supply, is critical for cell culture in microchips. Based on this finding, we hypothesized that oxygen supply is critical in perfusion culture in the microchamber array and static spheroid culture in the microwell array, and that oxygen supply to the cells grown in a static culture is potentially poorer than that in a perfusion microchamber.
However, it is practically impossible to solve the equations that have been derived for an actual microchamber and a microwell on a chip. In this study, we studied the complex reaction diffusion phenomena by using the finite element method (FEM). We compared oxygen and glucose supply to multilayered cells in a microwell array chip for static and perfusion cultures, and confirmed superior supply of both oxygen and glucose in the perfusion culture.
MODELS FOR FEM
In this study, we assumed that 1024 (32×32) microwells (300 μm in diameter and depth) were arrayed in a reticular pattern at a pitch of 330 μm on a plane, similar to that used by Nakazawa and colleagues.3, 4, 5 We used a commercially available FEM software, COMSOL MULTIPHYSICS version 3.5a (COMSOL; Burlington, MA), to make a three-dimensional model of the microwell array chip and to calculate velocity and concentration profiles in the models.
Model for static culture
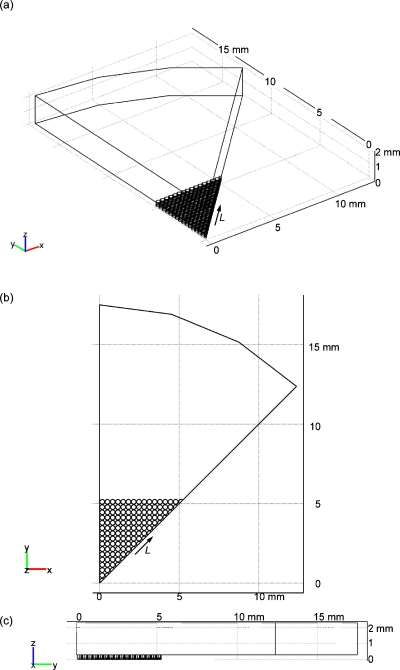
We assumed that the microwells described above were arrayed at the center of the bottom of a 35 mm diameter Petri dish. To reduce the memory and calculation load of the computer, we made a model of one-eighth part of the Petri dish (Fig. 1) considering the symmetry of the circular Petri dish and the square-shaped microwell array. Based on the aforementioned experiments,3, 4, 5 the depth of the cell culture medium was assumed to be 2 mm and cells seeded into the microwells were assumed to form layers that were 92.1 μm thick at the bottom of the microwells. The thickness was calculated by assuming that the cell density was 1.5×10¹⁴ cells∕m3 and that 1×10⁶ cells were seeded into all of the 1024 microwells. The thickness of the cell layer corresponds to the five cell layers.
Figure 1.
Geometric model for the static culture: (a) perspective view and (b) top view.
Model for perfusion culture
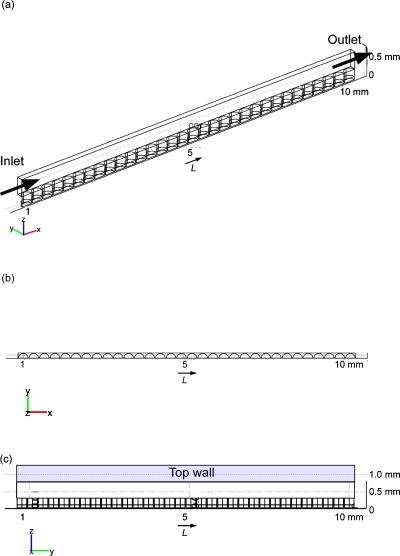
We assumed that the microwells described above were arrayed at the bottom of a parallel flow channel that was 500 μm thick. To reduce the memory and calculation load of the computer, we made a model of half of one line of the microwells (Fig. 2). The layer of the seeded cells was assumed to be the same as that described in Sec. 2A.
Figure 2.
Geometric model for the perfusion culture: (a) perspective view and (b) top view.
Calculations
The flow velocity profile in the perfusion culture model was calculated with the Navier–Stokes equations. The viscosity and density of the medium were assumed to be the same as those of water at 310 K. The medium was assumed to be fed from the inlet [the far left square in Fig. 2a] at a uniform velocity. Any flow of the medium was not considered in the static culture model.
The concentration profiles for both the static and the perfusion culture models were calculated with a normal-reaction diffusion equation as follows:
| (1) |
where C denotes the concentration (mol∕m3), t is the time (seconds), and D is the diffusion coefficient (m2∕s). R denotes the consumption rate (mol∕m3 s), which was zero in the medium.
The value of R was assumed to follow the Michaelis–Menten kinetics:
| (2) |
where Vmax denotes the maximal consumption rate (mol∕m3 s) and Kh is the Michaelis constant (mol∕m3).
In this study, we focused on the concentration profiles for oxygen and glucose because these are the essential factors in cell culture. We assumed the D values for oxygen and glucose in the medium and cell layer are the same values as those of water at 310 K and estimated them to be 2.10×10⁻⁹ and 9.91×10⁻¹⁰ m2∕s for oxygen and glucose, respectively. The values of Vmax and Kh for oxygen consumption by rat primary hepatocytes were found to be 2.0×10⁻¹⁶ mol∕s cell and 4.05×10⁻³ mol∕m3, respectively, based on the data obtained by Foy et al.18 Not finding any values in literature, we estimated the Vmax and Kh values for glucose in the microwells to be one-sixth of the corresponding values for oxygen because aerobic respiration consumes 6 moles of oxygen per mole of glucose.
The mode of mesh generation for a model generally affects the results obtained by FEM. In this study, the mesh was generated by the automatic mode of COMSOL and the total number of tetrahedral elements was 139 160 for the static culture model and 53 640 for the perfusion model.
To reduce the computational load and memory, the velocity profile at a steady state was first calculated, and the concentration profile was then calculated for oxygen or glucose by using the predetermined velocity profile.
RESULTS AND DISCUSSION
Static culture
We calculated time-dependent concentration profiles in the static culture model shown in Fig. 1 by assuming that the oxygen concentration in the uppermost layer of the medium was constant at 0.192 mol∕m3; this value is the oxygen concentration in water that has been equilibrated with air containing saturated water vapor and 5% carbon dioxide at 310 K. The initial oxygen concentration in the medium and the cell layer was 0.192 mol∕m3, also. The initial glucose concentration in the medium and the cell layer was 5.56 mol∕m3, assuming that Eagle’s minimal essential medium was used.
It is well known that diffusion reaches a pseudosteady state at a time (seconds) of l2∕D, where l is the diffusion distance (meters).19 As the diffusion of oxygen and glucose was relatively fast compared to the consumption of oxygen and glucose by the cells, we assumed that the consumption of oxygen and glucose would not affect their concentration profiles in a pseudosteady state. Therefore, the concentrations for these two factors were assumed to reach a pseudosteady state at l2∕D. Here, l2∕D was 1900 s for oxygen and 4040 s for glucose, assuming that l is 2 mm, which is the thickness of the medium.
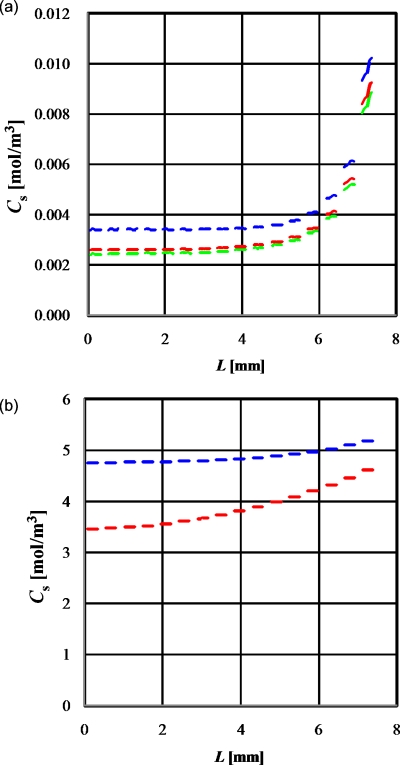
Generally, the oxygen concentration reaches a steady state, wherein the rate of oxygen supply through the surface of the medium is equal to the rate of oxygen consumption by the cells. As seen from the model shown in Fig. 1, the oxygen concentration profiles at the surface of the cell layers, aligned at 45° in the microwells, were calculated every second for 1900∕4, 1900∕2, and 1900 s, as shown in Fig. 3a. The Cs values denote the concentration of oxygen or glucose at the surface of the cell layers and L is the distance (meters) from the center to the corner of the chip. Figure 3a indicates that the oxygen concentration almost achieved a steady state at 1900 s.
Figure 3.
Concentration profiles at the surface of the cell layers aligned at 45° in the microwells as per the static culture model shown in Fig. 1. (a) Oxygen concentration at 1900/4, 1900/2, and 1900 s for blue, red, and green lines, respectively. (b) Glucose concentration at 4040 s and 10×4040 s for blue and red line, respectively.
The glucose concentrations obtained at the same points and at 4040 s and 10×4040 s are shown in Fig. 3b. The glucose concentration almost achieved a pseudosteady state at 4040 s (data not shown) and gradually decreased after achieving a pseudosteady state because of the glucose consumption by the cultured cells. Generally, the static culture requires medium exchange every 1–3 days due to this gradual glucose consumption and glucose concentration changes through this culture period.
The glucose concentration was much higher than Kh (6.75×10⁻⁴ mol∕m3) even in the central region of the chip, and the result indicates adequately high glucose concentration for multilayer cell culture. On the other hand, oxygen concentration in this region was lower than Kh (4.05×10⁻³ mol∕m3), suggesting that it was very difficult to maintain aerobic respiration in the deeper levels of the cell layer in the central area of the microwell array. Indeed, oxygen concentration did not remain enough high even in the peripheral region of the microwells. These results reveal that oxygen supply is a more crucial factor for cell culture than glucose supply.17
Perfusion culture
In the perfusion culture model shown in Fig. 2, time-dependent concentration profiles were calculated for oxygen and glucose every 2 s until the average retention times of the perfusion medium for three different inlet velocities. The retention times were 1056 s for the inlet velocity of 1×10⁻⁵ m∕s, 10 560 s for 1×10⁻⁶ m∕s, and 105 600 s for 1×10⁻⁷ m∕s. The initial concentration of oxygen in the flow channel and cell layer, and that in the medium fed into the flow channel, was 0.192 mol∕m3, and that of glucose was 5.56 mol∕m3; these values are the same value we used for the static culture.
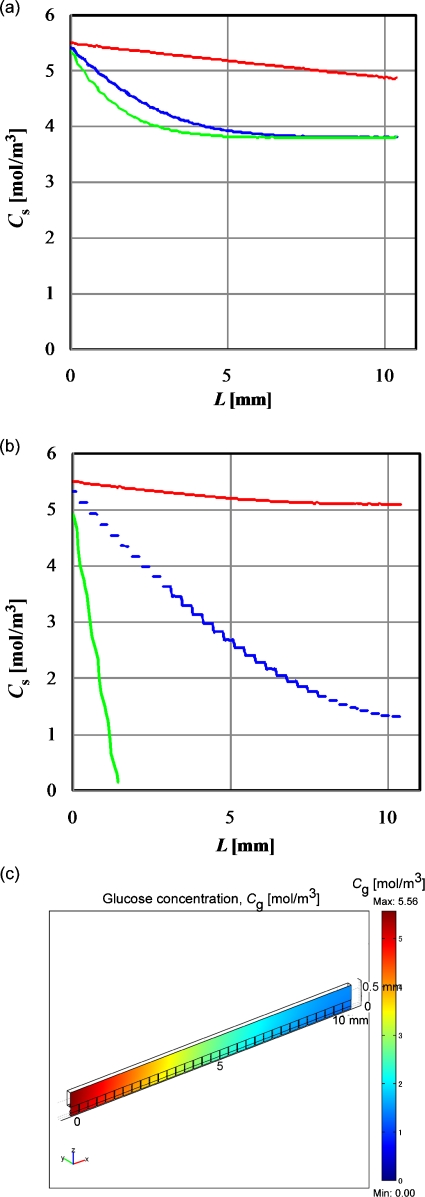
Figures 4a, 4b show the glucose concentration profiles at the surface of the cell layers in the microwells at l2∕D and the retention time, respectively. Figure 4c shows the glucose concentration profile at the x-z plane shown in Fig. 2. The value of L denotes the distance (meters) from the inlet of the flow channel. Except for the result obtained with the velocity of 1×10⁻⁵ m∕s, the overall glucose concentrations shown in Fig. 4b were less than that obtained for the static culture shown in Fig. 3b. Especially, the glucose concentration drastically decreased at the downstream area in the case of low flow velocity. This phenomenon probably explains the effect of the flow rate of perfusion medium observed in the previous studies.6, 14 However, except for the result obtained with a velocity of 1×10⁻⁷ m∕s, the overall glucose concentration remained higher than the Kh (6.75×10⁻⁴ mol∕m3) throughout the flow microchannel. In addition, the glucose concentration obtained for the static culture decreased with increasing culture time as shown in Fig. 3b, whereas the glucose concentration was maintained at a constant level in the perfusion culture wherein cells were being continuously cultured under flowing medium with an appropriate flow rate. This is one of the advantages of perfusion culture.
Figure 4.
Glucose concentration profiles in the microwells in the perfusion culture model shown in Fig. 2. (a) Glucose concentration at the surface of the cell layers at 4040 s. The inlet velocities of the medium are 1×10⁻⁵, 1×10⁻⁶, and 1×10⁻⁷ m∕s for red, blue, and green lines, respectively. (b) Glucose concentration profile at the surface of the cell layers at retention time. The inlet velocities of the medium and retention times are 1×10⁻⁵ m∕s and 1056 s, 1×10⁻⁶ m∕s and 10 560 s, and 1×10⁻⁷ m∕s and 105 600 s for red, blue, and green lines, respectively. (c) Glucose concentration profile at the x-z plane with 1×10⁻⁶ m∕s inlet velocity at 10 560 s.
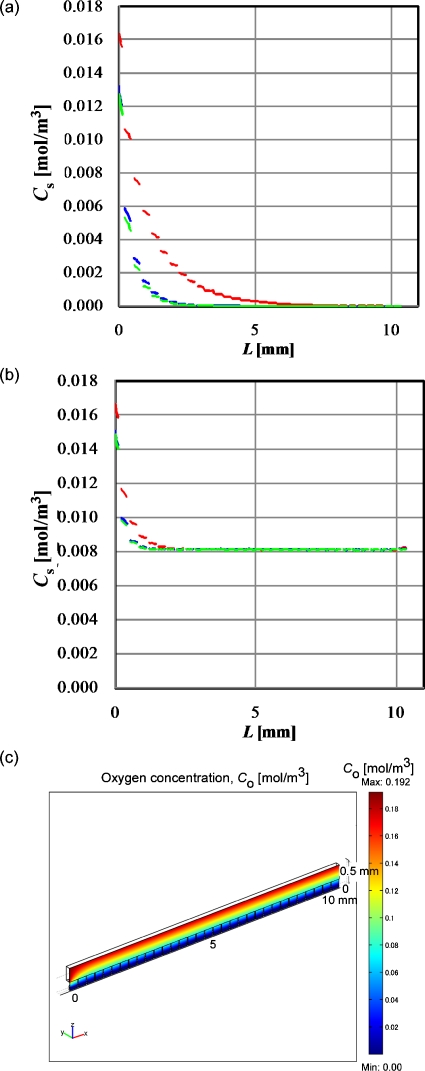
Figure 5a shows the oxygen concentration profiles at the surface of the cell layers in the microwells composed of oxygen-impermeable wall at the retention time. The oxygen concentration shown in Fig. 5a was much lower in most of the area of the microwells, even at the highest perfusion flow rate, than that of the oxygen concentration in static cultures shown in Fig. 3a. The practical perfusion culture chips were often made of PDMS6, 7, 8 and are known for high oxygen permeability. The oxygen flux, Js (mol∕m2 s), through a wall made of PDMS with a thickness, δ (meters), can be calculated as follows:
| (3) |
where Dw denotes the diffusion coefficient (m2∕s) of oxygen in PDMS, αw and αm are the sorption coefficients (mol∕m3 mm Hg) of oxygen into PDMS and water, respectively, Pa is the partial oxygen pressure (mm Hg) at the outer surface of the PDMS wall, and Cm is the oxygen concentration (mol∕m3) at the inner surface of the PDMS wall.
Figure 5.
Oxygen concentration profiles at the average retention time in the microwells in the perfusion culture model shown in Fig. 2. (a) Oxygen concentration at the surface of the cell layers oxygen-impermeable top wall. The inlet velocities of the medium are 1×10⁻⁵, 1×10⁻⁶, and 1×10⁻⁷ m∕s for red, blue, and green lines, respectively. (b) Oxygen concentration profile in the microwells with oxygen-permeable top wall. The inlet velocities of the medium are 1×10⁻⁵, 1×10⁻⁶, and 1×10⁻⁷ m∕s for red, blue, and green lines, respectively. (c) Oxygen concentration profile in the microwells with oxygen-permeable top wall at the x-z plane with 1×10⁻⁶ m∕s inlet velocity at 10 560 s.
Assuming that the top wall of the flow channel shown in Fig. 2a was made of PDMS and its thickness was 500 μm, Pa, Dw, αw, and αm were found to be 142 mm Hg, 3.4×10⁻⁹ m2∕s, 1.35×10⁻³ mol∕m3 mm Hg, and 1.06×10⁻² mol∕m3 mm Hg, respectively. The oxygen concentration at the surface of the cell layers in the microwells was calculated at the corresponding retention times [Fig. 5b]. With increasing L, the oxygen concentration became constant at about 0.008 mol∕m3, which is much higher than that obtained for the static culture and is higher than the Kh values for oxygen, 4.05×10⁻³ mol∕m3. Figure 5c shows the oxygen concentration profile at the x-z plane shown in Fig. 2. The concentration gradient was formed in the direction of the z-axis and the gradient was driving force for oxygen transfer.
These results reveal that oxygen supply through the PDMS wall is very crucial even in perfusion cultures, as discussed in the previous paper.17 Provin et al.20 also pointed out the importance of oxygen supply through the gas permeable wall based on their experimental results, in which high-density-cultured HepG2 cells in the perfusion culture exhibited the low oxygen consumption. Mehta et al.21 also reported that the flow rate of the media does not significantly affect the oxygen uptake by cells in the PDMS microfluidic perfusion culture chip, of which the result is consistent with our calculated results.
In the case of the perfusion culture chips with PDMS wall, the maximal oxygen flux through a PDMS wall can be calculated by using Eq. 3 at Cm=0, which we can imagine in the case of a very high diffusion coefficient or a very thin flow channel and a very high consumption rate. Therefore, the maximal rate of oxygen supply through a PDMS wall is equal to DwαwPaAt∕δ, where At is the area (m2) of the top wall of the flow channel. As Pa can be converted to concentration in the equation, Ca=αmPa, the maximal oxygen supply rate through a PDMS wall is DwαwCaAt∕αmδ. On the other hand, the maximal rate of oxygen supply in the perfusion medium is UiAiCi, where Ui denotes the uniform flow velocity (m∕s) at the inlet of the channel, Ai denotes the area of the inlet (m2), and Ci denotes the oxygen concentration (mol∕m3) at the inlet.
In the case discussed here, because Ca=Ci, the ratio of the maximal rate of oxygen supply in the perfusion medium to the maximal rate of oxygen supply through the PDMS wall is UiδαmAi∕DwαwAt, which is 8.87×10²Ui. As the maximal practical value of Ui is 1×10⁻⁵ m∕s, we can expect that oxygen must be supplied mainly through the PDMS wall. This result means that a thinner channel and PDMS wall are necessary to maintain multilayer cell culture on a chip, even if the chip is equipped with a medium perfusion feature.
SUMMARY AND CONCLUSIONS
Even in a simple monolayer cell culture system, we can estimate the temporal-spatial changes of velocity, concentration, and temperature with partial differential equations based on transport phenomena. However, it is very difficult to solve the equations because of the complex boundary conditions. Recently, microprocess has been attracting attention in order to better handle and culture animal cells, which are increasingly used in pharmaceutical and medical areas. However, it is not easy to measure physical conditions such as velocity, concentration, and temperature in a microchamber and microwell during cell handling and culture. In this study, therefore, we explored the advantages of perfusion culture over static culture for a microwell array chip by calculating the temporal-spatial changes of oxygen and glucose concentrations in microwell array on chips. Multilayered cells were cultivated in these microwell arrays by using a commercially available FEM application, which has been made more feasible due to significant advances in the calculation power of a personal computer.
The following results were obtained:
-
(1)
The concentrations of oxygen and glucose in a static culture of multilayered cells inside a microwell array chip are lower in the central region than that in the peripheral region. Therefore, aerobic respiration is impossible in the central region of the chip, where the oxygen concentration is lower than the Michaelis constant.
-
(2)
Glucose concentrations can be maintained at a constant level over time in perfusion cultures, whereas they decline with time in static cultures. The glucose concentration in a perfusion culture chip decreases with increasing distance from the inlet of the cell culture chamber. Also, the concentration profile of glucose in the cell culture chamber changes substantially with the flow rate of the medium.
-
(3)
In a perfusion culture chip, oxygen is hardly supplied via the perfusion medium, but mainly supplied through the walls of the cell culture chamber.
The above results suggest that the design of a perfusion culture chip should take the following into account:
-
(1)
the flow rate of the perfusion medium and the length of the cell culture chamber with respect to glucose supply, and
-
(2)
the thickness of the flow channel and the oxygen permeability of the walls of the channel with respect to oxygen supply.
ACKNOWLEDGMENTS
This work was supported by MEXT KAKENHI (Grant No. 22760618).
References
- Lee M. Y. and Dordick J. S., Curr. Opin. Biotechnol. 17, 619 (2006). 10.1016/j.copbio.2006.09.003 [DOI] [PubMed] [Google Scholar]
- Hüser J., High-Throughput Screening in Drug Discovery (Wiley-VCH, Hoboken, 2006), Vol. 35. [Google Scholar]
- Fukuda J. and Nakazawa K., Tissue Eng. 11, 1254 (2005). 10.1089/ten.2005.11.1254 [DOI] [PubMed] [Google Scholar]
- Fukuda J., Sakai Y., and Nakazawa K., Biomaterials 27, 1061 (2006). 10.1016/j.biomaterials.2005.07.031 [DOI] [PubMed] [Google Scholar]
- Sakai Y., Yamagami S., and Nakazawa K., Cells Tissues Organs 191, 281 (2010). 10.1159/000272316 [DOI] [PubMed] [Google Scholar]
- Kim L., Vahey M. D., Lee H. Y., and Voldman J., Lab Chip 6, 394 (2006). 10.1039/b511718f [DOI] [PubMed] [Google Scholar]
- Sugiura S., Edahiro J., Kikuchi K., Sumaru K., and Kanamori T., Biotechnol. Bioeng. 100, 1156 (2008). 10.1002/bit.21836 [DOI] [PubMed] [Google Scholar]
- Hung P. J., Lee P. J., Sabounchi P., Lin R., and Lee L. P., Biotechnol. Bioeng. 89, 1 (2005). 10.1002/bit.20289 [DOI] [PubMed] [Google Scholar]
- Khetani S. R. and Bhatia S. N., Nat. Biotechnol. 26, 120 (2008). 10.1038/nbt1361 [DOI] [PubMed] [Google Scholar]
- Fukuda J., Khademhosseini A., Yeo Y., Yang X., Yeh J., Eng G., Blumling J., Wang C. -F., Kohane D. S., and Langer R., Biomaterials 27, 5259 (2006). 10.1016/j.biomaterials.2006.05.044 [DOI] [PubMed] [Google Scholar]
- Kikuchi K., Sumaru K., Edahiro J., Ooshima Y., Sugiura S., Takagi T., and Kanamori T., Biotechnol. Bioeng. 103, 552 (2009). 10.1002/bit.22253 [DOI] [PubMed] [Google Scholar]
- El-Ali J., Sorger P. K., and Jensen K. F., Nature (London) 442, 403 (2006). 10.1038/nature05063 [DOI] [PubMed] [Google Scholar]
- Kang L. F., Chung B. G., Langer R., and Khademhosseini A., Drug Discovery Today 13, 1 (2008). 10.1016/j.drudis.2007.10.003 [DOI] [PMC free article] [PubMed] [Google Scholar]
- Sugiura S., Hattori K., and Kanamori T., Anal. Chem. 82, 8278 (2010). 10.1021/ac1017666 [DOI] [PubMed] [Google Scholar]
- Eddings M. A. and Gale B. K., J. Micromech. Microeng. 16, 2396 (2006). 10.1088/0960-1317/16/11/021 [DOI] [Google Scholar]
- Sumaru K. and Kanamori T., Biochem. Eng. J. 20, 127 (2004). 10.1016/j.bej.2003.08.011 [DOI] [Google Scholar]
- Sumaru K., Sugiura S., and Kanamori T., Biochem. Eng. J. 36, 304 (2007). 10.1016/j.bej.2007.03.012 [DOI] [Google Scholar]
- Foy B. D., Rotem A., Toner M., Tompkins R. G., and Yarmush M. L., Cell Transplant 3, 515 (1994). [DOI] [PubMed] [Google Scholar]
- Crank J., The Mathematics of Diffusion (Oxford University Press, New York, 1975). [Google Scholar]
- Provin C., Takano K., Yoshida T., Sakai Y., Fujii T., and Shirakashi R., Biomed. Microdevices 11, 485 (2009). 10.1007/s10544-008-9254-8 [DOI] [PubMed] [Google Scholar]
- Mehta G., Mehta K., Sud D., Song J. W., Bersano-Begey T., Futai N., Heo Y. S., Mycek M. A., Linderman J. J., and Takayama S., Biomed. Microdevices 9, 123 (2007). 10.1007/s10544-006-9005-7 [DOI] [PubMed] [Google Scholar]


