

Abstract
The quantification of spontaneous calcium (Ca2+) oscillations (SCOs) in astrocytes presents a challenge because of the large irregularities in the amplitudes, durations, and initiation times of the underlying events. In this article, we use a stochastic context to account for such SCO variability, which is based on previous models for cellular Ca2+ signaling. First, we found that passive Ca2+ influx from the extracellular space determine the basal concentration of this ion in the cytosol. Second, we demonstrated the feasibility of estimating both the inositol 1,4,5-trisphosphate (IP3) production levels and the average number of IP3 receptor channels in the somatic clusters from epifluorescent Ca2+ imaging through the combination of a filtering strategy and a maximum-likelihood criterion. We estimated these two biophysical parameters using data from wild-type adult mice and age-matched transgenic mice overexpressing the 695-amino-acid isoform of human Alzheimer β-amyloid precursor protein. We found that, together with an increase in the passive Ca2+ influx, a significant reduction in the sensitivity of G protein-coupled receptors might lie beneath the abnormalities in the astrocytic Ca2+ signaling, as was observed in rodent models of Alzheimer's disease. This study provides new, to our knowledge, indices for a quantitative analysis of SCOs in normal and pathological astrocytes.
Introduction
After finding intra/intercellular calcium (Ca2+) events induced in cultured astrocytic syncytium by exogenous application of glutamate (1), astrocytes were no longer thought of as passive cytoarchitectonic supports of neuronal structures (2–5). Recent observations bring to light the existence of similar Ca2+ signaling in vivo under external somatosensory stimulations (6) which could also exhibit the same complex temporal patterns (7) as those reported previously in vitro. Interestingly, astrocytic Ca2+ signaling also occurs, both in situ (8) and in vivo (9), without the application of either exogenous agonists or external stimuli—i.e., a phenomenon called “spontaneous Ca2+ oscillations” (SCOs). Under several experimental protocols, it has been demonstrated that SCOs can emerge in this type of cell even in the absence of neuronal activity (8,10–12) but are mediated by the activation of inositol 1,4,5-trisphosphate (IP3) receptors (IP3R) (8,10). Accordingly, a minimal basal level of cytosolic IP3 in astrocytes is thought to underlie the SCOs.
In three experimental mice models of Alzheimer's disease (i.e., APP mice, which are transgenic mice overexpressing the 695-amino-acid isoform of human Alzheimer β-amyloid precursor protein, harboring the double Swedish mutation “Tg2576”; triple transgenic mice 3XTg-AD; and mice expressing Dutch/Iowa mutation), Takano et al. (13) found an increase in the frequency of SCOs in live intact astrocytes of the barrel cortex. These transgenic mice, even at an early stage (2–4 months), exhibited both poor vasodilation in response to sensory stimulation and instability in vascular tone. These results provided a physiological explanation for the previously observed reductions of regional cerebral blood volume in similar transgenic murine APP models (V717F, K670N/M671L) (14).
Using multiphoton fluorescence lifetime imaging microscopy in vivo, Kuchibhotla et al. (12) reported a global elevation of resting Ca2+ inside the astrocytes of Swedish APP transgenic mice expressing mutant presenilin 1 in neurons (APPswe:PS1ΔE9), which was independent of the astrocytes' proximity to individual β-amyloid plaques. For such double-transgenic mice, SCOs were more frequent and synchronized across long distances. Chow et al. (15) recently verified that exogenous application of β-amyloid on isolated astrocytes in purified cultures induced Ca2+ transient activity with a high probability for the emergence of delayed intercellular Ca2+ waves. Unfortunately, transient Ca2+ events during SCOs show very irregular patterns and unpredictability in terms of their amplitudes, durations, and initiation times. That is the reason why physiologists have oversimplified the analysis of SCOs in astrocytes through two basic indices (12,13,15): 1), type/percent of cells (e.g., inactive and active); and 2), their response frequency (i.e., number of events in a time window). These purely descriptive indices are not quite useful while evaluating the physiological mechanisms underlying astrocytic Ca2+ signaling in both normal and pathological situations.
Having quantitative indices of the Ca2+ dysregulation in astrocytes will be of great value for studying the pathogenesis of the Alzheimer's disease at both the molecular and cellular levels. In this article, we propose a strategy to quantify the astrocytic Ca2+ signaling based on a biophysical model for SCOs. Our model is based on the assumption that the following statements are valid:
-
1.
The Li-Rinzel simplification (16) of the De Young-Keizer model accounts well for the kinetics of the IP3R.
-
2.
An additive Wiener process represents adequately the stochastic character of the IP3R h-open gate probability for small numbers of interacting channels inside a cluster (17).
-
3.
A strong cluster coupling in the astrocyte somas originates from the small size of this cell type, the large dimension of its clusters, and the absence of large exogenous buffering mechanisms in our experimental protocol.
-
4.
A basal level of cytosolic IP3 production, with its intrinsic fluctuations, exists in the astrocytes via the action of a diversity of receptor-agonists.
-
5.
The subtype δ1 of membrane phospholipase C (PLC) causes a considerable Ca2+-dependent feedback in the IP3 production.
-
6.
There is a Ca2+ influx from the extracellular space due to both passive leakage channels (which are allowed to fluctuate in terms of their permeability) and a mechanism of capacitative Ca2+ entry (CCE).
-
7.
The Ca2+ extrusion by the plasma membrane and the ATPase Ca2+-pump “SERCA” in the endoplasmic reticulum (ER) are accurately represented by linear and Hill-type kinetics, respectively.
By changing the amount of Ca2+ influx through passive leakage channels in our model, we were able to reproduce the dissimilar resting Ca2+ levels reported by Kuchibhotla et al. (12) for wild-type (WT) and APPswe:PS1ΔE9 mice. By means of a filtering strategy and a maximum-likelihood criterion (i.e., the innovation method), we estimated both the basal levels of IP3 production and the number of IP3R channels clustered in each astrocyte soma using two-photon fluorescent Ca2+ images from hippocampal slices of both WT and Tg2576 mice. Finally, through simulations, we discussed the impact of these parameters on the abovementioned basic indices for Ca2+ signaling, which were compared with estimations from actual Ca2+ events in both types of mice.
Materials and Methods
Astrocytic Ca2+ imaging
We used eleven C57BL/6 mice in this study with an approximate age-match (0.5–1.5 y/o), i.e., WT (N = 6) and Tg2576 (N = 5 (18)) mice. After the anesthetized mice (diethyl ether) were sacrificed, their brains were rapidly removed and briefly submerged in ice-cold cutting solution. The solution was saturated with 95% O2 and 5% CO2. The right hemispheres were mounted on a platform and cut into transverse 300-μm-thick slices using a vibratome (VT1200S; Leica, Nussloch, Germany). The slices were first incubated for 30 min at 34°C in a mixed solution (50% cutting solution and 50% artificial cerebrospinal fluid (aCSF) solution), and latter were kept for at least 30 min at room temperature in aCSF solution gassed with 95% O2 and 5% CO2. Slices were transferred into a 24-well plate filled with 1 ml of dye solution, and incubated for 45 min at 34°C during which 95% O2 and 5% CO2 were continuously supplied. The dye solution was aCSF containing fluorescent Ca2+ indicator (Fluo 4-AM, 22.8 μM; Dojin Chemical, Kumamoto, Japan), sulforhodamine 101 (SR101, 0.824 μM, Invitrogen, Carlsbad, CA), pluronic F-127 (Invitrogen) at 0.01%, and cremophor EL (Sigma Aldrich, St. Louis, MO) at 0.005%.
After loading, slices were washed out in oxygenated aCSF solution at room temperature for at least 30 min, mounted in a recording chamber and perfused with oxygenated aCSF at 30°C to simulate similar conditions to those from the in vivo recordings. Two-photon images from astrocytes at CA1 stratum radiatum in the hippocampus (see Fig. S1 in the Supporting Material) were collected with FluoView 10-ASW software (Olympus, Shinjoku, Tokyo, Japan) and an upright microscope (BX61WI, LUMPlanFI/IR 60×/0.90 N.A. water-immersion objective; Olympus). Fluo 4-AM and SR101 dyes were excited at 810 nm with a mode-lock Ti:sapphire femtosecond laser (MaiTai; Spectra-Physics, Newport, Irvine, CA). Structural SR101 and functional Ca2+ images of astrocytes were collected using red and green filters, respectively. For each slice, 10 min of two-photon Ca2+ fluorescent images, at a sampling frequency of 2.33 Hz, were recorded at different depths and averaged at each time instant over particular regions of interest. These regions of interest entirely covered the astrocyte somas as defined from the SR101 fluorescent images. To estimate the Fluo 4-AM relative fluorescent change, the two-photon fluorescent time series for each region of interest was preprocessed (see Fig. S2). All animal procedures were reviewed and approved by the Tohoku University Animal Studies Committee.
The biophysical model
The model proposed to describe SCOs in astrocytes covers the following mechanisms (see Fig. S3):
Generation/degradation of cytosolic IP3
A constant production (μM/s) of IP3 (μM) originates from fluctuations in the action of a plethora of receptor-agonists over G-protein-coupled receptors located in the astrocytic membrane. In this way, a basal cytosolic level of IP3 is created by the activation of the PLC (type β) through the GTP-bound in the G-proteins. The local IP3 signal inside the cell degrades rapidly, with a relatively short lifetime τ ≈ 1 s, by the 5-phosphomonoesterase (i.e., IP3 phosphatase) and the 3-kinase. In this study, we have neglected the effect of IP3 molecule diffusion on the local cellular signaling. In astrocytes, IP3 could also be produced by the subtype δ1 of membrane PLC, a mechanism regulated by cytosolic Ca2+ that might contribute to the basal levels of IP3. The Ca2+-dependent regulation of the PLCδ1 enzyme activity was better fitted by the Hill's kinetic model (19), as
| (1a) |
The random activation of membrane G-proteins-coupled receptors through extracellular receptor-agonists might be a source for stochasticity in IP3 basal production, an effect modeled by the Wiener fluctuations . Therefore, the final dynamic equation for IP3 is,
| (1b) |
Sources of Ca2+ signaling
Ca2+ concentration (μM) in the cytosol [Ca2+]c changes due to a diversity of sources flowing in and out. Ca2+ ion release vRel from ER through opened IP3R channels constitutes the main source of Ca2+ flow into the cytosol. The ATPase Ca2+-pump “SERCA” represents the major mechanism vSERCA for Ca2+ uptake into the ER. Ca2+ entry into the astrocytes from the extracellular space has been suggested to play a protagonist role in the generation of spontaneous Ca2+ oscillations in astrocytes (11). Previous theoretical studies have assumed, not only a constant Ca2+ influx jin (μM/s) through passive channels, but also the existence of a CCE vCCE mediated by store-operated Ca2+ channels (19). In models that include Ca2+ influxes from the extracellular space, the extrusion of this ion across the plasma membrane vout is needed to warrant lasting steady-state behaviors:
| (2a) |
The scaling factor ɛ = Apm/AER is introduced to emphasize that the total surface area of the plasma membrane Apm is much smaller than the ER membrane area AER (16). In Eq. 2a, we have added a Wiener process to account for random dislocations of the Ca2+ ions across the plasma membrane through leakage channels. To represent the kinetics of the IP3R, we used the Li-Rinzel simplification (16) of the De Young-Keizer model:
| (2b) |
The kinetics of the IP3R are written in an analogy of Hodgkin-Huxley's model for electrically excitable neurons (Eq. 2b), where the driving force for Ca2+ fluxes is created by the concentration gradient between the ER and the cytosol. Temporal changes in the Ca2+ concentration inside the ER occur by depletion and repletion of this internal store through the activity of IP3R and the SERCA pumping, respectively. To characterize the instantaneous Ca2+ ion gradient between the ER and the cytosol, these changes need to be modeled. To that end, a state variable, the total free Ca2+ ions per astrocyte volume co (μM), is usually introduced such that [Ca2+]ER = (co − [Ca2+]c)/c1.
The open probability for three independent gates m is approached by their values at the equilibrium m∞ = [IP3][Ca2+]c/(([IP3] + d1)([Ca2+]c + d5)). Each gate h has an inactivation binding site for Ca2+ ions that could be either occupied (closed) or nonoccupied (open). IP3R channels on the ER membrane are organized in clusters and these clusters form arrays spatially distributed inside the cells. We assumed that the interactions between clusters of IP3R channels in astrocytes are strong enough to ignore the effect of dynamic Ca2+ diffusion inside such small cells (∼7–9 μm in diameter (20)). Hence, the somatic epifluorescent Ca2+ images observed in our experiments are, as a first approximation, described sufficiently well by a model for a larger Ca2+ cellular domain comprising strongly coupled clusters (17). This model is also able to reproduce transient Ca2+ events originating from single clusters (puffs) (21). For a small number Ncluster of IP3R channels inside a cluster, asymptotic theoretical formulas for the open/closed probabilities are inadequate to describe Ca2+ release from the ER, i.e., the deterministic model is insufficient. In such a case, the open probability for h-gates has to be modeled by means of Markov processes (17), i.e., the stochastic model. If the number of IP3R channels in the Ca2+ signaling microdomains is relatively large, we can alternately employ the equivalent Fokker-Plank formalism with opening αh = ad2([IP3] + d1)/([IP3] + d3) and closing βh = a[Ca2+]c rates for three independent gates h, as
| (2c) |
The variance of zero-mean Gaussian white noise was defined in Shuai and Jung (17):
Note that the stochastic model transforms into a deterministic one for an infinitely large number of channels. Because variance depends on state variables [IP3], [Ca2+]c, and h, the diffusion Wiener process in the stochastic differential equation (Eq. 2c) is multiplicative. Integration, filtering hidden state variables, and making statistical inferences (i.e., parameter estimations) of this particular type of Itô stochastic differential equation require a high computational cost. In this article, we evaluate the behaviors of the proposed biophysical model for constant values of , which were defined from its physiological bounds. Therefore, we approximate the dynamics of the state variable h by a stochastic differential equation with an additive Wiener noise.
The lower 0.8 × 10⁻³ s−1 and upper 6.0 × 10⁻³ s−1 bounds for the variance were established from assumptions of the following: IP3R opening rate 0.031 s−1 ≤ αh ≤ 0.092 s−1 (a consequence of 0.01 μM ≤ [IP3] ≤ 0.5 μM); IP3R closing rate 0.016 s−1 ≤ βh ≤ 12 s−1 (a consequence of 0.080 μM ≤ [Ca2+]c ≤ 0.6 μM); N ≈ 20 (although there is still some discrepancy, it has been postulated that a single cluster comprises ∼10–30 IP3R channels); and 0 ≤ h ≤ 1.
The SERCA pumping in astrocytes has been consistently modeled through a Hill-type kinetic model:
| (2d) |
In this article, we used a phenomenological model proposed by Di Garbo et al. (22) to describe the CCE effect in astrocytes, i.e.,
| (2e) |
A simple linear kinetic model has been consistently used in the past to represent the Ca2+ extrusion across the plasma membrane:
| (2f) |
Obviously, changes in the total free Ca2+ concentration co are only caused by Ca2+ fluxes and extrusion across the plasma membrane; hence, this state variable must satisfy
| (3) |
The effect of random dislocations of the Ca2+ ion across the plasma membrane were considered too small to cause any perturbation in the state variable co, which varies in the range of 1 ≤ co (μM) ≤ 3 because of the high Ca2+ concentration in the ER.
The values of the parameters for the proposed biophysical model and the ranges for the variances in the Wiener processes are reported in Table S1 and Table S2 in the Supporting Material. In Ca2+ imaging with the Fluo 4-AM dye, the baseline fluorescence Fo cannot be used to determine the basal Ca2+ concentration Cbasal in the cytosol. Therefore, the Fluo 4-AM relative fluorescent change was defined in this article for a given Cbasal, i.e., observation equation,
| (4) |
The factor γ ≈ 1 μM−1 was estimated by Shigetomi et al. (11) (see Fig. 2 b in (11)) for the Fluo 4-AM dye. We assumed an instrumental fluorescent noise with a Gaussian distribution, i.e., ξ ∼ N(0,). In this study, the stochastic differential equations, Eqs. 1–3, were numerically solved using the local linearization method (23), with integration step Δt = 0.1 s. The statistical inference about the model parameters was performed by combining the local linearization filter and the innovation method (24), an approach that was previously validated for the particular case of astrocytic Ca2+ signaling (19).
Figure 2.
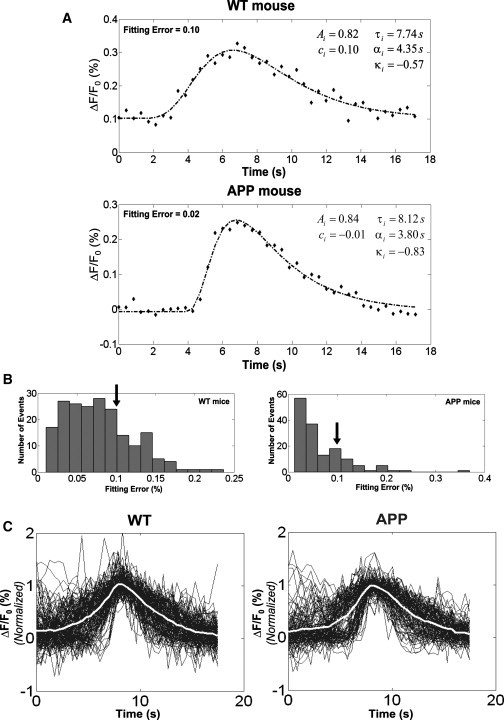
Procedure to characterize single Ca2+ events. (A) Examples of fitting a generalized-Gaussian function to a particular Ca2+ event in both WT (top) and Tg2576 (APP) (bottom) mice. The respective values for location τi, shape κi, scale αi, amplitude Ai, and baseline ci are also shown. (B) A least-square criterion was used to fit the generalized-Gaussian function to the actual ΔF/F0 waveforms. Ca2+ events with fitting errors >0.1 (solid arrows) were considered doubtful, and therefore, excluded from the analysis. (C) The normalized Ca2+ events (solid, single trials; open, mean). The total numbers of well-fitted events for WT and Tg2576 (APP) mice, which additionally were required to have amplitudes >15%, were n = 147 and n = 121, respectively.
Results
Basic indices: cell type/percent and response frequency
Typical time courses of the Fluo 4-AM relative fluorescent changes in astrocytes of WT (left) and Tg2576 (right) mice are shown in Fig. 1. We quantified the SCOs in astrocytes using the basic indices proposed in the past (12,13,15). According to the SCO characteristics, SR101-labeled astrocytes were further classified into: inactive (a stable Ca2+ baseline); active (irregular Ca2+ events); and hyperactive (highly fluctuating Ca2+ baseline). To be consistent with a previous study (12), our classification of the astrocyte-type was based on: 1), 5 min of two-photon Ca2+ fluorescent images and 2), transient events with relative fluorescence change >15%.
Figure 1.

Examples of the relative fluorescent changes ΔF/F0 obtained from astrocytes of both WT and Tg2576 (APP) mice. In both types of mice, we are able to distinguish three kinds of Ca2+ signaling states: inactive, a stable Ca2+ baseline; active, irregular Ca2+ events; and hyperactive, a highly fluctuating Ca2+ baseline.
In hyperactive astrocytes, trains of Ca2+ events (i.e., bursts) were frequently observed. To automatically identify the time instants of possible Ca2+ events, we developed an algorithm that combines a thresholding method and a maximum time-derivative strategy. By means of a least-square criterion, we fitted a generalized-Gaussian function (Eq. 5), with location τi, shape κi, scale αi, amplitude Ai, and baseline ci, to the ΔF/F0 data corresponding to each identified Ca2+ event. Fig. 2 A exemplifies the fitting results for a particular cell of a WT (deficient fitting 0.10) and an APP (excellent fitting 0.02) mouse. Ca2+ events with large fitting errors (≥0.1, solid arrows in Fig. 2 B) were disregarded. The final normalized waveforms of Ca2+ events for WT (147 events) and APP (121 events) mice are shown in Fig. 2 C:
| (5) |
Note that epifluorescence unique Ca2+ events (ΔF/F0 ≃ 5 ± 4% (11)), which may represent isolated somatic puffs, were ignored in this study. Therefore, the Ca2+ spikes detected by our algorithm must reflect synchronized activity in all somatic microdomains. In agreement with a previous study for in vivo cortical astrocytes (12), the percent of active astrocytes was higher, although nonsignificant, in the hippocampal acute slices obtained from APP mice (Table 1). The discrepancy may be attributable to the differences in the production of β-amyloid peptides between these two mutant mice: Tg2576 (11–13-months-old) Aβ(1–42/43) → 175 ± 26 pmol/g (18) and APPswe:PS1ΔE9 (12-months-old) insoluble Aβ42 → 1009.53 ± 115.56 pmol/g (25).
Table 1.
The percentages of different cell types in WT and APP mice
| Type of cell | WT mice (%) | APP mice (%) |
|---|---|---|
| Inactive | 38.33 ± 29.10 | 35.91 ± 15.52 |
| Active | 20.98 ± 18.77 | 42.13 ± 16.78 |
| Hyperactive | 40.69 ± 38.61 | 21.95 ± 5.48 |
| Total active (active + hyperactive) | 61.66 ± 29.10 | 64.08 ± 15.51 |
Cell types are for both WT (six mice, total number of cells = 67) and Tg2576 mice (four mice, total number of cells = 85), with the corresponding standard deviations. (Note that, as a consequence of the small amount of recorded cells (n = 2), one mouse was not included in this analysis.) Classification: inactive, astrocytes with stable Ca2+ baseline; active, astrocytes showing irregular Ca2+ events; and hyperactive, astrocytes with a highly fluctuating Ca2+ baseline.
When comparing results in the study by Kuchibhotla et al. (12) with those in Table 1, readers must bear in mind the dependency of astrocytic Ca2+ signaling on temperature (26). Albeit having a high intermouse variability, hyperactive astrocytes were more common in WT mice, a fact that was not significant. We found a significant reduction (two-sample t-test with unequal variances, p = 0.001) in the response frequency of the astrocytes which were not inactive in APP mice (0.90 ± 0.62 events/min, n = 87) with respect to that of WT mice (1.65 ± 1.01 events/min, n = 67). This result is inconsistent with the increase in the response frequency reported earlier by Takano et al. (13) for young (2–4 months/old) APP (Tg2576) mice in vivo, i.e., WT (0.4 ± 0.1 events/min) and APP (2.3 ± 0.6 events/min). Differences in the technique employed (i.e., acute slices versus in vivo), the brain tissue (i.e., hippocampus vs. neocortex), and the detection method of Ca2+ events (i.e., automatic versus manual) might underlie such discrepancy.
Basal Ca2+ levels in the cytosol: a key physiological parameter
By means of the proposed biophysical model, we examined whether the basal Ca2+ levels in the cytosol were determined by the activity of receptor-agonists or by the amount of passive Ca2+ influx jin. By solving a nonlinear equation system (fsolve.m function, MATLAB R2006b; The MathWorks, Natick, MA), we were able to determine Cbasal numerically for each pair of physiological parameters (Fig. 3 A). Surprisingly, large increases in caused small changes in Cbasal, with a slight tendency for the interval 0.02 μM/s ≤ ≤ 0.5 μM/s to rise. However, Cbasal was more sensitive to changes in jin, with an approximately linear dependency. We found that, to replicate the corresponding values of Cbasal reported for WT (0.081 μM) and APPswe:PS1ΔE9 (0.149 μM) mice (12), the Ca2+ influx must be roughly jin = 0.036 μM/s and jin = 0.070 μM/s, respectively. The baseline for the total free Ca2+ ions per astrocyte volume co,b also depended on both and jin, with rapid increases for high values of jin ≥ 0.04 μM/s (Fig. 3 B). Increasing the level of IP3 brought about a decrease of co,b, probably caused by depletion of the intracellular stores and the associated enhancement of Ca2+ extrusion across the plasma membrane. There were no perceivable changes in either Cbasal or co,b for values of ≥ 0.3 μM/s.
Figure 3.

Dependency of the basal Ca2+ concentration in the cytosol Cbasal (A) and the baseline for the total free Ca2+ ions per astrocyte volume co,b (B) with the physiological parameters and jin. (Dashed lines) Corresponding mean levels of these parameters for the experimentally observed Cbasal in WT (0.081 μM) and APP(PS1) (0.149 μM) mice.
The initial conditions (note that the initial conditions represent the steady-state solutions of the differential equation system) for the state variables were recalculated in each analysis performed in our study as a function of and jin. Based on the fact that the nonlinear function in the stochastic differential equations (Eqs. 1–3) represents a contraction mapping, there is no possibility for SCOs (i.e., at low IP3 levels) without the presence of external diffusive forces, i.e., the Wiener processes. Unfortunately, as a result of the uncertainty in determining Cbasal, we found ourselves unable to estimate jin from the Fluo 4-AM relative fluorescent changes. Instead, we used the following heuristic strategy to determine Cbasal for our particular mice: 1), we assume a linear dependency of Cbasal in astrocytes and the β-amyloid concentrations in the tissue, i.e., Cbasal = m[Aβ42] + l; 2), we estimated the slope m = 0.067 nM (pmol/g)−1 and intercept l = 80.9 nM from measured data of Cbasal (12) and β-amyloid concentrations in the tissue (18,25) for both WT and APPswe:PS1ΔE9 mice (∼12 months/old); 3), we calculated the Cbasal = 92.6 nM value for the Tg2576 mice (11–13 months/old) from their particular β-amyloid concentrations (18); and then, 4), we estimated approximately jin = 0.043 μM/s for the Tg2576 mice from Fig. 3 A.
Statistical inference: IP3 production levels and number of clustered IP3R channels
From the whole time series of relative fluorescent changes ΔF/F0 in each cell, we estimated the respective hidden state variables {[IP3], h, co} and the model parameters for given values of Cbasal. Based on the Bayesian model selection strategy (i.e., the evidence), we verified that the model resulting from fitting these two parameters was more likely than those fitting other combinations of parameters. Also, we confirmed that: 1), changes in the variances and do not have a significant impact on the astrocytic Ca2+ signaling and 2), the temporal characteristics of the astrocytic Ca2+ events is appreciably dependent on the number of IP3R channels per cluster.
Therefore, variances were both set low (1 × 10⁻⁴ μM/s) and variance was estimated from actual data for each particular cell. For each time series, we estimated the variance of the instrumental noise (0.1 × 10⁻⁵ ≤ σ2F ≤ 2.5 × 10⁻⁵) as a genuine Gaussian process superimposed on the eventlike Ca2+ signaling. To avoid any ambiguity in our conclusions caused by a lack of information about the basal Ca2+ concentration in the cytosol for Tg2576, we performed a statistical analysis for four different values of jin. The minimal and maximal values of jin were set from the observed Cbasal in WT and APPswe:PS1ΔE9 mice (12), respectively. We introduced two extra values of Ca2+ influx, i.e., the value jin = 0.043 μM/s, to represent our estimated Cbasal for the Tg2576 mice, and the in-between value of jin = 0.053 μM/s.
Fig. 4 shows results from the statistical inference for a particular cell of a WT (left) and an APP (right) mouse, using the most likely value of Cbasal for each. The relative fluorescent changes ΔF/F0 (solid) and the resulting innovations η (shaded) after model fitting are shown for each cell (top). The estimated hidden state variables are displayed on independent panels below. The distribution of the innovations η was confirmed to be approximately Gaussian, an assessment based on the Kolmogorov-Smirnov test. The estimated parameters for both particular cells were {0.32 μM/s, 0/018 s−1/2} for the WT mouse and {0.31 μM/s, 0.021 s−1/2} for the APP mouse. The mean values 〈h〉 and 〈[IP3]〉 in the observation time window, together with Cbasal and the estimated variance , were used to calculate the approximate number of IP3R channels clustered in the astrocyte soma for each mice-type using
| (6) |
with and .
Figure 4.
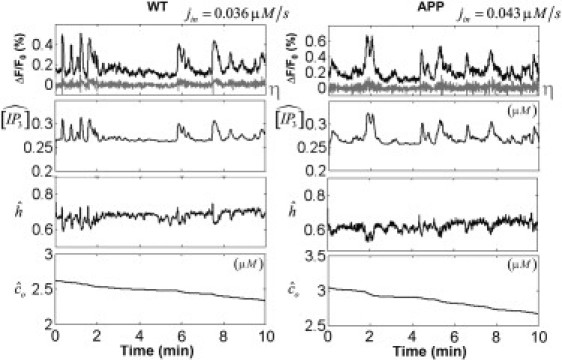
Statistical inference for a particular cell of a WT (left) and an APP (right) mouse. We used the most likely value of Cbasal for each mouse type, i.e., jin = 0.036 μM/s (WT mice) and jin = 0.043 μM/s (Tg2576 mice). (Upper panel) Relative fluorescent changes ΔF/F0 (solid) and the resulting innovations η (shaded) after model fitting for each cell. The estimated hidden state variables are shown in three separated panels below.
The same procedure was applied to ΔF/F0 data from all recorded-cells of both WT (n = 67) and APP (n = 84) mice (the algorithm had convergence problem in three cells of APP mice, which were not considered in the statistical analysis). The results are summarized in Fig. 5. The IP3 production levels were significantly smaller (two-sample t-test with unequal variances) in the Tg2576 mice, which was consistent no matter which value of passive Ca2+ influx we used in the estimation procedure (top left). For Tg2576 mice, the variance decreases as a function of the value in use for the parameter jin. We found no significant difference for this variance between WT and Tg2576 mice when the estimated jin for this particular mutation was used. The number of IP3R channels in a single cluster of the astrocytes from WT mice was = 131 ± 29 (note that mean ± 1.96 × SE). For the Tg2576 mutant mice, we conjecture a nonsignificant decrease in the total number of channels per cluster (= 105 ± 14; note that mean ± 1.96 × SE). These numbers are much larger than those associated with actual channels recruitment during puff events in healthy Xenopus oocytes (27) and human neuroblastoma SH-SY5Y cells (28). They are also incompatible with lower/upper bounds theoretically predicted to underlie, in terms of efficiency, a single puff from wide-ranging biophysical models of Ca2+ signaling (29,30).
Figure 5.

Summary of parameter estimation and statistical tests for all cells in both WT (n = 67, solid bars) and Tg2576 (APP) (n = 84, shaded bars) mice. Though we provided an empirical estimation in this study, Cbasal is experimentally unknown for Tg2576 mice. Therefore, the statistical inference in the particular case of using data from our APP transgenic mice was performed for different values of Cbasal (i.e., mice with no β-amyloid accumulation, 81 nM; mice with a slight number of plaques, Tg2576, 92 nM; mice with a moderate number of plaques, 110 nM; and mice with a severe number of plaques, APP(PS1), 149 nM). The IP3 production levels were significantly higher in WT mice. While raising the value of Cbasal, the estimators of variance and the average number of IP3R channels in a single cluster reduced and increased, respectively. For the predicted Cbasal in Tg2576 mice, there were no significant differences with the corresponding estimators of these two parameters for WT mice. A bar represents the mean value of the estimated parameter and the 1.96 × SE.
Actual and predicted Ca2+ event statistics
From the synthetic ΔF/F0 data, created by integrating our biophysical model with the estimated and values for both WT and Tg2576 mice, we calculated the basic indices commonly used to quantify the SCOs. In these simulations, the variances of the Wiener fluctuations for IP3 and Ca2+ signaling were also small (i.e., = 1 × 10⁻⁴ μM/s, = 1 × 10⁻⁴ μM/s) and the same for all trials. We used the respective values of jin for each mouse type. For practical reasons, we did not add instrumental fluorescent noise. Consistent with our statistical analysis of Ca2+ events from actual data, synthetic Ca2+ events with amplitudes <15% were not considered. We reproduced the tendency of APP transgenic mice to have more computer-generated active cells (67%) than WT mice (41%). However, the response frequencies for astrocytes in these two virtual mice were lower, i.e., WT (0.26 ± 0.08 events/min) and Tg2576 (0.29 ± 0.10 events/min) mice, than those observed experimentally. For both mouse types, we were unable to generate hyperactive cells from the estimated model parameters, which might be one of the reasons for the mismatch in their actual/predicted response frequencies through a population analysis. If the hyperactive cells are not included, the response frequencies for astrocytes in WT and Tg2576 mice were 0.96 ± 0.41 events/min and 0.61 ± 0.30 events/min, respectively. The estimated models for WT and Tg2576 mice were able to reproduce the respective distributions of Ca2+ event amplitudes reconstructed from the actual data, which were bimodal in the particular case of the Tg2576 mice (see Fig. S4).
Discussion
Based on a biophysical model, we proposed what we believed to be novel indices to quantify the SCO in astrocytes. We performed a statistical inference from actual experimental data to determine the particulars of our model for WT and Tg2576 mice. We concluded that abnormalities in astrocytic Ca2+ signaling observed in APP transgenic mice might result from a strengthening of the passive Ca2+ influx from the extracellular space and a significant reduction of the IP3 production levels. We found a large number of channels inside astrocytic IP3R clusters. Our conclusions rely on parameter estimates that are model-specific (e.g., just three subunits for IP3R channels in the Li-Rinzel model, strong cluster interactions in the soma), and even depend on those parameter values which have been kept fixed through the study. The strategy proposed in this study can also be used to quantify Ca2+ signaling in other cell types.
Possible mechanisms for Ca2+ influx in astrocytes
By simulations, we have found that a change in the passive Ca2+ influx is needed to explain the significant differences (∼70 nM) in the basal Ca2+ levels between WT and APPswe:PS1ΔE9 mice found by Kuchibhotla et al. (12). We verified also (data not shown) that it is possible to switch an astrocyte from an inactive to a more active physiological state by just increasing the Ca2+ influx from the extracellular space. This suggests that astrocytes in APP transgenic mice, which showed a larger probability for having SCOs, possess plasma membranes with more permeability to Ca2+ ions—a situation that might cause an abnormal increase in the resting cytosolic levels for this ion and hence possible dysfunctions of important intracellular signaling mechanisms. Increases in the Ca2+ influx might not only result from changes in the permeability of leakage channels, but also from alterations in the active channels (e.g., store-operated and ligand-gated channels). A specific Ca2+-independent phospholipase 2 has been suggested to cause Ca2+ influx through store-operated Ca2+ entry channels during depletion of internal stores (31), a pathway that could be enhanced in the presence of oligomeric β-amyloid peptides (32).
An alternative pathway involves nitric oxide as a possible modulator for refilling internal stores (33). Also, the role played by several types of voltage-gated Ca2+ channels in astrocytic Ca2+ signaling was recently evaluated theoretically by Zeng et al. (34). However, blocking the L-type of Ca2+ channels has, in practice, produced no effect on SCOs in astrocytes (35). Rojas et al. (36) proposed that an influx of Na+ through high-affinity trans-membrane glutamate transporters GLAST and GLT-1 can activate the reverse Na+/Ca2+ exchange in cortical astrocytes, a mechanism that may be abnormal in Alzheimer's disease (37). In agreement with that, Wang et al. (35) have reported an enhancement of SCO when astrocytes are exposed to both a low Na+ and a high Ca2+ solution. Paradoxically, ethylenediamine tetraacetic acid (a “sequesterer” of Ca2+ ions) bathing did not affect SCO (35), whereas this type of activity was suppressed in the prolonged absence of external Ca2+ (8). More studies are required at some point to clarify which particular mechanisms underlie the amplification of the Ca2+ influx in APP transgenic mice and how the β-amyloid plaques up/downregulate them.
Characterizing astrocytic Ca2+ microdomains
Many neurotransmitters have been confirmed to generate IP3 signal through the activation of G-proteins-coupled receptors. Based on our results, we foresee a significant reduction in the sensitivity of these receptors in hippocampal astrocytes that might occur along with the β-amyloid accumulation. This conjecture is somehow in disagreement with a previous study suggesting an upregulation of the metabotropic glutamate receptor 5 by the β-amyloid (1–40) peptides (38). In weakly stimulated astrocytes or under conditions of very low IP3 levels, SCOs might originate mostly from an increase in IP3R responsiveness as a result of the existence of clusters of IP3R channels along the ER membrane. Models assuming strong interactions between the channels inside a single cluster have been used to represent local pufflike events (17,39,40).
As demonstrated in these previous theoretical works, a small number of IP3R channels clustered within a tiny cytosolic region brings about stochasticity in the mechanisms for Ca2+ ion release from the ER. The full width at half-maximum (FWHM) and the full duration half-maximum (T0.5) of a puff event are magnitudes that may be robustly affected by the channels' organization inside a single cluster. For example, the numbers of recruited channels inside a cluster during a puff event have been estimated as ∼8 and ∼6 for healthy Xenopus oocytes (27) and human neuroblastoma SH-SY5Y cells (28), respectively. These numbers are compatible with the similarities found in the FWHM and the T0.5 for puff events in these two different cells (41), i.e., Xenopus oocytes (FWHM = 3.4 μm and T0.5 ≈ 260 ms) and human neuroblastoma SH-SY5Y cells (FWHM = 3.5 μm T0.5 ≈ 300 ms). However, puff events in astrocytes have both larger sizes (FWHM = 5.1 ± 0.1 μm) and considerably slower temporal dynamics (T0.5 = 3900 ± 300 ms) (11). Therefore, the number of IP3R channels recruited during a puff event must be different for this particular cell type.
Based on our data, we predict a relative large number of IP3R channels () inside a single cluster of healthy hippocampal astrocytes. For the Tg2576 mutant mice, we observed a nonsignificant decrease in the number of channels inside a cluster (). Assuming a maximal interchannel distance dc inside a cluster of 100 nm, we anticipate an upper bound for the effective cluster volume in healthy hippocampal astrocytes of ∼0.069 μm3, whereas for cells comprising few tens of channels this bound will be nearly 0.018 μm3. We found it interesting that the cluster volume's rate (3.8) predicted from these theoretical bounds is consistent with that rate (3.2) determined from the actual FWHM values of Ca2+ puffs in these cells.
Possible role of Ca2+ diffusion
The existence of steep concentration gradients for Ca2+ ions inside many cells causes weak connections between adjacent clusters which justifies the need to include diffusion mechanisms in the biophysical models of their Ca2+ signaling. Models founded on the reaction-diffusion theory have been suggested to represent the transition between stochastic localized pufflike (T0.5 ∼100 ms) and deterministically appearing global-spike-like (T0.5 of approximately few seconds) events in several cell types (42). This emerging family of models also aims to provide an explanation, through the random wave nucleation hypothesis, for the linear relationship between the average and the standard deviation of the interspike-intervals observed in a number of cells (43), which constitutes a type of frequency encoding robust against cell variability (44). Similar linear relationships have been reproduced using models for single clusters with different channel numbers (45), diminishing the prerequisite of multiscale channel interactions as defined in reaction-diffusion systems. However, we hypothesized that coupling among somatic clusters in astrocytes is very strong. Our hypothesis is based on the fact that: 1), under physiological conditions (i.e., negligible buffering systems), the diffusion of Ca2+ ions occurs rapidly within the very small soma; and 2), having merely a few microdomains in the soma, which are indeed in very close proximity due to their large FWHM, would facilitate Ca2+ signal synchronization.
As suggested from the results by Shigetomi et al. (11), those Ca2+ transients in astrocytes detectable by epifluorescence microscopy (i.e., with amplitudes ΔF/F > 15%) might reflect whole-soma synchronized events. Therefore, in this study we used the theoretical framework proposed by Shuai and Jung (17) to describe Ca2+ release from strongly coupled clusters of IP3R channels. Similar approaches have been used in the past to successfully explain observable Ca2+ spikes in astrocytes without the need of including diffusion phenomena (46,47). Ca2+ diffusion phenomena may underlie the existence of burstlike activity as seen in hyperactive astrocytes (48) and hence give an explanation for the mismatch found in the actual/predicted response frequencies for both WT and Tg2576 mice. However, these models must definitely be based on particular characteristics for astrocytes. For example, the conclusions by Skupin et al. (48) rely on the validity of their assumptions about the number of channels per cluster (i.e., 4–16 channels) and the number of clusters per astrocyte (i.e., 47 clusters).
Acknowledgments
The authors thank Takeshi Ogawa for actively participating in the discussions. We received very encouraging and useful comments from Prof. Jianwei Shuai (Xiamen University) during the revision process.
This study was supported by a Canada-Japan grant (No. 187391) from the Japan Society for the Promotion of Science (JSPS). R.H. was supported by a “Grant-in-Aid for JSPS Fellows” from the Japan Society for the Promotion of Science.
Supporting Material
References
- 1.Cornell-Bell A.H., Finkbeiner S.M., Smith S.J. Glutamate induces calcium waves in cultured astrocytes: long-range glial signaling. Science. 1990;247:470–473. doi: 10.1126/science.1967852. [DOI] [PubMed] [Google Scholar]
- 2.Agulhon C., Petravicz J., McCarthy K.D. What is the role of astrocyte calcium in neurophysiology? Neuron. 2008;59:932–946. doi: 10.1016/j.neuron.2008.09.004. [DOI] [PMC free article] [PubMed] [Google Scholar]
- 3.Pellerin L., Magistretti P.J. Neuroenergetics: calling upon astrocytes to satisfy hungry neurons. Neuroscientist. 2004;10:53–62. doi: 10.1177/1073858403260159. [DOI] [PubMed] [Google Scholar]
- 4.Fellin T., Pascual O., Haydon P.G. Astrocytes coordinate synaptic networks: balanced excitation and inhibition. Physiology (Bethesda) 2006;21:208–215. doi: 10.1152/physiol.00161.2005. [DOI] [PubMed] [Google Scholar]
- 5.Riera J.J., Sumiyoshi A. Brain oscillations: ideal scenery to understand the neurovascular coupling. Curr. Opin. Neurol. 2010;23:374–381. doi: 10.1097/WCO.0b013e32833b769f. [DOI] [PubMed] [Google Scholar]
- 6.Wang X., Lou N., Nedergaard M. Astrocytic Ca2+ signaling evoked by sensory stimulation in vivo. Nat. Neurosci. 2006;9:816–823. doi: 10.1038/nn1703. [DOI] [PubMed] [Google Scholar]
- 7.Riera J., Ogawa T., Kawashima R. Concurrent observations of astrocytic Ca2+ activity and multisite extracellular potentials from an intact cerebral cortex. J. Biophot. 2010;3:147–160. doi: 10.1002/jbio.200910036. [DOI] [PubMed] [Google Scholar]
- 8.Zur Nieden R., Deitmer J.W. The role of metabotropic glutamate receptors for the generation of calcium oscillations in rat hippocampal astrocytes in situ. Cereb. Cortex. 2006;16:676–687. doi: 10.1093/cercor/bhj013. [DOI] [PubMed] [Google Scholar]
- 9.Hirase H., Qian L., Buzsáki G. Calcium dynamics of cortical astrocytic networks in vivo. PLoS Biol. 2004;2:0494–0499. doi: 10.1371/journal.pbio.0020096. [DOI] [PMC free article] [PubMed] [Google Scholar]
- 10.Nett W.J., Oloff S.H., McCarthy K.D. Hippocampal astrocytes in situ exhibit calcium oscillations that occur independent of neuronal activity. J. Neurophysiol. 2002;87:528–537. doi: 10.1152/jn.00268.2001. [DOI] [PubMed] [Google Scholar]
- 11.Shigetomi E., Kracun S., Khakh B.S. A genetically targeted optical sensor to monitor calcium signals in astrocyte processes. Nat. Neurosci. 2010;13:759–766. doi: 10.1038/nn.2557. [DOI] [PMC free article] [PubMed] [Google Scholar]
- 12.Kuchibhotla K.V., Lattarulo C.R., Bacskai B.J. Synchronous hyperactivity and intercellular calcium waves in astrocytes in Alzheimer mice. Science. 2009;323:1211–1215. doi: 10.1126/science.1169096. [DOI] [PMC free article] [PubMed] [Google Scholar]
- 13.Takano T., Han X., Nedergaard M. Two-photon imaging of astrocytic Ca2+ signaling and the microvasculature in experimental mice models of Alzheimer's disease. Ann. N. Y. Acad. Sci. 2007;1097:40–50. doi: 10.1196/annals.1379.004. [DOI] [PubMed] [Google Scholar]
- 14.Wu E.X., Tang H., Yan S.D. Regional cerebral blood volume reduction in transgenic mutant APP (V717F, K670N/M671L) mice. Neurosci. Lett. 2004;365:223–227. doi: 10.1016/j.neulet.2004.05.004. [DOI] [PubMed] [Google Scholar]
- 15.Chow S.-K., Yu D., Silva G.A. Amyloid β-peptide directly induces spontaneous calcium transients, delayed intercellular calcium waves and gliosis in rat cortical astrocytes. ASN Neuro. 2010;2:e00026. doi: 10.1042/AN20090035. [DOI] [PMC free article] [PubMed] [Google Scholar]
- 16.Li Y.X., Rinzel J. Equations for InsP3 receptor-mediated [Ca2+]i oscillations derived from a detailed kinetic model: a Hodgkin-Huxley like formalism. J. Theor. Biol. 1994;166:461–473. doi: 10.1006/jtbi.1994.1041. [DOI] [PubMed] [Google Scholar]
- 17.Shuai J.-W., Jung P. Stochastic properties of Ca2+ release of inositol 1,4,5-trisphosphate receptor clusters. Biophys. J. 2002;83:87–97. doi: 10.1016/S0006-3495(02)75151-5. [DOI] [PMC free article] [PubMed] [Google Scholar]
- 18.Hsiao K., Chapman P., Cole G. Correlative memory deficits, Aβ elevation, and amyloid plaques in transgenic mice. Science. 1996;274:99–102. doi: 10.1126/science.274.5284.99. [DOI] [PubMed] [Google Scholar]
- 19.Riera J., Hatanaka R., Kawashima R. Modeling the spontaneous Ca2+ oscillations in astrocytes: inconsistencies and usefulness. J. Integr. Neurosci. 2011 doi: 10.1142/S0219635211002877. In press. [DOI] [PubMed] [Google Scholar]
- 20.Bushong E.A., Martone M.E., Ellisman M.H. Protoplasmic astrocytes in CA1 stratum radiatum occupy separate anatomical domains. J. Neurosci. 2002;22:183–192. doi: 10.1523/JNEUROSCI.22-01-00183.2002. [DOI] [PMC free article] [PubMed] [Google Scholar]
- 21.Shuai J.W., Huang Y.D., Rüdiger S. Puff-wave transition in an inhomogeneous model for calcium signals. Phys. Rev. E. 2010;81:041904. doi: 10.1103/PhysRevE.81.041904. [DOI] [PubMed] [Google Scholar]
- 22.Di Garbo A., Barbi M., Nobile M. Calcium signaling in astrocytes and modulation of neural activity. Biosystems. 2007;89:74–83. doi: 10.1016/j.biosystems.2006.05.013. [DOI] [PubMed] [Google Scholar]
- 23.Biscay R., Jiménez J.C., Valdés P. Local linearization method for numerical solution of stochastic differential equations. Ann. Inst. Stat. Math. 1996;48:631–644. [Google Scholar]
- 24.Riera J.J., Jimenez J.C., Ozaki T. Nonlinear local electrovascular coupling. II: from data to neuronal masses. Hum. Brain Mapp. 2007;28:335–354. doi: 10.1002/hbm.20278. [DOI] [PMC free article] [PubMed] [Google Scholar]
- 25.Garcia-Alloza M., Robbins E.M., Frosch M.P. Characterization of amyloid deposition in the APPswe/PS1dE9 mouse model of Alzheimer disease. Neurobiol. Dis. 2006;24:516–524. doi: 10.1016/j.nbd.2006.08.017. [DOI] [PubMed] [Google Scholar]
- 26.Schipke C.G., Heidemann A., Kettenmann H. Temperature and nitric oxide control spontaneous calcium transients in astrocytes. Cell Calcium. 2008;43:285–295. doi: 10.1016/j.ceca.2007.06.002. [DOI] [PubMed] [Google Scholar]
- 27.Mak D.O., Foskett J.K. Single-channel kinetics, inactivation, and spatial distribution of inositol trisphosphate (IP3) receptors in Xenopus oocyte nucleus. J. Gen. Physiol. 1997;109:571–587. doi: 10.1085/jgp.109.5.571. [DOI] [PMC free article] [PubMed] [Google Scholar]
- 28.Smith I.F., Parker I. Imaging the quantal substructure of single IP3R channel activity during Ca2+ puffs in intact mammalian cells. Proc. Natl. Acad. Sci. USA. 2009;106:6404–6409. doi: 10.1073/pnas.0810799106. [DOI] [PMC free article] [PubMed] [Google Scholar]
- 29.Shuai J.W., Jung P. Optimal ion channel clustering for intracellular calcium signaling. Proc. Natl. Acad. Sci. USA. 2003;100:506–510. doi: 10.1073/pnas.0236032100. [DOI] [PMC free article] [PubMed] [Google Scholar]
- 30.Swillens S., Dupont G., Champeil P. From calcium blips to calcium puffs: theoretical analysis of the requirements for interchannel communication. Proc. Natl. Acad. Sci. USA. 1999;96:13750–13755. doi: 10.1073/pnas.96.24.13750. [DOI] [PMC free article] [PubMed] [Google Scholar]
- 31.Singaravelu K., Lohr C., Deitmer J.W. Regulation of store-operated calcium entry by calcium-independent phospholipase A2 in rat cerebellar astrocytes. J. Neurosci. 2006;26:9579–9592. doi: 10.1523/JNEUROSCI.2604-06.2006. [DOI] [PMC free article] [PubMed] [Google Scholar]
- 32.Zhu D., Lai Y., Lee J.C. Phospholipases A2 mediate amyloid-β peptide-induced mitochondrial dysfunction. J. Neurosci. 2006;26:11111–11119. doi: 10.1523/JNEUROSCI.3505-06.2006. [DOI] [PMC free article] [PubMed] [Google Scholar]
- 33.Li N., Sul J.Y., Haydon P.G. A calcium-induced calcium influx factor, nitric oxide, modulates the refilling of calcium stores in astrocytes. J. Neurosci. 2003;23:10302–10310. doi: 10.1523/JNEUROSCI.23-32-10302.2003. [DOI] [PMC free article] [PubMed] [Google Scholar]
- 34.Zeng S., Li B., Chen S. Simulation of spontaneous Ca2+ oscillations in astrocytes mediated by voltage-gated calcium channels. Biophys. J. 2009;97:2429–2437. doi: 10.1016/j.bpj.2009.08.030. [DOI] [PMC free article] [PubMed] [Google Scholar]
- 35.Wang T.F., Zhou C., Chai Z. Cellular mechanism for spontaneous calcium oscillations in astrocytes. Acta Pharmacol. Sin. 2006;27:861–868. doi: 10.1111/j.1745-7254.2006.00397.x. [DOI] [PubMed] [Google Scholar]
- 36.Rojas H., Colina C., DiPolo R. Na+ entry via glutamate transporter activates the reverse Na+/Ca2+ exchange and triggers Cai2+-induced Ca2+ release in rat cerebellar Type-1 astrocytes. J. Neurochem. 2007;100:1188–1202. doi: 10.1111/j.1471-4159.2006.04303.x. [DOI] [PubMed] [Google Scholar]
- 37.Ikegaya Y., Matsuura S., Matsuki N. β-amyloid enhances glial glutamate uptake activity and attenuates synaptic efficacy. J. Biol. Chem. 2002;277:32180–32186. doi: 10.1074/jbc.M203764200. [DOI] [PubMed] [Google Scholar]
- 38.Casley C.S., Lakics V., Kingston A.E. Up-regulation of astrocyte metabotropic glutamate receptor 5 by amyloid-β peptide. Brain Res. 2009;1260:65–75. doi: 10.1016/j.brainres.2008.12.082. [DOI] [PubMed] [Google Scholar]
- 39.Diambra L., Guisoni N. Modeling stochastic Ca2+ release from a cluster of IP3-sensitive receptors. Cell Calcium. 2005;37:321–332. doi: 10.1016/j.ceca.2004.12.001. [DOI] [PubMed] [Google Scholar]
- 40.Ullah G., Jung P. Modeling the statistics of elementary calcium release events. Biophys. J. 2006;90:3485–3495. doi: 10.1529/biophysj.105.073460. [DOI] [PMC free article] [PubMed] [Google Scholar]
- 41.Smith I.F., Wiltgen S.M., Parker I. Localization of puff sites adjacent to the plasma membrane: functional and spatial characterization of Ca2+ signaling in SH-SY5Y cells utilizing membrane-permeant caged IP3. Cell Calcium. 2009;45:65–76. doi: 10.1016/j.ceca.2008.06.001. [DOI] [PMC free article] [PubMed] [Google Scholar]
- 42.Falcke M. On the role of stochastic channel behavior in intracellular Ca2+ dynamics. Biophys. J. 2003;84:42–56. doi: 10.1016/S0006-3495(03)74831-0. [DOI] [PMC free article] [PubMed] [Google Scholar]
- 43.Skupin A., Kettenmann H., Falcke M. How does intracellular Ca2+ oscillate: by chance or by the clock? Biophys. J. 2008;94:2404–2411. doi: 10.1529/biophysj.107.119495. [DOI] [PMC free article] [PubMed] [Google Scholar]
- 44.Thurley K., Falcke M. Derivation of Ca2+ signals from puff properties reveals that pathway function is robust against cell variability but sensitive for control. Proc. Natl. Acad. Sci. USA. 2011;108:427–432. doi: 10.1073/pnas.1008435108. [DOI] [PMC free article] [PubMed] [Google Scholar]
- 45.Jung P., Swaminathan D., Ullah A. Calcium spikes: chance or necessity? Chem. Phys. 2010;375:625–629. [Google Scholar]
- 46.Stamatakis M., Mantzaris N.V. Modeling of ATP-mediated signal transduction and wave propagation in astrocytic cellular networks. J. Theor. Biol. 2006;241:649–668. doi: 10.1016/j.jtbi.2006.01.002. [DOI] [PubMed] [Google Scholar]
- 47.Ullah G., Jung P., Cornell-Bell A.H. Anti-phase calcium oscillations in astrocytes via inositol (1,4,5)-trisphosphate regeneration. Cell Calcium. 2006;39:197–208. doi: 10.1016/j.ceca.2005.10.009. [DOI] [PubMed] [Google Scholar]
- 48.Skupin A., Kettenmann H., Falcke M. Calcium signals driven by single channel noise. PLoS Comput. Biol. 2010;6 doi: 10.1371/journal.pcbi.1000870. e1000870:1–13. [DOI] [PMC free article] [PubMed] [Google Scholar]
Associated Data
This section collects any data citations, data availability statements, or supplementary materials included in this article.