Abstract
A novel numerical model was developed to simulate three-dimensional nonlinear fields generated by high intensity focused ultrasound (HIFU) arrays. The model is based on the solution to the Westervelt equation; the developed algorithm makes it possible to model nonlinear pressure fields of periodic waves in the presence of shock fronts localized near the focus. The role of nonlinear effects in a focused beam of a two-dimensional array was investigated in a numerical experiment in water. The array consisting of 256 elements and intensity range on the array elements of up to 10 W/cm2 was considered. The results of simulations have shown that for characteristic intensity outputs of modern HIFU arrays, nonlinear effects play an important role and shock fronts develop in the pressure waveforms at the focus.
1. INTRODUCTION
An increasing number of current high intensity focused ultrasound (HIFU) noninvasive surgical devices rely on using two-dimensional multi-element phased arrays with the elements distributed over a segment of a spherical surface [1--4]. Each element of such an array is controlled independently, which makes it possible to electronically steer the focus in space, to create a complex field configuration in the form of several foci, and to minimize the heating of acoustic obstacles (for instance, ribs) while maintaining high intensities at the focus [3--7]. The abilities of arrays can also be utilized to improve the quality of focusing in inhomogeneous tissue using time reversal methods, as well as to trace the region of treatment, which shifts due to respiration [1--8].
Numerical experiment has been proven to serve as an important tool in characterizing pressure fields of HIFU radiators, in developing exposure protocols, and in predicting the corresponding HIFU-induced biological effects in tissue [9, 10]. Intensity levels at the focus of HIFU radiators can reach several tens of thousands of W/cm2 causing nonlinear propagation effects. Nonlinear effects can result in formation of weak shocks in the ultrasound waveform, which fundamentally changes the efficiency of ultrasound thermal action on tissue and can lead to new biological effects of a nonthermal nature [11, 12].
Nonlinear propagation effects in focused ultrasound fields with account for the formation of shocks have been studied in detail for axially symmetric beams [9, 10, 12, 13]. Three-dimensional problems have been solved for beams radiated from diagnostic ultrasound transducers, i.e., for the case of weak focusing and weak nonlinear effects [14, 15]. However, no results have been reported yet on modeling nonlinear effects in three-dimensional fields of multi-element HIFU arrays with account for the formation of shocks. Several difficulties are combined at once in this problem: the complex diffraction structure of the near field and large focusing angles requiring the use of accurate diffraction models and a fine spatial numerical grid. In addition, strong nonlinear effects require large number of harmonics to be included in the simulations or a fine temporal grid. For simulation in a three-dimensional geometry with account for generation of shock fronts, in general, significant expenditures of RAM and computer time are necessary exceeding the capabilities of modern SMP computers, i.e., computers with shared memory.
In this work, a numerical solution was obtained for the first time for the nonlinear field of a therapeutic array in the presence of high amplitude shocks. An algorithm was developed that economizes RAM and therefore makes it possible to perform such calculations on SMP computers. As an example, numerical modeling was performed for an array with a frequency of 1.2 MHz, consisting of 256 elements with a radius of 3.3 mm, distributed over a spherical cup with a radius of 66 mm and an opening for a diagnostic transducer with a radius of 9 mm, focusing distance of 120 mm, and intensity of up to 10 W/cm2 at the radiating elements [3, 16].
2. THEORETICAL METHOD
2.1. Westervelt Equation
The field of the array was simulated according to the Westervelt equation [17], which in the accompanying system of coordinates can be written in the form
| (1) |
Here, p is acoustic pressure, z is the spatial coordinate along the beam axis, τ = t − z/c0, t is time, Δp = ∂2 p / ∂z2 + ∂2 p / ∂y2 + ∂2 p / ∂x2, x and y are spatial coordinates lateral to z; ρ0, c0, β, and δ are the density, ambient sound speed, nonlinearity coefficient, and absorption coefficient of the medium, respectively. Calculations were performed for water, and the corresponding physical parameters in Eq. (1) were as follows: ρ0 = 1000 kg/m3, c0 = 1500 m/c, β = 3.5, δ = 4.33·10−6 m2/c. The origin of the coordinates corresponded to the center of a spherical segment where individual elements of the array were located so that the point x = 0, y = 0, z = F corresponded to the geometric focus of the array. Equation (1), which governs the propagation of nonlinear waves in a thermoviscous medium in the positive direction of the z axis, had been widely used earlier to simulate weakly nonlinear and weakly focused fields generated by diagnostic ultrasound transducers [18, 19].
2.2. Boundary Conditions for the Numerical Algorithm
To solve the Westervelt equation (1), written in the evolution form in terms of the z coordinate, it is necessary to assign boundary conditions on some initial plane (x, y, z = z0). Since the elements of the array are distributed on the surface of a spherical cup, the field was first calculated on the plane z0 = 2 cm from the center of the array using the Rayleigh integral. This plane is located near the edge of the array cup, which is at a distance of z = 1.85 cm from the array center:
| (2) |
where k =ω / c0 is the wavenumber, ω = 2πf is the ultrasound frequency, and is the complex amplitude of the vibration velocity of the radiator surface S.
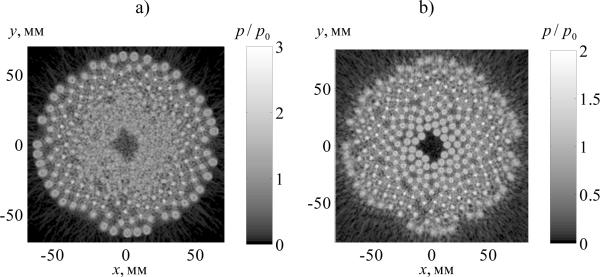
Figure 1a shows the complex diffraction structure of the pressure field created by the 256 elements on the given plane (x, y, z = z0). In order to account for nonlinear effects in the near field of the array, this boundary condition was then carried back to (x, y, z = 0) plane, tangential to the center of the spherical array surface. Back propagation was performed with the Rayleigh integral calculated using the angular spectrum method, described below. Figure 1b shows the distribution of the “virtual” sources obtained on the (x, y, z = 0) plane. Numerical solutions were obtained using both boundary conditions; the differences observed between the simulation results are discussed below.
Fig. 1.
Spatial distributions of dimensionless pressure amplitude p/p0 calculated in the plane near the edge of the radiator at z = 20 mm (a) and in plane z = 0 (b). Here p0 = ρ0c0u0, where u0 is the amplitude of vibration velocity at the surface of an element.
2.3. Numerical Algorithm
The numerical solution to the Eq. (1) was calculated sequentially, passing from the plane (x, y, z = z1) to the plane (x, y, z = z1 + Δz) with a step of Δz, following the method of splitting by physical factors [9, 10, 13, 14, 18, 19]. The Eq. (1) was divided into simpler equations for diffraction,
| (3) |
nonlinearity,
| (4) |
and absorption,
| (5) |
With known pressure distribution in the plane (x, y, z = z1), combining in a certain way the solutions to these equations consequentially one after another, a solution to the Eq. (1) was obtained in the plane (x, y, z = z1 + Δz) with a second-order accuracy, i.e., with the error in approximation at each step O(Δz3) and on the entire calculation path along the z coordinate - O(Δz2) [13, 18, 19]. In this work, the version of the splitting method was applied in which each step over the z coordinate begins and ends with the diffraction operator calculated over a half-step of the grid. If we denote the action of the diffraction operator over the step Δz as ΓD, Δz, and the combined action of the nonlinearity and absorption operators as ΓN+A, Δz, then the scheme of applying the splitting method can be represented as follows:
| (6) |
As the distance z changed and the amplitudes of high-frequency components of the wave spectrum increased, the step size Δz was varied to ensure the required accuracy of the solution.
Simulations were conducted using the advantages of both the frequency and temporal representations of the acoustic field. In the frequency domain, the solution to Eq. (1) was represented in the form of a finite Fourier series expansion [10]:
| (7) |
The diffraction operator (3) was calculated for the amplitudes of each harmonic using the angular spectrum method [18--21]. According to this method, pressure amplitude pn (x, y, z) of the n-th harmonic in plane (x,y) is expanded by fast Fourier transform into a two-dimensional spectrum over spatial frequencies (kx, ky). The angular components at the next step in the propagation distance were calculated by multiplying the spectrum by the corresponding phase factor:
| (8) |
where kn = nω / c0 is the wavenumber of the n-th harmonic.
Finite spatial window for field pn (x, y, z) and periodic boundary conditions over the coordinates x and y were used in the algorithm resulting in artificial wave reflections from the boundaries. To suppress these artificial reflections, at each step in the propagation distance, the amplitudes of spectral components were set to zero beyond a circle of radius kmax, i.e., in the region [18]. The radius of the circle for each harmonic was defined by the relation , where is the step over the spatial frequency in the case of a square region of size L, zprop is the propagation distance, which was different for each harmonic due to their gradual inclusion in the calculations. In addition, an artificial absorption quadratic with frequency was introduced in the layer adjacent to the boundaries of the spatial domain of the scheme. Absorption coefficient ν at the fundamental frequency increased according to the law ν =ν0[(x1 − x) Δx]2, where x1 is the coordinate of the beginning of the layer, Δx is the width of the layer, and ν0 is the maximum absorption at the boundary. Typical values of the parameters of the layer were as follows: ν0 = 1.6 mm−1 and Δx = 10 mm. Note also that the angular spectrum method can be easily modified to calculate the diffraction effects in a parabolic approximation by replacing the phase factor as follows:
| (9) |
The nonlinear operator (4) was calculated using two algorithms. At small distances from the radiator, the integration was performed in a frequency representation using the fourth order Runge - Kutta method. The set of nonlinear coupled equations for the harmonic amplitudes in the Fourier series expansion (7) was solved:
| (10) |
where denotes the complex conjugate harmonic amplitude. Since the number of operations in this algorithm is proportional to the squared number of harmonics Nmax, it is quite efficient when a relatively small number (several tens) of harmonics are considered. To shorten the calculation time, additional harmonics were introduced into the algorithm gradually, as the wave spectrum broadened with increasing propagation distance z. When the steepness of the wave profile exceeded a quantity that corresponds to 0.1 of the shock formation distance in a plane wave, the nonlinear algorithm was changed to a conservative time-domain Godunov-type scheme. This scheme makes it possible to simulate the evolution of waveforms containing shocks having only two to three grid points at the shock front [22, 23]. When calculating nonlinearity- and absorption terms, the step in equation (6) was split into additional substeps in order to increase the accuracy of calculations [18]. The absorption term was calculated in the frequency-domain using an exact solution for each harmonic: , where ωn = nω is the circular frequency of the nth harmonic.
The transition between the spectral and temporal representations of the solution (7) was carried out using fast Fourier transform (FFT) realized with the FFTW library. FFT calculation was performed in relatively small blocks, i.e., simultaneously for some relatively small number of waveforms (several hundred) taken at adjacent points along the x axis. This method made it possible to substantially increase the efficiency of calculations comparing to the method when single FFTs are calculated for each spatial point.
2.4. Optimization of Calculations and Parallelism of the Algorithm
Numerical simulations of three-dimensional nonlinear acoustic fields using the numerical methods presented above are computationally intensive requiring long time of calculations and large volume of RAM. These requirements increase significantly when shock fronts are developed in the pressure waveforms. In this case a high-resolution numerical grid in both the temporal and spatial coordinates should be used [10, 13]. Data arrays become excessively large and the problem cannot be solved on conventionally available SMP computers, whose RAM, as a rule, does not exceed 32 GB. With a calculation region for the field of the array in transverse coordinates of 25 × 25 cm, a size of the grid steps of dx = dy = 0.05 mm, 500 harmonics included in calculations, as well as single accuracy in the representation of real numbers, the size of data arrays for describing the pressure field is about 90 GB. Working with such arrays is not a problem for cluster systems; however, development of a parallel algorithm for a cluster is technically more difficult than for an SMP computer. In this work, we optimized the algorithm in such a way that it can be used for calculation on multithreaded machines with an overall RAM of several tens of GB.
It was possible to optimize the algorithm because nonlinear effects in strongly focused fields of HIFU systems are significant only in the proximity of the focal region. In this region, it is necessary to include a large number of harmonics in calculations. However, much smaller number of harmonics can be used beyond the focus region both along and transverse to the beam axis. A similar approach of limiting the number of harmonics outside of the beam region containing shocks was employed in simulating nonlinear effects in the near field of an axially symmetric radiator [24]. Figure 2 schematically illustrates the method of splitting a different number of harmonics in the case of three regions, indicated in the figure by different numbers. The harmonics, starting from the first through n1, are kept in calculations in region no. 1 of size L1; from n1 + 1 through n2, in region no. 2 of size L2; etc. A specific number of harmonics in each region varies for each calculation. We will name such a method of data allocation as echelon, and the regions themselves - echelons. As shown in the figure, the dimensions of each echelon Li are multiples of the dimensions of the smallest echelon L3; i.e., the entire computational region is divided into squares outlined in the figure by dotted lines. This geometry of echelons was chosen in order to effectively implement the nonlinear algorithms inside the squares with the application of stream data processing and efficient RAM organization. The size of each echelon was determined using the formula Lk = L1(2N −2k +1)/(2N −1), where k is the echelon number and N is the overall number of echelons. This data arrangement provided the differentiation for the allocation of harmonics, saving of the resources of RAM by a factor of tens as well as maintaining the calculation efficiency.
Fig. 2.
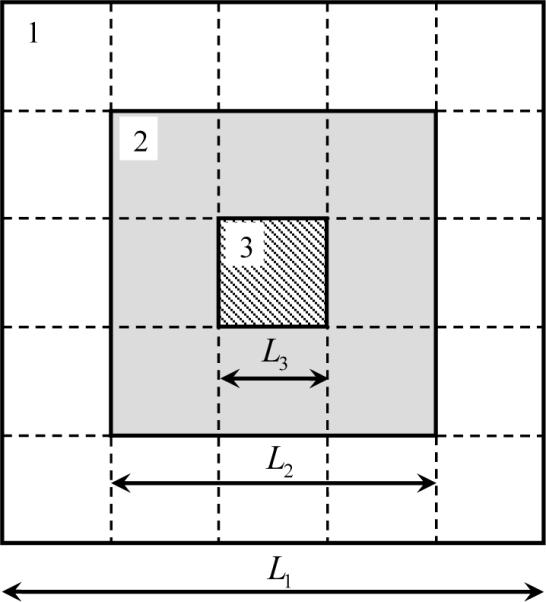
Geometry of echelon storage of the data arrays of the numerical algorithm for the case of three echelons, shown in the figure in white (no. 1), gray (no. 2), and by diagonal lines (no. 3). In the central echelon (no. 3), the maximum number of harmonics is included in calculations; in the boundary echelon, the minimum number. The dashed lines divide squares, in which at every grid step over the z coordinate, parallel calculations of the nonlinearity- and absorption operators are performed.
When shock fronts develop in the pressure waveform, strong gradients appear in the transverse spatial field structure as well. These spatial gradients can cause artificial oscillations in the numerical solutions. To eliminate oscillations, an artificial absorption was introduced in the algorithm locally around the focus where shocks were present [10]. The absorption coefficient was chosen according to the following dependence on the axial coordinate:
| (11) |
Here parameter A determines the increase in the absorption coefficient near the focus in comparison to the absorption coefficient in water. Coefficients a1 = (1+ B)/2 and a2 = 1+(1− B)(A −1) are expressed in terms of the parameter B, which determines an increase in the absorption coefficient postfocally. Geometric parameters z1 and z2 determine the size of the region of increased absorption, and parameters Δz1 and Δz2 - the width of transition regions to the values of absorption coefficients A and B. The values of parameters in the formula (11) were chosen specifically for each individual case of calculations to completely eliminate oscillations in the numerical solutions with shocks.
The parameters of the algorithm were also optimized by varying the echelon configuration and the parameters of artificial absorption, so that to achieve the minimum transverse steps dx = dy = 0.025 mm and maximum number of harmonics in the central echelon Nmax = 500. The code was written in FORTRAN 95 for parallel computations. In calculation of two-dimensional FFTs for the diffraction substep, parallel computing was performed using an internal ability of the FFTW library. The remaining substeps were parallelized using OpenMP technology. Calculations were performed within one node of the SKIF MSU supercomputer Chebyshev. The node contains 8 processor cores (2 quad-core processors) and 8, 16, or 32 GB of RAM. Overall, the performance of the parallel computations was six times faster in comparison to sequential execution of the code.
2.5. Parameters of the Numerical Algorithm
In this paper simulations were performed for nonlinear pressure field generated by a multi-element array over clinically relevant power outputs. The intensities at the radiating elements were I0 = 1, 2, 2.5, 5, and 10 W/cm2; linear focusing of ultrasound was considered as well. Simulations for the linear case and for I0 = 1 W/cm2 were performed on the spatial grid with steps of dx = dy = 0.05 mm in transverse coordinates and a number of grid points of Nx = Ny = 5000. For the remaining cases, the steps of dx = dy = 0.025 mm and a number of grid points of Nx = Ny = 10000 were employed. Thirteen echelons were chosen, and the maximum number of harmonics was distributed over the echelons in the following way: from the 1st through the 6th, Nmax = 14; from the 7th through the 9th, Nmax = 40; from the 10th to the 13th, Nmax = 100, 200, 300, and 500, respectively. The size of the array data was close to 32 GB. The distribution of harmonics over echelons provided 16 times economy in RAM. Pressure field of the array was calculated starting from the initial plane z0 = 0 mm or from the plane z0 = 20 mm to a distance of z = 1.3F = 156 mm. The step Δz along the array axis was 0.1875 mm in the segment from the initial plane to z = 0.8F; 0.125 in segment [0.8F 0.9F]; 0.0625 mm in [0.9F 1.1F]; and 0.125 in [1.1F 1.3F]. The number of step splittings for the nonlinearity and absorption operators increased from one in the first segment to six in the area around the focus [0.9F 1.1F].
The values of artificial absorption parameter A in the equation (11) were 2.5, 5, 20, and 40 for intensities of 2, 2.5, 5, and 10 W/cm2, respectively, which ensured about 7 points per shock front. The values of the geometric parameters in the equation (11) were close to 0.96F and 1.03F for z1 and z2, and 0.01F for Δz1 and Δz2. The calculation time for these parameters of the code was several hours in case of weak nonlinear effects and up to a day and a half in case of developed shocks.
3. RESULTS AND DISCUSSION
3.1. Validation of the Numerical Algorithm
The accuracy of the numerical solutions obtained with the new algorithm was examined by comparing the simulation results with known analytical solutions or numerical simulations performed using other methods. For each of the operators (3--5) governing a particular physical effect, the results were compared with known analytical solutions. A test of the complete algorithm, failing the existence of general analytical solution, was performed by comparison with known modeling results of other studies obtained in a parabolic approximation for nonlinear fields of axially symmetric radiators [25, 26].
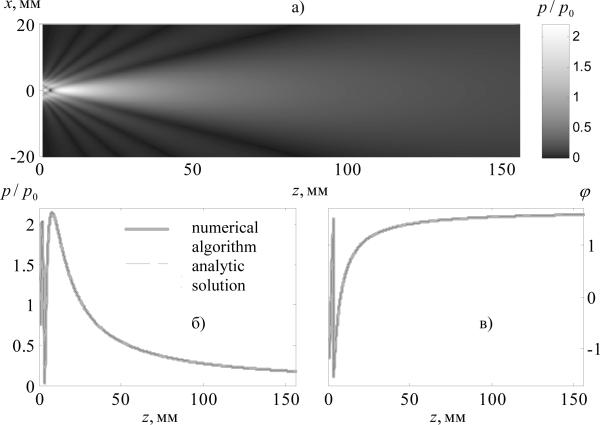
The diffraction algorithm was tested by calculating the linear field from a single focused piston element of the array (Fig. 3a) and comparing it with known analytic solutions. Figures 3b and 3c show the results of simulations (solid curves) and analytic solutions (dashed curves) for the pressure (b) amplitude and (c) phase on the axis of the element. The comparison shows very good agreement of the results, the curves nearly coincide, and the maximum deviation between them does not exceed 0.5%.
Fig. 3.
Pressure amplitude distribution p/p0 for a single array element, calculated numerically in a linear approximation in the axial plane of the element (a). Results of linear numerical calculations (solid gray curves) for the pressure amplitude (b) and phase (c) along the element axis in comparison to an analytic solution (thin dashed curves).
The algorithm (10) for calculating nonlinear term (4) was tested by comparing the simulated propagation curves for harmonic amplitudes with the analytic Bessel--Fubini solution for nonlinear propagation of a plane, initially harmonic wave up to the shock formation distance [27]. The deviation from the analytic solution was obtained at a level of 10−6. At longer distances, when shocks were present, the simulations obtained using Godunov-type time-domain scheme were compared with the analytic solution for sawtooth waves [27]. When 500 harmonics were included in simulations, the shock amplitude in the numerical solution was different from the exact solution by less that 0.3%.
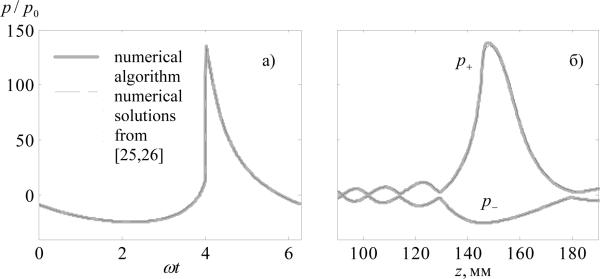
Complete testing of the algorithm was performed by comparison of numerical solutions for an axially symmetric single element focused radiator. The solutions were obtained using the new algorithm with account for diffraction in parabolic approximation (9) and analogous calculations performed using other numerical schemes based on the Khokhlov--Zabolotskaya--Kuznetsov (KZK) equation [9, 10, 25, 26]. The corresponding boundary condition in the three-dimensional algorithm was set at z = 0 in the form of a round piston with phase . For comparison, a radiator with an operational frequency of 1.7 MHz, a radius of 41.1 mm, and a focusing distance of 150 mm, was considered. The parameters of the radiator were chosen identical to those of the HIFU transducer considered in the earlier publication [25]. The linear focusing gain of the radiator in the parabolic approximation was G = ωR2 / 2c0F = 40, and the output intensity level was chosen such that the nonlinearity coefficient N = F βp0ω / c30ρ0 = 0.25 corresponded to the case considered in [26]. The initial pressure amplitude near the radiator was 0.15 MPa, and the linear estimate of intensity at the focus was 1200 W/cm2. Figure 4 shows a comparison of pressure waveforms at the focus (a) and the peak pressure distributions along the beam axis (b) obtained with the new numerical algorithm (solid curves) and in the previously cited study [26] (dashed curves). The results of modeling demonstrate very good agreement with less than 1% difference.
Fig. 4.
Comparison of the results of nonlinear modeling of the field of an axially symmetric radiator obtained in the parabolic approximation using the new algorithm (solid gray curves) and calculations performed using other algorithms (thin dashed curves): pressure waveforms at the geometric focus (a); positive p+/ p0 and negative p−/ p0 peak pressures along the beam axis (b). Nonlinear parameter N = 0.25, linear focusing gain G = 40 [25, 26].
In modeling nonlinear equation (1) with the boundary condition given on the plane z = 2 cm, nonlinear effects are not taken into account in the propagation path from the radiator to the given plane [13]. In order to account for nonlinear effects in this region, a method that was previously proposed for modeling ultrasound fields of diagnostic radiators was employed [28]. As mentioned above, the field calculated with the Rayleigh integral near the edge of the radiator (on the plane z = 2 cm) was back propagated to the plane (x, y, z = 0) using the equation (8) with −Δz instead of Δz. In the linear approximation, calculations of the field of the array with such a boundary condition evidently yield the same result as with the boundary condition given on the plane (x, y, z = z0). In further nonlinear calculations, the boundary condition was set on the plane z=0 (Fig. 2b). While propagating between the two planes, the nonlinear operator (4) was applied only in the volume bounded by the surface of the radiator cup. The conditions on choosing the volume can be written in the form , when x2 + y2 ≤ R2, and , when x2 + y2 ≥ R2. The results of calculation using such an algorithm have shown that at intensities of 1, 2, 2.5, 5, and 10 W/cm2, the peak positive pressure in the geometric focus increases by 2, 5, 7, 1, and 0.1%, respectively, in comparison to the case where nonlinear effects were not taken into account inside the spherical segment of the array. These results demonstrate that the discrepancies in solutions obtained with boundary conditions set on the two planes are mainly pronounced at moderate intensities of 2 and 2.5 W/cm2. It will be shown below that at these intensities the shock front is beginning to form at the focus. Further results presented in the paper were obtained with account for nonlinear propagation inside the surface of the array.
3.2. Linear Field of the Array
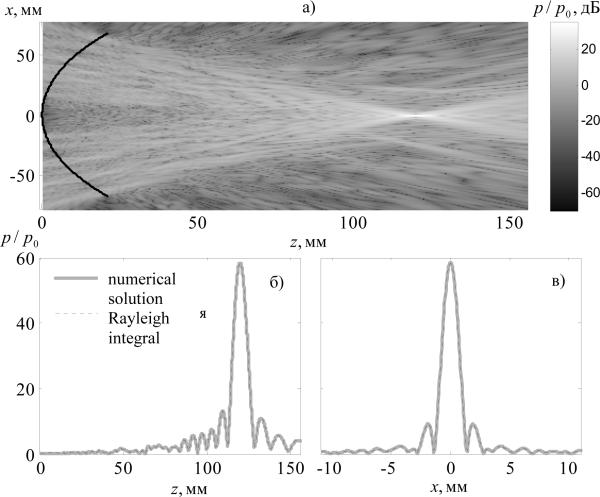
The results of modeling the array field in the linear approximation are shown in Figs. 5a--5c. Figure 5a shows the distribution of pressure amplitude in the axial plane of the array (x, z). The amplitude scale is shown in dB relative to the initial pressure amplitude p0. Complex diffraction pattern of the field in this axial cross section of the beam results from the multi-element structure of the array and randomized distribution of its elements. However, the pressure distribution in the focal region is nearly regular because the pressures from all the elements of the array are combined in phase close to the focus. Figure 5b shows the pressure amplitude along the z axis of the array in a linear scale (solid curve). The results of calculating the field directly with the Rayleigh integral (dotted line) are also presented for comparison. Both curves nearly coincide; the difference between them does not exceed 5%. The linear pressure gain in the geometric focus of the array is G = pF / p0 = 58.46. This value agrees well with the quantity obtained by summation of pressures at the focus from all array elements, , where is the normalized pressure at the focus in the field of one element (Fig. 3). This simple estimate is an indirect validation of the algorithm for calculating the diffraction term. Figure 5b shows the pressure distributions in the focal plane along the x axis, also calculated by the two methods. The curves are practically indistinguishable from each other. The results of linear simulations determine the dimensions of the focal region of the beam: the size along the beam axis at a level of --6 dB is 9.7 mm, and the size in the transverse direction, 1.7 mm. The pressure amplitude in the side lobes does not exceed 16% of the amplitude at the focus.
Fig. 5.
Pressure amplitude distribution p/p0 in the (x, z) plane on the array axis, calculated numerically in a linear approximation with the new alorithm (a). The black line denotes the position of the spherical cup where the elements are located (the scale of the x axis is compressed by a factor of 3 in relation to the scale of the z axis). Comparison of the results calculated using the new algorithm (solid gray curves) and the Rayleigh integral (dotted curves) for the linear field of the array: pressure amplitude p/p0 on the axis (b) and in the focal plane along the x axis (c).
3.3. Nonlinear Field of the Array
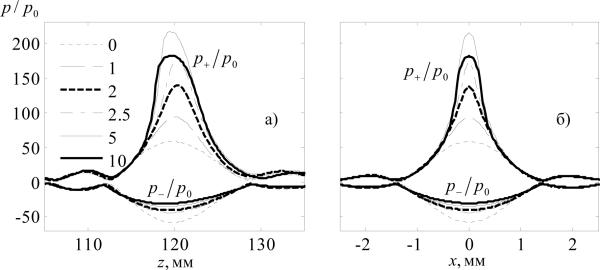
Figure 6 shows the waveforms in the center of the curvature of the array that were simulated at different initial intensities on the array elements. The intensity values are indicated by numbers given near the curves: 1, 2, 2.5, 5, and 10 W/cm2; index 0 corresponds to the case of linear focusing. The sequence of waveforms illustrates typical distortion of the focal wave profiles that follows the strengthening of nonlinear effects [10]. First, when nonlinearity is weakly expressed (1 W/cm2), insignificant distortion of the waveform occurs without formation of a shock front. The focusing gain increases for the peak positive pressure and decreases for the peak negative pressure in comparison to the linear one because of the diffraction phase shift between the harmonics [10]. The change in the focusing gain for the peak pressures caused by nonlinear effects can be described by a correction index which is the ratio of dimensionless pressures at the focus in nonlinear and linear beams [10]. For initial intensity of 1 W/cm2 the correction index for the peak positive pressure is 1.6, for the peak negative pressure −0.76. With an increase in initial intensity (2.5 W/cm2), a shock front begins to form at the focus and the focusing gain for the peak positive pressure further increases (a correction index of 3). At intensity of 5 W/cm2, a high amplitude shock is developed near the focus and the correction index for the peak positive pressure reaches its maximum value of 3.7 [10]. At even higher initial intensity (10 W/cm2), the shock front forms prefocally and, since strong nonlinear absorption of the wave energy occurs at the shocks, the correction index for the peak positive pressure decreases to a value of 3.1.
Fig. 6.
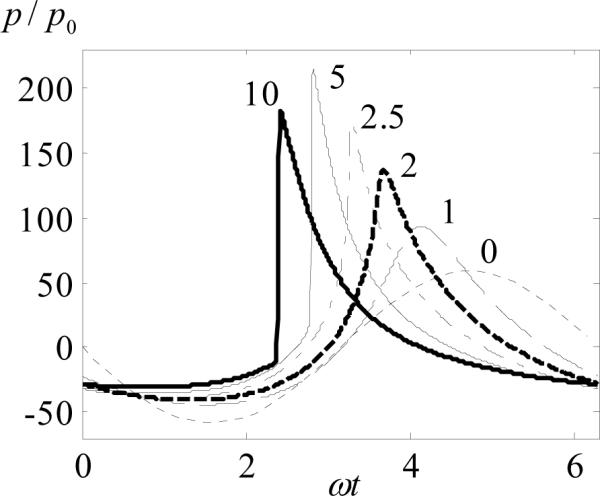
Dimensionless pressure waveforms in the geometric focus of the array (x = 0, y = 0, z = F), calculated at different initial intensity levels on array elements: 1, 2, 2.5, 5, and 10 W/cm2 (numbers next to the curves); 0 -- linear focusing of the field.
The aforementioned characteristic nonlinear-diffraction effects are also illustrated in the graphs of the dependences of positive p+ and negative p− peak pressures along the z axis (Fig. 7a) and in the focal plane along the x axis (Fig. 7b). In addition to the effect of nonlinear amplification in p+ and a monotonic decrease in p− focusing gains, the effect of a shift of the spatial maximum of p+ is observed. The shift is away from the radiator at moderate nonlinearity (2 and 2.5 W/cm2) and towards the radiator at high nonlinearity (5 and 10 W/cm2) [10]. At intensity levels considered here the shift was approximately 0.5 mm in both directions. With an increase in the initial intensity to a value at which the focusing gain for the peak positive pressure reaches its maximum and begins to decrease (5 W/cm2), narrowing of the focal region is observed in both the longitudinal and transverse directions. After the focusing gain passes through a maximum, the focal region begins to widen. The width of the focal region at a level of --6 dB for intensities of 1, 2, 2.5, 5, and 10 W/cm2 in the longitudinal direction is 7.5, 6.0, 5.3, 5.3, and 6.2 mm, respectively; in the transveres direction, 1.2, 0.8, 0.7, 0.6, and 0.7 mm.
Fig. 7.
Distributions of dimensionless positive p+/ p0 and negative p−/ p0 peak pressures along the axis of the array (a) and in the focal plane along the x axis (b) at various initial intensities: 0 -- linear focusing (dotted line); the remaining numbers next to the curves correspond to intensities on the array elements, measured in W/cm2.
CONCLUSIONS
In this paper, a novel numerical algorithm based on the Westervelt equation was developed. The algorithm makes it possible to model three-dimensional nonlinear fields of focused ultrasound radiators including formation of shocks in the focal region. A varying number of harmonics and echelon geometry of data storage were employed in the algorithm in order to reduce the sizes of data arrays during calculations. A parallel computation model for SMP computers was implemented resulting in significant acceleration of calculations. The accuracy of modeling different operators in the algorithm and the complete solution to the problem were tested by comparing the results of simulations with known analytic solutions or with the results of modeling obtained in other studies in a parabolic approximation for nonlinear axially symmetric beams. The test results have shown high accuracy of the developed algorithm. To demonstrate the abilities of the algorithm, nonlinear field of a multi-element two-dimensional phased array was simulated. It was shown that, at clinically relevant intensity levels on the array elements, high amplitude shock fronts are present in the focus of the array.
The developed algorithm can be used to solve a broad class of practically important problems of nonlinear medical acoustics. It can be applied to perform nonlinear ultrasound characterization of pressure fields of ultrasound HIFU surgical devices in water, as well as to calculate ultrasound-induced thermal effects in tissue. Generalization of the algorithm with account for smooth inhomogeneities in the propogation medium would enable more realistic simulations in soft tissues; it is also possible to model ultrasound exposures in tissue with the presence of acoustic obstacles, e.g., during irradiation through the rib cage. An important feature of the algorithm in application to HIFU is the possibility of calculating three-dimensional fields of radiators with complex spatial configuration while maintaining reasonable requirements on the computing resources available.
ACKNOWLEDGMENTS
The work was partially supported by grants from the Russian Foundation for Basic Research (project no. 09-02-01530) and the NIH (grant no. EB7643). Calculations were performed on SKIF MSU Chebyshev supercomputer. The authors thank M.V. Averiyanov, O.V. Bessonova, and S.M. Bobkova for assistance in testing the algorithm; Sh. Sokka and A. Partanen for discussion of the array parameters; and L.V. Gavrilov for constructive remarks.
REFERENCES
- 1.Pernot M, Aubry J-F, Tanter M, Thomas J-L, Fink M. High power transcranial beam steering for ultrasonic brain therapy. Phys. Med. Biol. 2003;48(16):2577–2589. doi: 10.1109/TMI.2010.2076829. [DOI] [PMC free article] [PubMed] [Google Scholar]
- 2.Hynynen K, McDannold N, Clement G, Jolesz FA, Zadicario E, Killiany R, Moore T, Rosen D. Pre-clinical testing of a phased array ultrasound system for MRI-guided noninvasive surgery of the brain-A primate study. European Journal of Radiology. 2006;59(2):149–156. doi: 10.1016/j.ejrad.2006.04.007. [DOI] [PubMed] [Google Scholar]
- 3.Quesson B, Merle M, Köhler MO, Mougenot C, Roujol S, De Senneville BD, Moonen CT. A method for MRI guidance of intercostal high intensity focused ultrasound ablation in the liver. Med. Phys. 2010;37(6):2533–2540. doi: 10.1118/1.3413996. [DOI] [PubMed] [Google Scholar]
- 4.Hand JW, Shaw A, Sadhoo N, Rajagopal S, Dickinson RJ, Gavrilov LR. A random phased array device for delivery of high intensity focused ultrasound. Physics in Medicine and Biology. 2009;54(19):5675–5693. doi: 10.1088/0031-9155/54/19/002. [DOI] [PubMed] [Google Scholar]
- 5.Gavrilov LR, Hand JW. A theoretical assessment of the relative performance of spherical phased arrays for ultrasound surgery and therapy. IEEE Trans. Ultrason. Ferroelec. Freq. Contr. 2000;41(1):125–139. doi: 10.1109/58.818755. [DOI] [PubMed] [Google Scholar]
- 6.Gavrilov LR. Akust. Zh. 2003;49:604. Acoust. Phys. 49, 508 (2003) [Google Scholar]
- 7.Bobkova S, Gavrilov L, Khokhlova V, Shaw A, Hand J. Focusing of high intensity ultrasound through the rib cage using a therapeutic random phased array. Ultrasound. Med. Biol. 2010;36(6):888–906. doi: 10.1016/j.ultrasmedbio.2010.03.007. [DOI] [PMC free article] [PubMed] [Google Scholar]
- 8.Pernot M, Tanter M, Fink M. 3-D real-time motion correction in high-intensity focused ultrasound therapy. Ultrasound. Med. Biol. 2004;30(9):1239–1249. doi: 10.1016/j.ultrasmedbio.2004.07.021. [DOI] [PubMed] [Google Scholar]
- 9.Canney MS, Bailey MR, Crum LA, Khokhlova VA, Sapozhnikov OA. Acoustic characterization of high intensity focused ultrasound fields: A combined measurement and modeling approach. J. Acoust. Soc. Am. 2008;124(4):2406–2420. doi: 10.1121/1.2967836. [DOI] [PMC free article] [PubMed] [Google Scholar]
- 10.Bessonova OV, Khokhlova VA, Bailey MR, Canney MS, Crum LA. Akust. Zh. 2009;55:445. doi: 10.1134/S1063771009040034. Acoust. Phys. 55, 463 (2009) [DOI] [PMC free article] [PubMed] [Google Scholar]
- 11.Burov VA, Dmitrieva NP, Rudenko OV. Dokl. Akad. Nauk, Biokhim. Biofiz. Mol. Biol. 2002;383:401. [Google Scholar]
- 12.Canney M, Khokhlova V, Bessonova O, Bailey M, Crum L. Shock-induced heating and millisecond boiling in gels and tissue due to high intensity focused ultrasound. Ultrasound in Medicine & Biology. 2010;36(No 2):250–267. doi: 10.1016/j.ultrasmedbio.2009.09.010. [DOI] [PMC free article] [PubMed] [Google Scholar]
- 13.Tavakkoli J, Cathignol D, Souchon R, Sapozhnikov OA. Modeling of pulsed finite-amplitude focused sound beams in time domain. J. Acoust. Soc. Am. 1998;104:2061–2072. doi: 10.1121/1.423720. [DOI] [PubMed] [Google Scholar]
- 14.Khokhlova VA, Ponomarev AE, Averk'yu MA, Crum LA. Akust. Zh. 2006;52:560. Acoust. Phys. 52, 481 (2006) [Google Scholar]
- 15.Jing Y, Cleveland R. Modeling the propagation of nonlinear three-dimensional acoustic beams in inhomogeneous media. J. Acoust. Soc. Am. 2007;122(No 3):1352–1364. doi: 10.1121/1.2767420. [DOI] [PubMed] [Google Scholar]
- 16.Kreider W, Sapozhnikov O, Khokhlova V, Farr N, Bailey M, Kaczkowski P, Partanen A, Brazzle D. Acoustic measurements and holographic reconstruction of the Philips MR-guided HIFU source. Program and Abstract Book “Current and Future Applications of MR-guided Focused Ultrasound 2010”, 2nd International Symposium; Washington DC, USA. 17–20 October 2010.p. 79. [Google Scholar]
- 17.Westervelt PJ. Parametric acoustic array. J. Acoust. Soc. Am. 1963;35(No 4):535–537. [Google Scholar]
- 18.Zemp RJ, Tavakkoli J, Cobbold RS. Modeling of nonlinear ultrasound propagation in tissue from array transducers. J. Acoust. Soc. Am. 2003;113(No 1):139–152. doi: 10.1121/1.1528926. [DOI] [PubMed] [Google Scholar]
- 19.Varslot T, Taraldsen G. Computer simulation of forward wave propagation in soft tissue. IEEE T. Ultrason. Ferr. 2005;52(No 9):1473–1482. doi: 10.1109/tuffc.2005.1516019. [DOI] [PubMed] [Google Scholar]
- 20.Yuldashev PV, Krutyanskii LM, Khokhlova VA, Brysev AP, Bunkin FV. Akust. Zh. 2010;56:463. Acoust. Phys. 56, 467 (2010) [Google Scholar]
- 21.Christopher PT, Parker KJ. New approaches to the linear propagation of acoustic fields. J. Acoust. Soc. Am. 1991;90(No 1):507–521. doi: 10.1121/1.401277. [DOI] [PubMed] [Google Scholar]
- 22.Kurganov AR, Tadmor E. New high-resolution central schemes for nonlinear conservation laws and convention-diffusion equations. J. Comp. Phys. 2000;160:241–282. [Google Scholar]
- 23.Aver'yanov MV. Candidate's Dissertation in Mathematical Physics. Moscow: 2008. [Google Scholar]
- 24.Khokhlova VA, Souchon R, Tavakkoli J, Sapozhnikov OA, Cathignol D. Numerical modeling of finite-amplitude sound beams: Shock formation in the near field of a cw plane piston source. J. Acoust. Soc. Am. 2002;110(No 1):95–108. [Google Scholar]
- 25.Filonenko EA, Khokhlova VA. Akust. Zh. 2001;47:541. Acoust. Phys. 47, 468 (2001) [Google Scholar]
- 26.Bessonova OV, Khokhlova VA, Canney MS, Bailey MR, Crum LA. Akust. Zh. 2010;56:380. doi: 10.1134/s1063771010030140. Acoust. Phys. 56, 354 (2010) [DOI] [PMC free article] [PubMed] [Google Scholar]
- 27.Rudenko OV, Soluyan SI. Theoretical Foundations of Nonlinear Acoustics. Nauka; Moscow: 1975. Consultants Bureau, New York, 1977. [Google Scholar]
- 28.Christopher T. Algorithm for the nonlinear propagation of acoustic beams from phased arrays and nonplanar sources. IEEE Trans. Ultrason. Ferroelectr. Freq. Control. 2006;53(No 11):2188–2192. doi: 10.1109/tuffc.2006.159. [DOI] [PubMed] [Google Scholar]


