Figure 5.
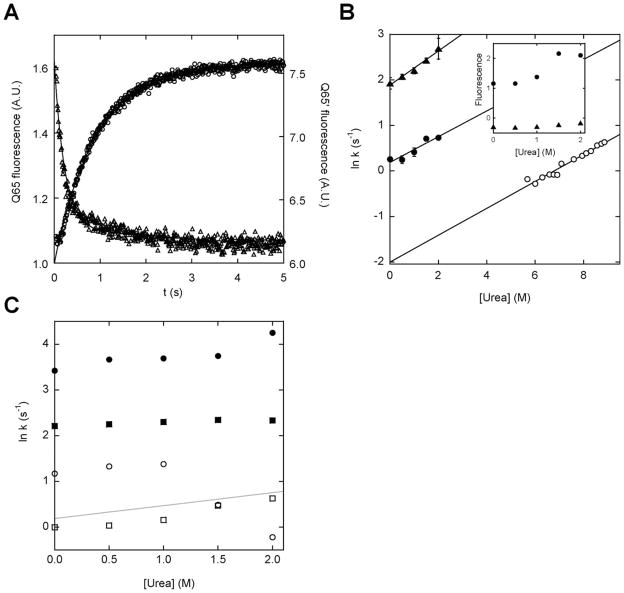
Rates and amplitudes of calcium-induced fold switching monitored by BODIPY fluorescence. (A) Representative stopped-flow fluorescence traces of calcium binding to Q65 (triangles) and Q65′ (circles). The lines are best fits of the data to single-exponential functions. (B) Rates of fold switching (filled symbols) and global unfolding (open symbols) plotted as a function of urea. Symbols are: (▲), Q65; (●), Q65′; (○), holo (Q65+Q65′). The slopes of the fitted lines are (in units of M−1 s−1): 0.38 (Q65), 0.28 (Q65′), and 0.30 (Q65+Q65′). The inset shows the fitted fluorescence amplitudes plotted as a function of urea, using the same symbols. (C) Fold-switching rates of (Q65′+W66) (squares) and (Q65′+W66′) (circles). Closed and open symbols denote the faster and slower rates, respectively. The gray line shows the linear fit of the Q65′ data from panel B for comparison.

