

Abstract
As one reflects back through the past 50 years of scientific research, a significant accomplishment was the advance into the genomic era. Basic research scientists have uncovered the genetic code and the foundation of the most fundamental building blocks for the molecular activity that supports biological structure and function. Accompanying these structural and functional discoveries is the advance of techniques and technologies to probe molecular events, in time, across environmental and chemical exposures, within individuals, and across species. The field of toxicology has kept pace with advances in molecular study, and the past 50 years recognizes significant growth and explosive understanding of the impact of the compounds and environment to basic cellular and molecular machinery. The advancement of molecular techniques applied in a whole-genomic capacity to the study of toxicant effects, toxicogenomics, is no doubt a significant milestone for toxicological research. Toxicogenomics has also provided an avenue for advancing a joining of multidisciplinary sciences including engineering and informatics in traditional toxicological research. This review will cover the evolution of the field of toxicogenomics in the context of informatics integration its current promise, and limitations.
Keywords: toxicogenomics, informatics, genome, microarray, biomarker
THE EVOLUTION OF MOLECULAR TOXICOLOGY AND TOXICOGENOMICS
The history of molecular biology is rooted back to the discovery of DNA structure by Watson and Crick (1953) nearly 60 years ago. However, the ability to fully translate the code to function is an ongoing challenge for scientists today. Understanding the translation of the genetic code to clear revelation of the function of proteins, cells, organs, and organisms will require many more advances in technology, data knowledge integration, and collaborative science. That said, substantial progress is being made, and the advance of molecular biology integration to toxicology is providing the foundation for the translation of molecular perturbations to cellular, organ, and organismal health.
In 1975, the first Southern blot demonstrated a methodology to “visualize” the presence of genetic material in a manner that was feasible for many biologists (Southern, 1975). This technique was quickly adapted to the detection of RNA transcripts via the Northern blot (Alwine et al., 1977). This technology breakthrough enabled toxicologists to begin to track and follow the changes in gene transcript level and likely compensatory changes in protein products, following the exposure of cells or tissues to toxicants or other environmental stressors. Indeed, an example of one of the first applications of the Northern blot in such an experiment was conducted to quantitate the level of lactate dehydrogenase transcript following exposure to compounds (Miles et al., 1981).
Although 1981 does not seem so long ago, if we fast forward to today's molecular toxicology laboratory, we find that techniques such as the Southern and Northern blots are practiced infrequently. These methods are now replaced with more rapid and higher throughput methods that require very small amounts of sample material and enable the tracking of molecular events at a whole-genomic level across multiple doses and time points.
The most enabling technology for such assessments is the microarray chip. First published in the mid-1990’s, DNA microarrays of two main types of platforms emerged. One platform, borrowing technology from the semiconductor industry, was produced with “on-chip synthesis” of sets of short oligo sequences that spanned each gene transcript with compilation of the individual gene probe sets to cover a whole genome (Chee et al., 1996). The other platform involved deposition of longer length complementary DNA “spots” generated, a priori, by chemical synthesis or PCR onto specially coated glass slides (Hughes et al., 2000; Schena et al., 1995). The result for either platform was a miniature array that could ideally allow the probing of the whole-genomic transcript profile or monitor the expression of a host of functionally related genes for any biological sample RNA that was hybridized to it. The application of array technology in toxicology experiments provided the basis for the emergence of a new field, toxicogenomics. Today, the term toxicogenomics represents the interface of multiple functional genomics approaches as applied to understand mechanisms of toxicity.
The promise of toxicogenomics was so strong for impacting the fundamental basis of toxicological sciences and risk assessment that there have been numerous reviews as well as National Academy of Sciences reports that detail the opinion of leading scientists in multiple fields to provide advice on the needs and limitations for advancing application of toxicogenomics toward screening, elucidation of mechanism, assessment of exposure, and, ultimately, calculation of individual susceptibility and risk (NRC, 2007). In addition, there has been investment in the research and technology at numerous academic, government, and industrial centers of toxicology research. Although toxicogenomics is driving an evolution of how we may conduct traditional toxicological work, such as risk assessment, it is also now clear that successful execution of microarray technology requires the development of collaborative science across multiple disciplines such as molecular biology, engineering, mathematics, chemistry, physics, statistics, and computer science. The integration of the product of these disciplines with various biological subdisciplines, such as toxicological sciences, has really been a revolution not only for scientific discovery but also in the culture and organizational structures that toxicologists now work. Many papers have been written that capture the summary of microarray technology and all its complexities for application in all areas of biology. In fact, for toxicology, there are more than 500 papers reviewing and/or illustrating the concepts of toxicogenomics, too many to be meaningfully captured in this review. Examples of key toxicogenomics applications are summarized in Table 1. This review will highlight illustrative examples of toxicogenomics applications in the context of the emerging information integration.
TABLE 1.
Overview of Key Examples of Toxicogenomics Applications
| Clustering of compounds in similar mechanistic classes |
| Generation of hypotheses regarding compound action |
| Revelation of mechanisms of compound action |
| Classification of blinded compounds |
| Clustering of compounds by elicited toxicant phenotype |
| Ranking and categorization of drug candidates by toxicogenomics signature |
| Discerning no effect level for compound transcript effect |
| Discovery of biomarkers of toxicity |
| Discovery of exposure biomarkers |
| Validation/qualification of biomarker signatures |
TOXICOGENOMICS: UNDERSTANDING THE VISUALIZATION OF COMPLEX DATA
First discussed in the public literature in 1999 (Nuwaysir et al., 1999), toxicogenomics was first described as a term to illustrate the integration of toxicological research with the emerging new technologies designed to broadly interrogate the functional genome (i.e., RNA, protein, metabolite profiling, and polymorphisms/functional DNA mutations). Since then, there has been a steady adoption of the principles and technologies relevant to toxicogenomics throughout academic and industry laboratories, and there have been many scientific advances in various toxicology-related disciplines since. Examples of the integration of the technology within toxicological research will be highlighted in this review.
Making Sense of the Data: Classification and Prediction Analysis
When toxicogenomics ushered to the forefront as an area of research investigation and possible drug safety application (Nuwaysir et al., 1999), it was following on the heels of the initial success of large-scale genome initiatives related to areas such as cancer biology, the cell cycle, development, and differentiation. Typical toxicogenomics experiments follow transcript changes across a genome following exposure of cells or tissues to a compound or environmental insult (Fig. 1). “Validation” of the toxicogenomics hypothesis that these transcript changes lead to an ability to group compounds with similar effects and/or elucidate mechanistic insights previously unknown with the chemical action requires not only technical precision of the cell/organ exposure, sample collection, and processing components of the experiments but also complex computational and bioinformatics approaches and resources. With the wealth of the genomic data collected from series of microarray experiments, investigators quickly realized that databases and analytical tools were essential in order to effectively manage and condense the data into a more manageable form. Building on the momentum gained from leveraging databases and computational algorithms for genome sequencing efforts, engineers, statisticians, mathematicians, and computer scientists began to develop analytical tools and shared resources for microarray gene expression data. Analysis of toxicogenomics data can follow several different paths including class discovery, comparison, prediction, and mechanistic analysis. Each one will be presented here with a brief overview to highlight the impact that bioinformatics and statistical analysis have had on the field of toxicogenomics over the past 5–10 years accompanied with a long-term (50+ years from now) vision of how bioinformatics will influence and be used in toxicogenomics to improve human health and the prevention of diseases from environmental/toxicological stressors.
FIG. 1.

Example of toxicogenomics flow scheme. In this example, individual rodents are exposed to varied doses of compound and tissues are collected at various time points and subject to microarray analysis. Calculations are made to (1) determine the significantly altered genes in each sample and (2) map these gene changes into annotated pathways. This allows for initial assessment of a view to potential mechanisms of tissue response to compound perturbation. As illustrated by (3), expression files may also be mapped against archived files to determine similarity of compound action/response to other compounds that have been previously studied in the database. It should be noted that analyses may be conducted on individual dose/time profiles or across dose and time response with an assessment of “trend.”
Clustering
Arguably, the most successful and widely used analytical tools developed for microarray to date are the clustering algorithm and tree-based visualization of gene expression data. Having a subset, an array, or genome-wide list of genes in the rows of a matrix and the samples used for microarray analysis in the columns, a given element of the two-dimensional matrix (row and column coordinates) contains the expression value whether it be a ratio of the measurements of two samples or the relative intensity of a single sample (Fig. 2). The Eisen laboratory (Eisen et al. 1998) popularized the use of the hierarchical clustering methodology (building groups of genes and samples from the individual objects to clusters of objects based on similarity of expression measurements) to analyze a yeast cell cycle time course study (Spellman et al., 1998) and displayed the relationship of the genes according to their (1) distance relative to one another on a dendrogram and (2) pattern and differential expression illustrated by a color gradient heat map (Fig. 2). The result of the clustering of gene expression data is an assessment of the co-expression of genes within or between samples and the presumed coregulation of genes based on regulatory machinery (Fig. 2). Waring et al. (2001) were one of the first groups to use clustering to analyze toxicogenomics data. Strong correlation between the histopathology, clinical chemistry, and gene expression profiles from rats treated with 1 of 15 known hepatotoxicants was revealed, and genes were identified whose expression level correlated strongly with effects on clinical chemistry parameters.
FIG. 2.
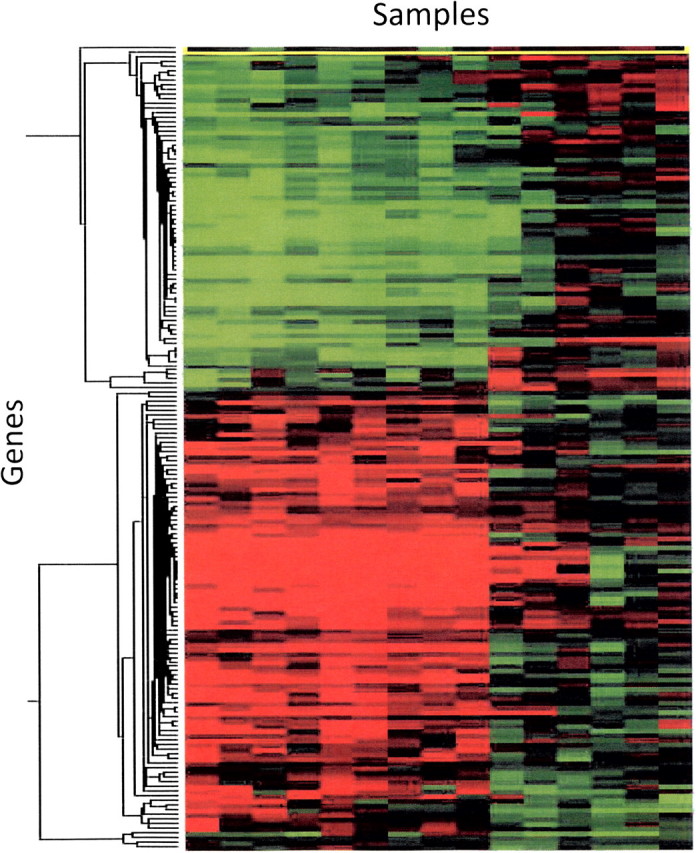
Example of typical “clustering” figure. Individual gene expression profiles are grouped according to similarity on the x- and y-axis. Each column represents an individual animal gene expression profile (compound-exposed liver). Each row represents an individual gene in the profile. The red color indicates that a gene is increased in the compound-treated samples relative to vehicle controls. Green color represents a decrease in expression of the compound-treated samples relative to vehicle controls.
Other clustering approaches such as self-organizing maps (Tamayo et al., 1999), k-means, and principal component analysis (PCA) (Yeung and Ruzzo, 2001), which varied the methodologies used for grouping the data, became available to extend the analysis capability of gene expression data and was applied in many fields of biology. However, it was clear, early on, that the study design of a cancer biology experiment, e.g., with tumor versus nontumor samples for comparison, is quite different from a typical toxicogenomics study with a time series and/or dose-response underpinning making the use of ordinary tools for clustering gene expression data from toxicology studies somewhat inadequate for class discovery. Compounding the challenge is that many toxicogenomics studies utilize several compounds for comparison that may have unique or common expression signatures (Burczynski et al., 2000; Hamadeh et al., 2002b; Hughes et al., 2000) and low-dose exposures (Hamadeh et al., 2002a; Harries et al., 2001; Lobenhofer et al., 2004) that may elicit very small, early, and difficult to distinguish gene expression changes.
To address some of the challenges of clustering gene expression data from toxicogenomics studies, several bioinformaticians with expertise in computation and a fundamental understanding of biology began working with toxicologists, pathologists, and statisticians to enhance or refine cluster analysis tools that (1) leveraged the experimental designs of the studies (Bushel et al., 2001; Fostel et al., 2005) and/or (2) harnessed phenotypic and other ancillary data (Hamadeh et al., 2002c; Luhe et al., 2003; Paules, 2003; Powell et al., 2006). Tan et al. (2006) integrated time course gene expression data from a toxicogenomics study with a marker for cytotoxicity by partial least squares to identify biomarkers in primary rat hepatocytes exposed to cadmium. Extracting patterns and identifying co-expressed genes (EPIG) is a novel approach developed (Chou et al., 2007) to find all the patterns in a data set and categorize them based on the signal to noise ratio, magnitude of expression, and correlation of gene profiles. EPIG is similar to performing an ANOVA between intragroups and intergroups representing biological replicates and treatments, respectively. Leveraging the three parameters and the study design gives EPIG power to extract a fair amount of all the patterns in the data and hence more genes categorized to them that cover more biological processes that may be impacted in the study.
In order for successful application of clustering to obtain coexpressed genes, the vectors of the expression profiles across the samples need to be highly similar; discriminant vectors are organized by “unsupervised” clustering of samples. Sometimes investigators wish to apply clustering of data based on samples; however, one of the challenges for this is how to categorize samples, based on treatment, time point, or phenotype? Sometimes, supervised clustering of samples limits discovery of similarities of samples based on molecular endpoints, and ideally, a combination of supervised and unsupervised approaches should be applied. To address this challenge, Bushel et al. (2007a) devised a semisupervised clustering approach that incorporates phenotypic data (i.e., histopathology observations and clinical chemistry measurements) with gene expression to group samples that are more valid than if clustered with gene expression data alone. Following the grouping, the genes that discern the clusters of the samples most significantly can be extracted from the prototypes (representations) of the clusters. The expression profiles of these are highly correlated with the phenotypes of the samples within the clusters.
Interestingly, with toxicogenomics data, there are actually cases where a subset of expression profiles is highly similar across a subset of conditions. For instance, genes related to glycolysis and gluconeogenesis may be tightly co-expressed in an early response to a chemical treatment but may be less correlated under other exposure conditions. Regular cluster analysis is not designed to pick out these types of salient responses. However, methods such as biclustering (Cheng and Church, 2000; Prelic et al., 2006) were developed to partition the two-dimensional matrix of gene expression data into subsets of genes sharing compatible expression patterns across subsets of samples (so-called cliques). cc-Biclustering (Chou and Bushel, 2009) takes this a step further by constraining the extraction of expression bicluster cliques according to an experimental design and an endpoint measurement related to the phenotype of the samples. Another way to exploit the time and dose dimensions of toxicogenomics studies is to account for the correlation of gene expression given an offset in the time or dose dimension. For instance, at a given dose range of acetaminophen (APAP) or carbon tetrachloride (CCl4), a set of genes measured in exposed rat liver are uncorrelated with each other between the two toxicants. However, if the expression profiles of the CCl4 samples for the time series are offset positively by three intervals, then the expression of the sets of the genes between the two toxicants are highly correlated. Mining the data in such a fashion is extremely valuable in toxicogenomics studies in order to extract expression patterns with an explicit phase shift that is typical for compound-specific delayed responses following a stress response.
Statistical Comparison of Classes
At the very least, investigators in the field of toxicogenomics are often interested in a basic question of whether or not there are a set of gene expression profiles that can separate two or more classes of samples according to a particular exposure condition or phenotype (Fig. 3). An important consideration is the ability to confidently account for the variation across groups of biological samples. The use of mixed linear models was introduced as a powerful and flexible way to accommodate a wide variety of experimental designs for the simultaneous assessment of significant differences between multiple types of biological samples (Wolfinger et al., 2001). An additional contribution is that the output of the mixed model analysis is visualized best with a “volcano plot” that illustrates the distribution of the expression measurements partitioned by p values and fold change. Dudoit and Fridlyand (2002) presented the MA plot as a different visualization of two-color gene expression data where the average intensity (A) is plotted on the x-axis and the ratio of the intensity (M) is plotted on the y-axis. Here, A = (1/2) (log2R + log2G), M = log2R − log2G, where R and G are the intensity measurements from the red (Cy5) and green (Cy3) microarray chip scanning channels, respectively. Whatever the basic analysis strategy, given that several statistical tests are performed on a large number of genes, the chance of finding one detected as significant is not at the predefined type one error setting. Therefore, it became common practice to control for multiple comparisons of samples and multiple testing of genes by adjusting the p values for the family-wise error rate and the false discovery rate, respectively.
FIG. 3.

Workflow for analysis of microarray data. Individual microarray chip data are deposited into a data warehouse with metadata that describe the samples analyzed. Gene measurements are corrected for background and normalized relative to controls. Multiple arrays can then be assessed for similarity or discriminant patterns of gene expression using clustering, and prediction of class may also be applied. Finally, individual or groups of arrays or clusters of genes can be analyzed for mechanism using a variety of pathway tools and visualization aids.
An initial challenge and in some sense proof-of-concept for applying toxicogenomics to the genome-wide study of toxicology was to differentiate compounds based on the gene expression signature elicited from exposure (Burczynski et al., 2000; Hughes et al., 2000). The ambitious goal for these groups was to distinguish between two mechanistically unrelated classes of toxicants (cytotoxic anti-inflammatory drugs and DNA-damaging agents) based solely on the correlation of approximately 250 gene expression profiles in HepG2 human hepatoma cultured cells. Surprisingly, the discrimination of the 100 compounds was not possible given the large number of gene profiles and the limited replication in the data set. However, when technical and biological replications were introduced into the experimental design to reduce the variability between samples, a more definitive set of discriminators was obtained to distinguish between cisplatin and a pair of nonsteroidal anti-inflammatory drugs. Furthermore, this more focused fingerprint of the compounds was ultimately useful for discriminating between the database of 100 cytotoxic anti-inflammatory drugs and DNA-damaging agents. Class comparison of toxicogenomics data sets was set in motion.
Prospectively, a more extensive investigation, albeit a less sophisticated data analysis than those before, to discern compound class signatures for compound separation using gene expression was performed (Bartosiewicz et al., 2001). Gene expression patterns, assessed as significantly differentially expressed based on a designated twofold criterion, from liver and kidney tissues exposed to five classes of compounds were found to be relatively distinct from one another. It was clear that rudimentary bioinformatics analysis strategies with prudent statistical considerations taken into account were sufficient enough to glean gene expression signatures from samples to compare compound classes.
Interestingly enough, Hamadeh et al. (2002a) leveraged a series of analytical approaches to identify gene expression profiles from the livers of male Sprague-Dawley rats that were specific for distinguishing subclasses of compounds based on liver samples exposed to phenobarbital, an enzyme inducer, from the peroxisome proliferator agents clofibrate, gemfibrozil, and Wyeth 14,643. Therefore, the sophistication of the use of bioinformatics analysis tools and intuitive strategies made it convincingly clear that class separation of compounds based on gene expression data could be resolved as specific as subclasses of compounds that share biological outcomes. In addition, as a form of validation for class discernment of toxicogenomic data sets, these distinctive gene expression patterns were used to predict, with a high degree of success, the likeness of blinded compounds to either a compound in the chemical signature database or not (Hamadeh et al., 2002b). A more streamlined, less subjective computational approach to partition the phenobarbital and peroxisome proliferator compounds into classes and subclasses based on the gene expression data was done by quality assessment of the data, hierarchical cluster analysis, a one-way ANOVA or linear discriminant analysis, and mixed linear model approach (Bushel et al., 2002). Based on the gene expression profiles, the phenobarbital samples were highly distinguishable from the peroxisome proliferator, and the fibrates (clofibrate and gemfibrozil) were found to be very much distinct from the Wyeth 14,643 compound. Even a basic t-test, when employed with quantity threshold clustering to analyze toxicogenomics data, was useful for teasing out gene expression patterns that separated hepatotoxic chemicals (Minami et al., 2005). Similarly, general linear models, linear and logistic regressions that were used to test for groups of genes with expression data that are associated with clinical outcomes and survival, were of value as bioinformatics tools to analyze toxicogenomics data for class comparisons (Goeman et al., 2004). Even PCA using expression data from genes that respond to the exposure of rats to a large number of typical drugs was found to be able to (1) separate dose- and time-dependent clusters of samples in the treated groups from their controls (Hamadeh et al., 2004) and (2) correlate the components with elevated bilirubin levels. Obvious and convincing is the notion that leveraging bioinformatics, mathematics, statistics, pathology, and toxicology is essential for transforming toxicogenomics data into meaningful and useful knowledge for class comparison (Morgan et al., 2004; Waters et al., 2003). Fortunately, classical statistical models and bioinformatics/computational biology methods such as ANOVA, mixed linear models, and decision trees offer a good bioinformatics framework to begin to use microarray data with other associated biological/toxicological data for analysis (Johann et al., 2004; Kerr and Churchill, 2001; Tong et al., 2003; Wolfinger et al., 2001).
Newer more sophisticated approaches for analysis of toxicogenomics data sets involved simultaneous comparisons of groups of samples by assessing the means of the data using inequalities (Peddada et al., 2003). Using a class of statistics called order-restricted inference, candidate temporal gene profiles are defined in terms of inequalities among mean expression levels at time or dose points. The methodology selects genes when they meet a bootstrap-based criterion for statistical significance and assigns each selected gene to the best fitting candidate profile for class comparison. Brute force approaches used different statistical and clustering methods to discriminate genotoxic carcinogens from nongenotoxic ones (Ellinger-Ziegelbauer et al., 2005; van Delft et al., 2005). However, a true test of using toxicogenomics to separate and compare compounds and probably the validation of the proof-of-concept applied support vector machines (SVMs, a supervised learning approach) to discriminate different classes of toxicants based on transcript profiling (Steiner et al., 2004). Simply put, SVMs are classifiers comprised of a given set of training examples, each marked as belonging to one of two categories and a model that determines whether an unknown sample falls into one category or the other. In one example study, the SVMs derived classification rules and potential biomarkers, which discriminated between hepatotoxic and nonhepatotoxic compounds (Steiner et al., 2004).
Class Prediction
Given the previous successes in the world of bioinformatics, such as the analysis of toxicogenomic gene expression data to separate rather easily distinguishable classes of samples, newer challenges were presented to determine whether the current state-of-the-art bioinformatics tools and methodologies could be used to identify indicators of toxicity as well as ascertain early predictors of a toxicological response. The National Institute of Environmental Health Sciences (NIEHS) National Center for Toxicogenomics (NCT) launched an in-house informatics challenge to find analytical methodology that could use gene expression from the blood of rats to predict toxic exposure to APAP. Out of all the analytical approaches submitted, the three derived with a bioinformatics flavor (taking the study design into consideration) outperformed the other bioinformatics approaches when predicting test blood samples (Bushel et al., 2007b). The accuracy was as high as 96%, but interestingly, the top approaches also outperformed predictions using traditional histopathology and clinical chemistry/clinical pathology panels, which illustrate a conundrum for toxicologists. Furthermore, genes in the predictors based on the rat data separated gene expression data from human subjects that overdosed on APAP. As an extension from a single compound, Huang et al. (2008) used an eclectic array of bioinformatics approaches to show genes related to apoptosis predicted necrosis of the liver as a phenotype observed in rats exposed to a compendium of hepatotoxicants. Taking prediction to even a higher level, the MicroArray Quality Control Phase II Food and Drug Administration (FDA)–led consortium embarked on using toxicogenomics and clinical data sets to derive biomarkers predictive of a battery of endpoints (Shi et al., 2010). The NCT toxicogenomics compendium gene expression data set and an elaborate cross-classification strategy were used to identify genes and pathways that predicted necrosis of the liver (a form of drug-induced liver injury [DILI]), across tissues (blood to liver and vice versa), and genomic indicators from the blood as biomarkers for prediction of APAP-induced liver injury (Huang et al., 2008). However, an active debate in the field concerns the “gold standard” for data analysis and comparison. This is an important issue with respect to establishing molecular changes and the impact of molecular events relative to the phenotypic changes that are ultimately observed, sometimes well after the initiating insult.
Other more targeted utilizations of bioinformatics approaches to predict toxicogenomics data were employed. For example, prediction analysis of microarray training was accomplished by comparing two positive compounds as nongenotoxic hepatocarcinogens (methapyrilene and thioacetamide, high-dose group only) with six negative compounds (Uehara et al., 2008a). A classifier containing 112 probe sets produced an overall prediction success rate of 95% and also showed characteristic time-dependent increases of expression of the gene set by treatment. They also revealed species-specific coumarin-induced hepatotoxicity differences in gene expression between human and rat hepatocyte cultured cells (Uehara et al., 2008b), whereas others capitalized on classifiers and prediction of toxicogenomics data from short-term in vivo studies. In summary, the variety of classification methods that have been applied to toxicogenomics data sets has aided to advance the visualization of similar and distinct patterns of molecular effects that toxicologists now use to infer similarity or differences in compound effects.
Mechanistic Analysis
The bioinformatics community within the toxicogenomics arena has had a vigorous and long-lasting debate about the importance of discerning the mechanisms of action of toxic responses versus simply identifying a small cadre of genes that serve to possibly predict an endpoint of toxicity but fall short of conveying much about the biology of the condition (Cunningham and Lehman-McKeeman, 2005). As per Ray Tennant (Tennant, 2002), former Director of the NIEHS NCT, “Toxicology will progressively develop from predominantly individual chemical studies into a knowledge-based science in which experimental data are compiled and computational and informatics tools will play a significant role in deriving a new understanding of toxicant-related disease.” Hence, bioinformatics was perceived to be the key to unraveling the mysteries of mechanistic toxicology from a genomics perspective (Tennant, 2002). However, to better understand the underlying biology of events that mediate toxic responses, a good understanding of the biology of target and nontarget organs is essential. This is an enormous and ambitious effort considering the tens of thousands of genes in the genome of a species and the complexity of the cellular pathways. A wealth of data have been collected and analyzed by world-wide efforts to assess the risk and human health ramifications from exposure to toxic, environmental, and physical stressors; the knowledge about the key biological mechanisms leading to idiosyncratic toxicity or human genetic susceptibility to toxic agents will evolve as multiple data sets are combined and integrated. The quandary is that in the past, simple models and reductionist approaches to understand the development of a complex phenotype characteristic of a toxic response have been utilized to assess human risk to chemical exposures, xenobiotics, and environmental pressures (Hamadeh et al., 2004). Subsequently, the current understanding and knowledge of toxicity remains grossly descriptive, the molecular mechanisms are elusive, and the intervention of human genetic variation, i.e., polymorphisms, provides another layer of complexity for the individual risk assessment equation. One of the earliest attempts at using genomics and bioinformatics to investigate the mechanisms of toxicants and the impact of dose-response was where the transcriptional response of a hormone-responsive breast cancer cell line (MCF-7) stimulated with various concentrations of estrogen was used to define a new baseline in toxicology called the No Observed Transcriptional Effect Level (NOTEL) (Lobenhofer et al., 2004). NOTEL is essentially the dose (or concentration) of a compound or stressor that does not elicit a meaningful change in gene expression (i.e., the threshold of the dose/concentration that elicits minimal mechanistic activity). This work was followed with a similar approach applied to an in vivo exposure and genomics assessment of hormonally responsive tissues. The dose-response assessment suggested that detection of relevant gene expression occurred at doses similar to doses where phenotypic changes were observed and not lower (Naciff et al., 2007). Fortunately, toxicogenomics promises to bridge conventional toxicology with genomics and expression analyses in order to shed new light on the mechanisms involved in incipient toxicity. New methods of data analysis and bioinformatics are needed if this endeavor is to be successful.
Although there are known regulatory pathways catalogued in biological resources, most of these regulatory networks are constructed from gene interactions ascertained under normal conditions and as such do not represent the totality of the mechanisms involved in responses to environmental factors, toxicants, and other forms of stressors. The assortment of biological resources such as Gene Ontology, Kyoto Encyclopedia for Genes and Genomes, Munich Information Center for Protein Sequences, GenBank, Ensembl, the Human Gene Organization, TRANSFAC, and TRANSPATH databases that provide annotation of genes and gene processes are certainly helpful but fall short when considering the fact that in toxicogenomics we need to know much of what is unknown regarding gene membership in pathways and gene annotation across species. In addition, the data sets necessary to resolve the specific changes in biological processes mediated by toxic exposures are limited in chemical depth and exposure treatments. Be that as it may, there have been efforts and programs set in place to get at the low hanging fruit when it comes to ascertaining mechanisms of action of stressors. The National Center for Toxicological Research (NCTR) within the FDA is embarking on an impressive genomics and bioinformatics study to understand the transcription baseline of the liver. The idea is that because a significant number of drugs fail during late-stage clinical trials because of unanticipated liver toxicity and given that adverse events, including liver injury, may show up only after the drug has been on the market, thus necessitating withdrawal, it is critically important to understand liver toxicity at the mechanistic level and to develop novel tools for identifying liver toxicity issues along the various stages of drug development (Weida Tong, personal communication). The NCTR/FDA has developed a liver toxicity knowledge base (LTKB). The LTKB is a content-rich resource with a focus on developing knowledge and data mining tools for hepatotoxicity in the form of networks between drugs, molecular signatures, liver-specific biomarkers, gene/protein functions, pathways, and injury types. The project will help to improve the basic understanding of liver toxicity and facilitate the data and knowledge for utilization by research, industry, and regulatory groups.
Key to the comparison of mechanistic or general gene expression profiles is the composite of knowledge bases that combine key gene/probe annotation with pathway/mechanistic information. Ideally, these databases, when applied in toxicology and comparative biology settings, would enable cross-species annotation. Within the past 10 years, there has been the development of toxicogenomics databases, which provided licensed or open access to data corresponding to chemicals that affected biological systems. Iconix and GeneLogic, two commercial entities, offered databases of chemically perturbed molecular profiles using their proprietary toxicology signature models for the liver, kidney, or other tissues (Ganter et al., 2005). They derived their chemical models from analyzing databases containing hundreds or thousands of gene expression signature profiles corresponding to reference compounds tested both in vivo and in vitro. Their systems provided mechanistic insight into potential toxicities. The chemical effects in biological systems (CEBS) database started off by making the expression profiles for toxicants studied at the NCT, publicly available, but then extended the system to be a repository for any toxicogenomics studies (Waters et al., 2008). The hallmark of CEBS is that the data from toxicogenomics experiments are curated, stored in the context of the study design, and integrated with other omics data or ancillary toxicological data (Fostel et al., 2005; Xirasagar et al., 2006). The National Toxicology Program at the NIEHS has acquired DrugMatrix, a toxicogenomics reference database and informatics system along with its companion toxicogenomics analysis suite resource ToxFX with the goal of making these resources freely available to public and ultimately facilitated the integration of toxicogenomics into hazard characterization (Scott Auerbach, personal communication). DrugMatrix is existing large molecular toxicology reference database and informatics system containing a unique reference set of gene expression profiles based on benchmark molecules that are anchored to classic pharmacology, toxicology, and clinical pathology measurements. The database currently contains the profiles derived from administering 638 different therapeutic, industrial, and environmental compounds to rats or cultured rat tissue cells at both nontoxic and toxic doses including FDA approved drugs, drugs approved in Europe and Japan, withdrawn drugs, drugs in preclinical and clinical studies, biochemical standards, and industrial and environmental toxicants. Additionally, a curation team extracted all relevant information on the compounds from the literature, the Physicians' Desk Reference, package inserts, and other relevant sources. The EDGE database also provides a centralized resource for toxicogenomics data that were generated on a common platform and from a standardized protocol (Hayes et al., 2005). The Comparative Toxicogenomics Database provides access to interactions between chemicals and genes and facilitates cross-species comparative studies of gene expression networks (Mattingly et al., 2006). Interestingly, commercial literature-based knowledge bases such as Ingenuity Pathway Analysis (IPA) and Netherlands Organization for Applied Scientific Research's T-Profile have data mining capabilities that are targeted toward toxicogenomics and toxicological gene regulatory function. IPA-Tox assesses the toxicity of compounds in the context of toxicological processes, pathways, and gene networks, whereas T-Profiler allows the comparison of toxicogenomics data sets for enrichment of mechanistic pathways, biological processes, and signaling cascades. Also, GeneGo offers a bioinformatics tool called MetaDrug for compound-based pathway analysis to glean mechanisms of action, assess toxicity profiles, and determine off-target effects.
Gene expression profiles give a good indication of the state of the organ. This phenotype can be defined by several means including clinical readings, functional tests, clinical chemistry evaluations, or histopathological observations (Hamadeh et al., 2004). Anchoring gene expression to these alterations is key to finding hallmark biomarkers of adverse effects and for derivation of testable hypotheses regarding mechanisms of action. Two early toxicogenomics investigations that utilized bioinformatics to obtain an initial understanding of the mechanisms of action demonstrated the feasibility of phenotypic anchoring of gene expression to lesions elicited by nephrotoxicants. In addition, microarray analysis was used to associate gene expression with cisplatin-mediated toxicity in male Sprague-Dawley rat kidney samples (Huang et al., 2001). The gene expression pattern elicited suggested the occurrence of apoptosis and the perturbation of intracellular calcium homeostasis. In addition, the induction of multidrug resistance genes and tissue remodeling proteins suggested development of cellular resistance to the drug as well as tissue regeneration. In another study, transcriptional changes in genes involved in DNA damage response and apoptosis, as well as oxidative stress and inflammation reactions, were detected following exposure of male Wistar rat kidneys to a mycotoxin contaminant found in cereals (Luhe et al., 2003).
An idealistic expectation of toxicogenomics is that gene expression data suffice as a “digital pathology” representation of the phenotype of toxicity for a given toxicant. A working hypothesis is to define signature patterns of altered gene expression that indicate specific adverse effects of chemicals, drugs, environmental pressure, or physical stressors (Paules, 2003). Ideally, the gene expression changes associated directly with the primary effect of the compound would be elucidated prior to the appearance of the phenotypic changes. Foster et al. (2007) conducted toxicogenomics profiling for a multiyear period across preclinical toxicology drug in vivo screening studies. In this analysis, the group discerned a general correlation between the overall number of gene changes and ultimate compound dose toxicity. In addition, they found that in a fair number of cases, the gene expression changes consistently preceded changes observed through histopathology analyses (Foster et al., 2007). In general, the maturing of our biological knowledge and incorporation of all genes into pathway information will be required for full understanding of the promise of toxicogenomics. In this vein, bioinformatics will be key to aid in teasing out mechanisms of action of toxicants and will be invaluable in the quest to elucidate molecular mechanisms involved in the manifestation of toxicity as well as to derive of molecular expression patterns that predict toxicity or the genetic susceptibility to it.
BIOMARKERS: SURROGATES OF PATHWAY AND/OR TOXICOLOGICAL EFFECTS
From a rapid screening perspective, it is still not cost effective or practically feasible to consider that whole-genome profiling of organisms in “real time” can be done to elucidate biological responses to unique compounds or the environment. For some time, tests will likely be developed that will focus on subsets of genes/proteins; however, the qualification of these sets of biomarkers will require scientific collaboration in order to fully understand the sensitivity/specificity of these markers. For example, one group published a key signature set of genes that was associated with phospholipidosis in a set of carefully conducted experiments (Sawada et al., 2005). As phospholipidosis is an active area of research and concern by drug developers and approving agencies, it is likely that future work on cross-industry validation of this or related signatures will emerge. Other signature set of genes, related to possible prediction of the carcinogenic phenotype (Fielden et al., 2008), association of genotoxic activity (Ellinger-Ziegelbauer et al., 2009), or nephrotoxicity biomarkers (Amin et al., 2004, Wang et al., 2008), have already been the center of industry-academic collaborations, facilitated by groups such as The Health and Environmental Sciences Institute (http://www.hesiglobal.org) or the Critical Path Institute (http://www.c-path.org). These collaborations have enabled the replication and refinement of signature gene sets toward universal qualification, even for regulatory purposes.
Some groups have focused on the functional annotation of genes using a custom-curated knowledge base of pathways, biological processes, regulatory interactions, and molecular reactions (Shi et al., 2008), whereas other groups have extended the prediction exercise using other types of data sets for biomarker elucidation. For instance, Wang et al. (2009) recently demonstrated the potential of circulating microRNA molecules (small regulatory noncoding RNAs) as biomarkers of DILI in an APAP-overdosed mouse model system. Kondo et al. (2009) used gene selection based on t statistics coupled with the SVM classifier and achieved a sensitivity of 90% with a selectivity of 90% of predicting drug-induced renal tubular injury. The list of the candidate biomarkers contained well-known genes, such as Kidney injury molecule 1, Ceruloplasmin, Clusterin, Tissue inhibitor of metallopeptidase 1, and also novel biomarkers. Zidek et al. (2007) leveraged gene expression data from a focused Illumina BeadChip microarray containing 550 liver-specific genes to predict acute hepatotoxicity with an ANOVA model and SVM classifier.
Other assay systems and bioinformatics analysis strategies have been proposed or used as a model for identifying predictors/biomarkers of toxicological responses (Amacher et al., 2005; Burczynski and Dorner, 2006; Hamadeh et al., 2010; Merrick, 2008; Miller et al., 2008; Xu et al., 2008). It is now clear that cutting-edge bioinformatics approaches are instrumental in discerning small sets of genes that are highly predictive of endpoints within toxicogenomics data sets. Whether the output can be further evaluated as potential biomarkers in a clinical setting is highly debated in the scientific community. Time will tell whether such approaches, or a new breed, of them will be capable of elucidating the biomarker surrogates for mechanisms of action for a great deal of toxic responses that impact the public.
ADVANCING TOXICOGENOMICS IN FUTURE YEARS
As toxicogenomics continues to move forward, it will likely seem at times as if progression is standing still and at other times advancing quickly. There are a number of challenges that need to be continuously pursued by the field in order to ensure future progression (Table 2). In order to advance, key milestones will require coordination across fields and disciplines, so progress is likely to be incremental. Within the next 5 years, it is likely that toxicogenomics will move slowly forward. Biologists will continue to impact the field of informatics, and what constitutes a pathway will be better defined and begun to be standardized universally. In addition, the work of discovery and validation of prodromal biomarkers for a variety of toxicities and diseases will continue to evolve.
TABLE 2.
Ongoing Challenges for Toxicogenomics Applications
| Challenge | Examples of Venues for Addressing |
| Gene annotation | Public genome projects |
| Cross-species extrapolation | Public genome projects |
| Technical standards for evolving platforms | National Institute of Standards, MIAME, and MAQC consortiums |
| Standards for data sharing | NCBI, MIAME, and MAQC consortiums |
| Signature/biomarker qualification | Critical Path Institute, FDA, Environmental Protection Agency, and European Regulatory Groups |
| Translation of assays for regulatory purposes | FDA Critical Path Initiative, ICH |
| Ethical, Legal, Social Issues | National Institutes of Health, NHGRI |
Note. MIAME, Minimal Information About a Microarray Experiment; MAQC, Microarray Quality Control; NCBI, National Center for Biotechnology Information; FDA, Food and Drug Agency; ICH, International Conference on Harmonization; NHGRI, National Human Genome Research Institute.
Ten to 20 years from now, toxicogenomics will likely recognize progress and establishment of uniform technical measure and definition of gene expression events toward exquisite quantitation (i.e., possibly taking advantage of techniques such as laser capture microdissection to look at single cells on platforms for transcript counting, such as NextGen sequencing). The advance in technology will no doubt come with reduced cost per sample for analysis and will enable simultaneous probing of genetic, genomic, proteomic, and metabolomic events. In the regulatory environment, toxicogenomics biomarker data will routinely be used to better inform the risk assessment from in vitro and in vivo test systems. The acceptance of modified test systems will eventually lead to an impact that minimizes animal testing and allows efficient modeling from human in vitro–based assays and ultralow-dose testing of human subjects to extrapolate and inform toxicity predictions. These models will eventually lend way to predictive in silico models that can help reduce use of animals and cost of experiments conducted to assess hazard and risk.
FUNDING
Intramural Research Program of the National Institutes of Health; National Institute of Environmental Health Sciences (Z01 ES102345-04).
Acknowledgments
We thank Drs Rob Kerns and Matthew McElwee for their review of the manuscript. We also thank Drs Weida Tong and Scott Auerbach for their discussion of the manuscript content and Ms Roxanne Audenino for editorial assistance.
References
- Alwine JC, Kemp DJ, Stark GR. Method for detection of specific RNAs in agarose gels by transfer to diazobenzyloxymethyl-paper and hybridization with DNA probes. Proc. Natl. Acad. Sci. U.S.A. 1977;74:5350–5354. doi: 10.1073/pnas.74.12.5350. [DOI] [PMC free article] [PubMed] [Google Scholar]
- Amacher DE, Adler R, Herath A, Townsend RR. Use of proteomic methods to identify serum biomarkers associated with rat liver toxicity or hypertrophy. Clin. Chem. 2005;51:1796–1803. doi: 10.1373/clinchem.2005.049908. [DOI] [PubMed] [Google Scholar]
- Amin RP, Vickers AE, Sistare F, Thompson KL, Roman RJ, Lawton M, Kramer J, Hamadeh HK, Collins J, Grissom S, et al. Identification of putative gene based markers of renal toxicity. Environ. Health Perspect. 2004;112:465–479. doi: 10.1289/ehp.6683. [DOI] [PMC free article] [PubMed] [Google Scholar]
- Bartosiewicz MJ, Jenkins D, Penn S, Emery J, Buckpitt A. Unique gene expression patterns in liver and kidney associated with exposure to chemical toxicants. J. Pharmacol. Exp. Ther. 2001;297:895–905. [PubMed] [Google Scholar]
- Burczynski ME, Dorner AJ. Transcriptional profiling of peripheral blood cells in clinical pharmacogenomic studies. Pharmacogenomics. 2006;7:187–202. doi: 10.2217/14622416.7.2.187. [DOI] [PubMed] [Google Scholar]
- Burczynski ME, McMillian M, Ciervo J, Li L, Parker JB, Dunn RT, II, Hicken S, Farr S, Johnson MD. Toxicogenomics-based discrimination of toxic mechanism in HepG2 human hepatoma cells. Toxicol. Sci. 2000;58:399–415. doi: 10.1093/toxsci/58.2.399. [DOI] [PubMed] [Google Scholar]
- Bushel PR, Hamadeh H, Bennett L, Sieber S, Martin K, Nuwaysir EF, Johnson K, Reynolds K, Paules RS, Afshari CA. MAPS: a microarray project system for gene expression experiment information and data validation. Bioinformatics. 2001;17:564–565. doi: 10.1093/bioinformatics/17.6.564. [DOI] [PubMed] [Google Scholar]
- Bushel PR, Hamadeh HK, Bennett L, Green J, Ableson A, Misener S, Afshari CA, Paules RS. Computational selection of distinct class- and subclass-specific gene expression signatures. J. Biomed. Inform. 2002;35:160–170. doi: 10.1016/s1532-0464(02)00525-7. [DOI] [PubMed] [Google Scholar]
- Bushel PR, Heinloth AN, Li J, Huang L, Chou JW, Boorman GA, Malarkey DE, Houle CD, Ward SM, Wilson RE, et al. Blood gene expression signatures predict exposure levels. Proc. Natl. Acad. Sci. U.S.A. 2007a;104:18211–18216. doi: 10.1073/pnas.0706987104. [DOI] [PMC free article] [PubMed] [Google Scholar]
- Bushel PR, Wolfinger RD, Gibson G. Simultaneous clustering of gene expression data with clinical chemistry and pathological evaluations reveals phenotypic prototypes. BMC Syst. Biol. 2007b;1:15. doi: 10.1186/1752-0509-1-15. [DOI] [PMC free article] [PubMed] [Google Scholar]
- Chee M, Yang R, Hubbell E, Berno A, Huang XC, Stern D, Winkler J, Lockhart DJ, Morris MS, Fodor SP. Accessing genetic information with high-density DNA arrays. Science. 1996;274:610–614. doi: 10.1126/science.274.5287.610. [DOI] [PubMed] [Google Scholar]
- Cheng Y, Church GM. Biclustering of expression data. Proc. Int. Conf. Intell. Syst. Mol. Biol. 2000;8:93–103. [PubMed] [Google Scholar]
- Chou JW, Bushel PR. Discernment of possible mechanisms of hepatotoxicity via biological processes over-represented by co-expressed genes. BMC Genomics. 2009;10:272. doi: 10.1186/1471-2164-10-272. [DOI] [PMC free article] [PubMed] [Google Scholar]
- Chou JW, Zhou T, Kaufmann WK, Paules RS, Bushel PR. Extracting gene expression patterns and identifying co-expressed genes from microarray data reveals biologically responsive processes. BMC Bioinformatics. 2007;8:427. doi: 10.1186/1471-2105-8-427. [DOI] [PMC free article] [PubMed] [Google Scholar]
- Cunningham ML, Lehman-McKeeman L. Applying toxicogenomics in mechanistic and predictive toxicology. Toxicol. Sci. 2005;83:205–206. doi: 10.1093/toxsci/kfi047. [DOI] [PubMed] [Google Scholar]
- Dudoit S, Fridlyand J. A prediction-based resampling method for estimating the number of clusters in a dataset. Genome Biol. 2002;3:36.1–36.21. doi: 10.1186/gb-2002-3-7-research0036. [DOI] [PMC free article] [PubMed] [Google Scholar]
- Eisen MB, Spellman PT, Brown PO, Botstein D. Cluster analysis and display of genome-wide expression patterns. Proc. Natl. Acad. Sci. U.S.A. 1998;95:14863–14868. doi: 10.1073/pnas.95.25.14863. [DOI] [PMC free article] [PubMed] [Google Scholar]
- Ellinger-Ziegelbauer H, Fostel JM, Aruga C, Bauer D, Boitier E, Deng S, Dickinson D, Le Fevre AC, Fornace AJ, Jr, Grenet O, et al. Characterization and interlaboratory comparison of a gene expression signature for differentiating genotoxic mechanisms. Toxicol. Sci. 2009;110:341–352. doi: 10.1093/toxsci/kfp103. [DOI] [PMC free article] [PubMed] [Google Scholar]
- Ellinger-Ziegelbauer H, Stuart B, Wahle B, Bomann W, Ahr HJ. Comparison of the expression profiles induced by genotoxic and nongenotoxic carcinogens in rat liver. Mutat. Res. 2005;575:61–84. doi: 10.1016/j.mrfmmm.2005.02.004. [DOI] [PubMed] [Google Scholar]
- Fielden MR, Nie A, McMillian M, Elangbam CS, Trela BA, Yang Y, Dunn RT, II, Dragan Y, Fransson-Stehen R, Bogdanffy M, et al. Interlaboratory evaluation of genomic signatures for predicting carcinogenicity in the rat. Toxicol. Sci. 2008;103:28–34. doi: 10.1093/toxsci/kfn022. [DOI] [PubMed] [Google Scholar]
- Fostel J, Choi D, Zwickl C, Morrison N, Rashid A, Hasan A, Bao W, Richard A, Tong W, Bushel PR, et al. Chemical effects in biological systems—data dictionary (CEBS-DD): a compendium of terms for the capture and integration of biological study design description, conventional phenotypes, and omics data. Toxicol. Sci. 2005;88:585–601. doi: 10.1093/toxsci/kfi315. [DOI] [PubMed] [Google Scholar]
- Foster WR, Chen SJ, He A, Truong A, Bhaskaran V, Nelson DM, Dambach DM, Lehman-McKeeman LD, Car BD. A retrospective analysis of toxicogenomics in the safety assessment of drug candidates. Toxicol. Pathol. 2007;35:621–635. doi: 10.1080/01926230701419063. [DOI] [PubMed] [Google Scholar]
- Ganter B, Tugendreich S, Pearson CI, Ayanoglu E, Baumhueter S, Bostian KA, Brady L, Browne LJ, Calvin JT, Day GJ, et al. Development of a large-scale chemogenomics database to improve drug candidate selection and to understand mechanisms of chemical toxicity and action. J. Biotechnol. 2005;119:219–244. doi: 10.1016/j.jbiotec.2005.03.022. [DOI] [PubMed] [Google Scholar]
- Goeman JJ, van de Geer SA, de Kort F, van Houwelingen HC. A global test for groups of genes: testing association with a clinical outcome. Bioinformatics. 2004;20:93–99. doi: 10.1093/bioinformatics/btg382. [DOI] [PubMed] [Google Scholar]
- Hamadeh HK, Bushel P, Tucker CJ, Martin K, Paules R, Afshari CA. Detection of diluted gene expression alterations using cDNA microarrays. Biotechniques. 2002a;32 322, 324, 326–329. [PubMed] [Google Scholar]
- Hamadeh HK, Bushel PR, Jayadev S, DiSorbo O, Bennett L, Li L, Tennant R, Stoll R, Barrett JC, Paules RS, et al. Prediction of compound signature using high density gene expression profiling. Toxicol. Sci. 2002b;67:232–240. doi: 10.1093/toxsci/67.2.232. [DOI] [PubMed] [Google Scholar]
- Hamadeh HK, Jayadev S, Gaillard ET, Huang Q, Stoll R, Blanchard K, Chou J, Tucker CJ, Collins J, Maronpot R, et al. Integration of clinical and gene expression endpoints to explore furan-mediated hepatotoxicity. Mutat. Res. 2004;549:169–183. doi: 10.1016/j.mrfmmm.2003.12.021. [DOI] [PubMed] [Google Scholar]
- Hamadeh HK, Knight BL, Haugen AC, Sieber S, Amin RP, Bushel PR, Stoll R, Blanchard K, Jayadev S, Tennant RW, et al. Methapyrilene toxicity: anchorage of pathologic observations to gene expression alterations. Toxicol. Pathol. 2002c;30:470–482. doi: 10.1080/01926230290105712. [DOI] [PubMed] [Google Scholar]
- Hamadeh HK, Todd M, Healy L, Meyer JT, Kwok AM, Higgins M, Afshari CA. Application of genomics for identification of systemic toxicity triggers associated with VEGF-R inhibitors. Chem. Res. Toxicol. 2010;23:1025–1033. doi: 10.1021/tx1000333. [DOI] [PubMed] [Google Scholar]
- Harries HM, Fletcher ST, Duggan CM, Baker VA. The use of genomics technology to investigate gene expression changes in cultured human liver cells. Toxicol. In Vitro. 2001;15:399–405. doi: 10.1016/s0887-2333(01)00043-1. [DOI] [PubMed] [Google Scholar]
- Hayes KR, Vollrath AL, Zastrow GM, McMillan BJ, Craven M, Jovanovich S, Rank DR, Penn S, Walisser JA, Reddy JK, et al. EDGE: a centralized resource for the comparison, analysis, and distribution of toxicogenomic information. Mol. Pharmacol. 2005;67:1360–1368. doi: 10.1124/mol.104.009175. [DOI] [PubMed] [Google Scholar]
- Huang L, Heinloth AN, Zeng ZB, Paules RS, Bushel PR. Genes related to apoptosis predict necrosis of the liver as a phenotype observed in rats exposed to a compendium of hepatotoxicants. BMC Genomics. 2008;9:288. doi: 10.1186/1471-2164-9-288. [DOI] [PMC free article] [PubMed] [Google Scholar]
- Huang Q, Dunn RT, II, Jayadev S, DiSorbo O, Pack FD, Farr SB, Stoll RE, Blanchard KT. Assessment of cisplatin-induced nephrotoxicity by microarray technology. Toxicol. Sci. 2001;63:196–207. doi: 10.1093/toxsci/63.2.196. [DOI] [PubMed] [Google Scholar]
- Hughes TR, Marton MJ, Jones AR, Roberts CJ, Stoughton R, Armour CD, Bennett HA, Coffey E, Dai H, He YD, et al. Functional discovery via a compendium of expression profiles. Cell. 2000;102:109–126. doi: 10.1016/s0092-8674(00)00015-5. [DOI] [PubMed] [Google Scholar]
- Johann DJ, Jr, McGuigan MD, Patel AR, Tomov S, Ross S, Conrads TP, Veenstra TD, Fishman DA, Whiteley GR, Petricoin EF, III, et al. Clinical proteomics and biomarker discovery. Ann. N. Y. Acad. Sci. 2004;1022:295–305. doi: 10.1196/annals.1318.045. [DOI] [PubMed] [Google Scholar]
- Kerr MK, Churchill GA. Experimental design for gene expression microarrays. Biostatistics. 2001;2:183–201. doi: 10.1093/biostatistics/2.2.183. [DOI] [PubMed] [Google Scholar]
- Kondo C, Minowa Y, Uehara T, Okuno Y, Nakatsu N, Ono A, Maruyama T, Kato I, Yamate J, Yamada H, et al. Identification of genomic biomarkers for concurrent diagnosis of drug-induced renal tubular injury using a large-scale toxicogenomics database. Toxicology. 2009;265:15–26. doi: 10.1016/j.tox.2009.09.003. [DOI] [PubMed] [Google Scholar]
- Lobenhofer EK, Cui X, Bennett L, Cable PL, Merrick BA, Churchill GA, Afshari CA. Exploration of low-dose estrogen effects: identification of No Observed Transcriptional Effect Level (NOTEL) Toxicol. Pathol. 2004;32:482–492. doi: 10.1080/01926230490483324. [DOI] [PubMed] [Google Scholar]
- Luhe A, Hildebrand H, Bach U, Dingermann T, Ahr HJ. A new approach to studying ochratoxin A (OTA)-induced nephrotoxicity: expression profiling in vivo and in vitro employing cDNA microarrays. Toxicol. Sci. 2003;73:315–328. doi: 10.1093/toxsci/kfg073. [DOI] [PubMed] [Google Scholar]
- Mattingly CJ, Rosenstein MC, Colby GT, Forrest JN, Jr, Boyer JL. The Comparative Toxicogenomics Database (CTD): a resource for comparative toxicological studies. J. Exp. Zool. A Comp. Exp. Biol. 2006;305:689–692. doi: 10.1002/jez.a.307. [DOI] [PMC free article] [PubMed] [Google Scholar]
- Merrick BA. The plasma proteome, adductome and idiosyncratic toxicity in toxicoproteomics research. Brief Funct. Genomic. Proteomic. 2008;7:35–49. doi: 10.1093/bfgp/eln004. [DOI] [PMC free article] [PubMed] [Google Scholar]
- Miles MF, Hung P, Jungmann RA. Cyclic AMP regulation of lactate dehydrogenase. Quantitation of lactate dehydrogenase M-subunit messenger RNA in isoproterenol-and N6,O2'-dibutyryl cyclic AMP-stimulated rat C6 glioma cells by hybridization analysis using a cloned cDNA probe. J. Biol. Chem. 1981;256:12545–12552. [PubMed] [Google Scholar]
- Miller TJ, Knapton A, Adeyemo O, Noory L, Weaver J, Hanig JP. Cytochrome c: a non-invasive biomarker of drug-induced liver injury. J. Appl. Toxicol. 2008;28:815–828. doi: 10.1002/jat.1347. [DOI] [PubMed] [Google Scholar]
- Minami K, Saito T, Narahara M, Tomita H, Kato H, Sugiyama H, Katoh M, Nakajima M, Yokoi T. Relationship between hepatic gene expression profiles and hepatotoxicity in five typical hepatotoxicant-administered rats. Toxicol. Sci. 2005;87:296–305. doi: 10.1093/toxsci/kfi235. [DOI] [PubMed] [Google Scholar]
- Morgan KT, Pino M, Crosby LM, Wang M, Elston TC, Jayyosi Z, Bonnefoi M, Boorman G. Complementary roles for toxicologic pathology and mathematics in toxicogenomics, with special reference to data interpretation and oscillatory dynamics. Toxicol. Pathol. 2004;32(Suppl. 1):13–25. doi: 10.1080/01926230490424789. [DOI] [PubMed] [Google Scholar]
- Naciff JM, Overmann GJ, Torontali SM, Carr GJ, Khambatta ZS, Tiesman JP, Richardson BD, Daston GP. Uterine temporal response to acute exposure to 17alpha-ethinyl estradiol in the immature rat. Toxicol. Sci. 2007;97:467–490. doi: 10.1093/toxsci/kfm046. [DOI] [PubMed] [Google Scholar]
- National Research Council. 2007. Committee on Applications of Toxicogenomics Technologies to Predictive Toxicology, “Applications of Toxicogenomic Technologies to Predictive Toxicology and Risk Assessment. National Academies Press, Washington DC. [Google Scholar]
- Nuwaysir EF, Bittner M, Trent J, Barrett JC, Afshari CA. Microarrays and toxicology: the advent of toxicogenomics. Mol. Carcinog. 1999;24:153–159. doi: 10.1002/(sici)1098-2744(199903)24:3<153::aid-mc1>3.0.co;2-p. [DOI] [PubMed] [Google Scholar]
- Paules R. Phenotypic anchoring: linking cause and effect. Environ. Health Perspect. 2003;111:A338–A339. doi: 10.1289/ehp.111-a338. [DOI] [PMC free article] [PubMed] [Google Scholar]
- Peddada SD, Lobenhofer EK, Li L, Afshari CA, Weinberg CR, Umbach DM. Gene selection and clustering for time-course and dose-response microarray experiments using order-restricted inference. Bioinformatics. 2003;19:834–841. doi: 10.1093/bioinformatics/btg093. [DOI] [PubMed] [Google Scholar]
- Powell CL, Kosyk O, Ross PK, Schoonhoven R, Boysen G, Swenberg JA, Heinloth AN, Boorman GA, Cunningham ML, Paules RS, et al. Phenotypic anchoring of acetaminophen-induced oxidative stress with gene expression profiles in rat liver. Toxicol. Sci. 2006;93:213–222. doi: 10.1093/toxsci/kfl030. [DOI] [PMC free article] [PubMed] [Google Scholar]
- Prelic A, Bleuler S, Zimmermann P, Wille A, Buhlmann P, Gruissem W, Hennig L, Thiele L, Zitzler E. A systematic comparison and evaluation of biclustering methods for gene expression data. Bioinformatics. 2006;22:1122–1129. doi: 10.1093/bioinformatics/btl060. [DOI] [PubMed] [Google Scholar]
- Sawada H, Takami K, Asahi S. A toxicogenomic approach to drug-induced phospholipidosis: analysis of its induction mechanism and establishment of a novel in vitro screening system. Toxicol. Sci. 2005;83:282–292. doi: 10.1093/toxsci/kfh264. [DOI] [PubMed] [Google Scholar]
- Schena M, Shalon D, Davis RW, Brown PO. Quantitative monitoring of gene expression patterns with a complementary DNA microarray. Science. 1995;270:467–470. doi: 10.1126/science.270.5235.467. [DOI] [PubMed] [Google Scholar]
- Shi L, Campbell G, Jones WD, Campagne F, Wen Z, Walker SJ, Su Z, Chu TM, Goodsaid FM, Pusztai L, et al. The MicroArray Quality Control (MAQC)-II study of common practices for the development and validation of microarray-based predictive models. Nat. Biotechnol. 2010;28:827–838. doi: 10.1038/nbt.1665. [DOI] [PMC free article] [PubMed] [Google Scholar]
- Shi L, Jones WD, Jensen RV, Harris SC, Perkins RG, Goodsaid FM, Guo L, Croner LJ, Boysen C, Fang H, et al. The balance of reproducibility, sensitivity, and specificity of lists of differentially expressed genes in microarray studies. BMC Bioinformatics. 2008;9(Suppl. 9):S10. doi: 10.1186/1471-2105-9-S9-S10. [DOI] [PMC free article] [PubMed] [Google Scholar]
- Southern EM. Detection of specific sequences among DNA fragments separated by gel electrophoresis. J. Mol. Biol. 1975;98:503–517. doi: 10.1016/s0022-2836(75)80083-0. [DOI] [PubMed] [Google Scholar]
- Spellman PT, Sherlock G, Zhang MQ, Iyer VR, Anders K, Eisen MB, Brown PO, Botstein D, Futcher B. Comprehensive identification of cell cycle-regulated genes of the yeast Saccharomyces cerevisiae by microarray hybridization. Mol. Biol. Cell. 1998;9:3273–3297. doi: 10.1091/mbc.9.12.3273. [DOI] [PMC free article] [PubMed] [Google Scholar]
- Steiner G, Suter L, Boess F, Gasser R, de Vera MC, Albertini S, Ruepp S. Discriminating different classes of toxicants by transcript profiling. Environ. Health Perspect. 2004;112:1236–1248. doi: 10.1289/txg.7036. [DOI] [PMC free article] [PubMed] [Google Scholar]
- Tamayo P, Slonim D, Mesirov J, Zhu Q, Kitareewan S, Dmitrovsky E, Lander ES, Golub TR. Interpreting patterns of gene expression with self-organizing maps: methods and application to hematopoietic differentiation. Proc. Natl. Acad. Sci. U.S.A. 1999;96:2907–2912. doi: 10.1073/pnas.96.6.2907. [DOI] [PMC free article] [PubMed] [Google Scholar]
- Tan Y, Shi L, Hussain SM, Xu J, Tong W, Frazier JM, Wang C. Integrating time-course microarray gene expression profiles with cytotoxicity for identification of biomarkers in primary rat hepatocytes exposed to cadmium. Bioinformatics. 2006;22:77–87. doi: 10.1093/bioinformatics/bti737. [DOI] [PubMed] [Google Scholar]
- Tennant RW. The National Center for Toxicogenomics: using new technologies to inform mechanistic toxicology. Environ. Health Perspect. 2002;110:A8–A10. doi: 10.1289/ehp.110-a8. [DOI] [PMC free article] [PubMed] [Google Scholar]
- Tong W, Cao X, Harris S, Sun H, Fang H, Fuscoe J, Harris A, Hong H, Xie Q, Perkins R, et al. ArrayTrack–supporting toxicogenomic research at the U.S. Food and Drug Administration National Center for Toxicological Research. Environ. Health Perspect. 2003;111:1819–1826. doi: 10.1289/ehp.6497. [DOI] [PMC free article] [PubMed] [Google Scholar]
- Uehara T, Hirode M, Ono A, Kiyosawa N, Omura K, Shimizu T, Mizukawa Y, Miyagishima T, Nagao T, Urushidani T. A toxicogenomics approach for early assessment of potential non-genotoxic hepatocarcinogenicity of chemicals in rats. Toxicology. 2008a;250:15–26. doi: 10.1016/j.tox.2008.05.013. [DOI] [PubMed] [Google Scholar]
- Uehara T, Kiyosawa N, Shimizu T, Omura K, Hirode M, Imazawa T, Mizukawa Y, Ono A, Miyagishima T, Nagao T, et al. Species-specific differences in coumarin-induced hepatotoxicity as an example toxicogenomics-based approach to assessing risk of toxicity to humans. Hum. Exp. Toxicol. 2008b;27:23–35. doi: 10.1177/0960327107087910. [DOI] [PubMed] [Google Scholar]
- van Delft JH, van Agen E, van Breda SG, Herwijnen MH, Staal YC, Kleinjans JC. Comparison of supervised clustering methods to discriminate genotoxic from non-genotoxic carcinogens by gene expression profiling. Mutat. Res. 2005;575:17–33. doi: 10.1016/j.mrfmmm.2005.02.006. [DOI] [PubMed] [Google Scholar]
- Wang EJ, Snyder RD, Fielden MR, Smith RJ, Gu YZ. Validation of putative genomic biomarkers of nephrotoxicity in rats. Toxicology. 2008;246:91–100. doi: 10.1016/j.tox.2007.12.031. [DOI] [PubMed] [Google Scholar]
- Wang K, Zhang S, Marzolf B, Troisch P, Brightman A, Hu Z, Hood LE, Galas DJ. Circulating microRNAs, potential biomarkers for drug-induced liver injury. Proc. Natl. Acad. Sci. U.S.A. 2009;106:4402–4407. doi: 10.1073/pnas.0813371106. [DOI] [PMC free article] [PubMed] [Google Scholar]
- Waring JF, Ciurlionis R, Jolly RA, Heindel M, Ulrich RG. Microarray analysis of hepatotoxins in vitro reveals a correlation between gene expression profiles and mechanisms of toxicity. Toxicol. Lett. 2001;120:359–368. doi: 10.1016/s0378-4274(01)00267-3. [DOI] [PubMed] [Google Scholar]
- Waters M, Boorman G, Bushel P, Cunningham M, Irwin R, Merrick A, Olden K, Paules R, Selkirk J, Stasiewicz S, et al. Systems toxicology and the chemical effects in biological systems (CEBS) knowledge base. EHP Toxicogenomics. 2003;111:15–28. [PubMed] [Google Scholar]
- Waters M, Stasiewicz S, Merrick BA, Tomer K, Bushel P, Paules R, Stegman N, Nehls G, Yost KJ, Johnson CH, et al. CEBS–chemical effects in biological systems: a public data repository integrating study design and toxicity data with microarray and proteomics data. Nucleic Acids Res. 2008;36:D892–D900. doi: 10.1093/nar/gkm755. [DOI] [PMC free article] [PubMed] [Google Scholar]
- Watson JD, Crick FH. Molecular structure of nucleic acids; a structure for deoxyribose nucleic acid. Nature. 1953;171:737–738. doi: 10.1038/171737a0. [DOI] [PubMed] [Google Scholar]
- Wolfinger RD, Gibson G, Wolfinger ED, Bennett L, Hamadeh H, Bushel P, Afshari C, Paules RS. Assessing gene significance from cDNA microarray expression data via mixed models. J. Comput. Biol. 2001;8:625–637. doi: 10.1089/106652701753307520. [DOI] [PubMed] [Google Scholar]
- Xirasagar S, Gustafson SF, Huang CC, Pan Q, Fostel J, Boyer P, Merrick BA, Tomer KB, Chan DD, Yost KJ, III, et al. Chemical effects in biological systems (CEBS) object model for toxicology data, SysTox-OM: design and application. Bioinformatics. 2006;22:874–882. doi: 10.1093/bioinformatics/btk045. [DOI] [PubMed] [Google Scholar]
- Xu J, He Y, Qiang B, Yuan J, Peng X, Pan XM. A novel method for high accuracy sumoylation site prediction from protein sequences. BMC Bioinformatics. 2008;9:8. doi: 10.1186/1471-2105-9-8. [DOI] [PMC free article] [PubMed] [Google Scholar]
- Yeung KY, Ruzzo WL. Principal component analysis for clustering gene expression data. Bioinformatics. 2001;17:763–774. doi: 10.1093/bioinformatics/17.9.763. [DOI] [PubMed] [Google Scholar]
- Zidek N, Hellmann J, Kramer PJ, Hewitt PG. Acute hepatotoxicity: a predictive model based on focused illumina microarrays. Toxicol. Sci. 2007;99:289–302. doi: 10.1093/toxsci/kfm131. [DOI] [PubMed] [Google Scholar]