

Abstract
Background. Exposure of renal epithelial cells to oxalate (Ox) or calcium oxalate (CaOx) crystals leads to the production of reactive oxygen species and cell injury. We have hypothesized that Ox and CaOx crystals activate NADPH oxidase through upregulation of its various subunits.
Methods. Human renal epithelial-derived cell line, HK-2, was exposed to 100 μmol Ox or 66.7 μg/cm2 CaOx monohydrate crystals for 6, 12, 24 or 48 h. After exposure, the cells and media were processed to determine activation of NADPH oxidase, production of superoxide and 8-isoprostane (8IP), and release of lactate dehydrogenase (LDH). RT-PCR was performed to determine mRNA expression of NADPH subunits p22phox, p40phox, p47phox, p67phox and gp91phox as well as Rac-GTPase.
Results. Exposure to Ox and CaOx crystals resulted in increase in LDH release, production of 8-IP, NADPH oxidase activity and production of superoxide. Exposure to CaOx crystals resulted in significantly higher NADPH oxidase activity, production of superoxide and LDH release than Ox exposure. Exposure to Ox and CaOx crystals altered the expression of various subunits of NADPH oxidase. More consistent were increases in the expression of membrane-bound p22phox and cytosolic p47phox. Significant and strong correlations were seen between NADPH oxidase activity, the expression of p22phox and p47phox, production of superoxide and release of LDH when cells were exposed to CaOx crystals. The expressions of neither p22phox nor p47phox were significantly correlated with increased NADPH oxidase activity after the Ox exposure.
Conclusions. As hypothesized, exposure to Ox or CaOx crystals leads to significant increases in the expression of p22phox and p47phox, leading to activation of NADPH oxidase. Increased NADPH oxidase activity is associated with increased superoxide production and lipid peroxidation. Different pathways appear to be involved in the stimulation of renal epithelial cells by exposure to Ox and CaOx crystals.
Keywords: calcium oxalate, kidney stones, NADPH oxidase, oxidative stress, p47phox
Introduction
We and others have hypothesized that the formation of calcium oxalate (CaOx) kidneys stones is most likely a result of renal cellular dysfunction and the interaction between the renal cells and oxalate (Ox) and CaOx crystals [1]. Animal model and tissue culture studies have shown that exposure of renal epithelial cells to Ox and/or CaOx crystals leads to protective as well as injurious responses. While transitory exposures to the two result in the production of protective macromolecules, long exposure to higher concentrations is injurious to renal epithelial cells. It is also becoming apparent that both responses are mediated by reactive oxygen species [2]. The generation of large amounts of free radicals plays a major role in tissue injury; however, regulated generation of low concentrations of oxygen radicals may represent a second messenger system of generation of cytokines that are involved in tissue injury and repair in general [3].
Attention is currently focused on NADPH oxidase as a critical determinant of the redox state of the kidney [4,5]. In addition, overstimulation of NADPH oxidase leads to oxidative stress and cell injury [4]. Results of recent studies indicate that NADPH oxidase is involved in the generation of free radicals which may represent a second messenger system for the induction of molecules such as monocyte chemoattractant-1 (MCP-1) and osteopontin (OPN) in renal epithelial cells exposed to COM crystals [6]. Both OPN and MCP-1 are involved in crystal-induced inflammation in various organs including the kidneys. Osteopontin also plays a key role in biomineralization, including kidney stone formation where it modulates crystal nucleation, growth, aggregation and retention within the renal tubules [7,8]. We have already shown that pre-treatment of renal epithelial cells in culture to diphenileneiodium chloride (DPI), an inhibitor of NADPH oxidase, leads not only to a reduction in the production of reactive oxygen species and MCP-1 and OPN but also to Ox- and CaOx crystal-induced cell injury [9]. The outcome of Ox and CaOx crystal exposure on activation of NADPH oxidase and the expression of its various subunits in the renal epithelial cells has, however, not yet been investigated. We decided to investigate this aspect using a human renal epithelial cell line, the HK-2 cells. Previously, we have shown that HK-2 cell exposure to Ox as well as CaOx monohydrate crystals leads to the production of reactive oxygen species and an increase in MCP-1 mRNA expression and synthesis [10,11]. In addition, longer exposure to higher concentrations results in lipid peroxidation and cell injury, which are reduced by antioxidant treatments. We hypothesize that Ox- and CaOx crystal-induced reactive oxygen species are produced by the upregulation of various subunits of NADPH oxidase and its increased activity. Injury is caused by increase in superoxide production and lipid peroxidation.
Materials and methods
Cell culture
Human kidney epithelial-derived cell line, HK-2, was obtained from the American Type Culture Collection (CrL-2190; Manasses, VA, USA). Cells were maintained as continuously growing monolayers in 75-cm2 Falcon T-flask (Fisher, Atlanta, GA, USA) in a culture in 1:1 ratio Dulbecco's modified essential medium nutrient mixture and F-12 (DMEM/F-12, Gibco BRL, Grand Island, NY, USA) containing 4% fetal calf serum, 15 mmol/L HEPES, 20 mmol/L sodium bicarbonate, 0.5 mmol/L sodium pyruvate, 17.5 mmol/L glucose, streptomycin and penicillin at 37°C in a 5% CO2 air atmosphere incubator. Under these conditions, the cells achieved confluence. They were washed with serum and sodium pyruvate-free DMEM/F-12 media. Then, the cells were exposed to potassium oxalate (Ox: 100 μmol; Fisher, Norcross, GA, USA; Cat. # P-273), CaOx monohydrate (COM: 66.7 μg/cm2; BDH Limited, Poole, England; Cat. # 27609). The cells were incubated for 6, 12, 24 and 48 h. The duration of cell exposure and concentration of Ox and COM crystals to which cells were exposed to the selected base on results of earlier studies. The results obtained with 100 μmol Ox and 66.7 μg/cm2 CaOx monohydrate crystals were consistent and proved to be challenging but less injurious in short-term exposure.
After incubation with additives, the cells were collected for detection of NADPH oxidase units and activity. The media were retained for detection of lactate dehydrogenase (LDH) for cell viability, WST-1 for superoxide presence and 8-isoprostane (8-IP) as a marker of lipid peroxidation. Control cultures were untreated cells.
Cell viability—lactate dehydrogenase
The media were aliquoted to designated wells of a 96-well plate (Fisher Scientific, Norcross, GA, USA; Cat. # 21-377-205). The CytoTox 96 Non-Radioactive Cytotoxicity assay kit (Fisher Scientific, Norcross, GA, USA; Promega, Cat. # PR-G1780) was used to determine percent release of LDH. The substrate (supplied with kit) was added to all samples, positive control (cells lysed with lysis solution supplied with kit) and blanks (acclimatization media). The plate was incubated at room temperature for 30 min in the dark. Stop solution (supplied with kit) was added to all samples, positive control and blanks. Optical density absorbency was read at 490 nm on a Bio-Rad 3550 microplate reader (Bio-Rad, Hercules, CA, USA).
Lipid peroxidation—8-isoprostane
Determination of lipid peroxidation was carried out using a kit from Oxford Biomedical Research (Urinary Isoprostane, Cat. # EA84). Briefly, after incubation times to additives to the cells, the media were collected, and 100 μL in duplicate was added to the designated well of a 96-well plate (supplied with kit). One hundred microlitres of standard (supplied by kit), diluted samples and reagent blank (enhanced dilution buffer supplied by kit) was added to designated wells in a 96-well plate (supplied by kit). One hundred microlitres of diluted 15-isoprostane F2t HRP conjugate (supplied by kit) was added to all well, except for the reagent blank. The plate was incubated at room temperature for 2 h. After incubation, the plate was washed three times with wash buffer (supplied by kit). Two hundred microlitres of substrate (supplied by kit) was added to each well and incubated at room temperature for 20–40 min (or until an appreciable blue hue was observed in the standard blank reagent). Three molars of sulphuric acid was added to each well to stop reaction. The plate was then read using a Bio-Rad 3550 microplate reader at 450 nm. The concentration of urinary 8-isoprostane in the sample was calculated by reference to its assay absorbance compared with the standard curve.
Extracellular superoxide dismutase activity—WST-1 assay
Determination of superoxide production was carried out by using an assay by Dojindo Molecular Technologies (Cat. # S311-08, Gaithersburg, MD, USA). Briefly, the media were collected from monolayers and aliquoted into designated wells of a 96-well plate. First, the sample solution (supplied with kit) was added to the samples and blank 1, and then, the WST working solution (supplied with kit) was added to each well and mixed by pipette. Next, the dilution buffer (supplied with kit) was added to the wells of blank 2 and 3. Then, the enzyme working solution (supplied with kit) was added to samples and blank 1 and mixed thoroughly using a plate shaker. The 96-well plate was incubated at 37°C for 20 min and then read at 450 nm using a Bio-Rad 3550 microplate reader. The SOD activity (inhibition rate, %) was calculated using the assays formula (supplied with kit).
NADPH oxidase activity
The assay used to determine NADPH oxidase activity was derived from Rao, PV et al. (Molecular Vision 2004 10:112–21). After incubation with additives, the cells were washed with ice-cold DPBS, scraped off into DPBS with a rubber policeman and collected into 15-mL conical tubes. The samples were centrifuged at 750 g at 4°C for 10 min, and the supernatant was aspirated and resuspended in 2 mL of working Reagent A (potassium phosphate solution with 50 μL of 10 μg/mL aprotinin, 25 μg/mL leupeptin and 1 mM PMSF). Then, the cell suspension was homogenized on ice with a cell homogenizer at 20 strokes. An aliquot of homogenate was added to working Reagent B [50 mM DPBS (Mediatech), 1 mM EGTA, 150 mM sucrose in distilled, deionized water] in 12 × 75-mm polystyrene tubes. The tubes were read using a luminometer. Photoemission expressed in terms of relative light units (RLU) was measured at time zero and every minute for 5 min. The final concentration was calculated as follows: RLU/mg of total protein = OD/mg of total protein at each time interval.
Total RNA isolation
The total RNA was collected using TRIzol (Invitrogen Life Technologies, Carlsbad, CA, USA; Cat. # 15596-018). Briefly, the media were removed from the cells, and TRIzol was added directly to the cell monolayer. The cells were collected in 2-mL microcentrifuge tubes, the chloroform was added, and the tubes were shaken vigorously for 15 s and then incubated at room temperature for 3 min. The tubes were then centrifuged at 12 000 g for 10 min at 4°C. The aqueous layer was carefully collected and transferred to a 1.5-mL microcentrifuge tube. Isopropanol was added to the tube to precipitate the RNA. The samples were incubated at room temperature for 10 min and then centrifuged at 12 000 g for 10 min at 4°C. The supernatant was removed, and the RNA pellet was washed with 70% ethanol. RNA was then dissolved in water and kept at − 80°C until use.
RT-PCR
cDNA was generated using Invitrogen's SuperScript III First-Strand Synthesis System (Carlsbad, CA, USA; Cat. # 18080-051). Briefly, 5 μg of total RNA was added to a 0.5-mL tube with 50 μM Oligo(dT)20, 10 mM dNTP mix, and DEPC-treated water for a final volume of 10 μL. The sample was incubated at 60°C for 5 min and then placed on ice for 1 min. The sample was then added to cDNA Synthesis Mix [10 × RT buffer (supplied with kit), 25 mM MgCl2, 0.1 M DTT, 40 U/μL RNase OUT, 200 U/μL SuperScript III RT] and incubated at 50°C for 50 min. The reaction was terminated by heating at 85°C for 5 min followed by chilling on ice. One microlitre of Rnase H was added to samples and incubated for 20 min at 37°C. After incubation, the samples were ready for use in RT-PCR reaction.
PCR was performed to determine mRNA expression of NADPH oxidase in the cells. The mRNAs of 5 NADPH oxidase subunits, including p22phox, p40phox, p47phox, p67phox and gp91phox, were PCR-amplified and detected using Roche's FastStart High Fidelity PCR System (Indianapolis, IN, USA; Cat. # 03 553 426 001). PCR reactions were performed in a total volume of 50 μL containing 5 μL of FastStart High Fidelity Reaction Buffer with 1.8 mM MgCl2 (supplied with kit), 2 μL DMSO (supplied with kit), 10 mM dNTPs, 8 μL of 0.4 μM upstream and downstream primers, 1 μg of cDNA, and 0.5 μL of 5 U/ μL FastStart High Fidelity Enzyme Blend [20 mM Tris–HCl, 1 mM DTT, 0.1 mM EDTA, 0.1 M KCl, 0.2% Tween 20 (v/v), 50% glycerol (v/v) at pH 9.0]. The reactions were cycled 35 times from 94°C for 1 min to 56°C (for subunits p47phox and gp91phox) or 60°C (for subunits p67phox and p22phox) for 1 min and then 72°C for 1.5 min. The samples were incubated at 72°C for an additional 5 min after the last cycle was completed.
The structures of the primers were as follows: p22phox: sense 5’-CGG GGA AAG AGG AAA AAG and antisense 5’-GGC ACG GAC AGC AGT AAG; p47phox: sense 5’-GCC TGA TGA CCT GAA ACT and antisense 5’-GGC TTC ACC CTC AGA CAG; p67phox: sense 5’-CCC AAA ACC CCA GAA ATC and antisense 5’-CCC ACC GTA TGC TCA CAC; gp91phox: sense 5’-ATG AGG TGG TGA TGT TAG TGG and antisense 5’-AGT TGG AGA TGC TTT GTT TAC; p40phox: sense 5'- -3' and antisense 5'- -3'; RAC-GTPase 5'- -3' and antisense 5'- -3'; and GADPH: sense 5’-GTG AAG GTC GGT GTG AAC GGA TTT and antisense 5’-CAC AGT CTT CTG AGT GGC AGT GAT. All primers were synthesized by Integrated DNA Technologies (Skokie, IL, USA).
PCR products were separated by 2% agarose gel electrophoresis (120 V for 1.5 h) in 1 × TBE buffer, stained with ethidium bromide (0.5 μg/mL) and visualized under ultraviolet light, then photographed using the Stratagene EagleEye Densitometer (La Jolla, CA, USA).
Statistical analysis
Unpaired t-test was used for comparison between two means. P-values < 0.05 denoted the presence of statistically significant difference. Real-time PCR, ELISA, 8-IP, SOD and LDH assay were done for four different samples (n = 4). Correlation coefficient r was obtained using a linear (Pearson) correlation test. Probabilities of P < 0.05 were considered significant.
Results
Expression of NADPH oxidase subunits
There was an initial reduction in the expression of membrane subunits gp91phox and p22phox after the exposures to both the Ox and CaOx crystals (Figure 1A and B). Expression of gp91phox increased after 24-h exposure to Ox, while that of p22phox went up after similar exposure to CaOx crystals. There was no change in the expression of both p22phox and gp91phox in the unexposed control cells for 48 h.
Fig. 1.
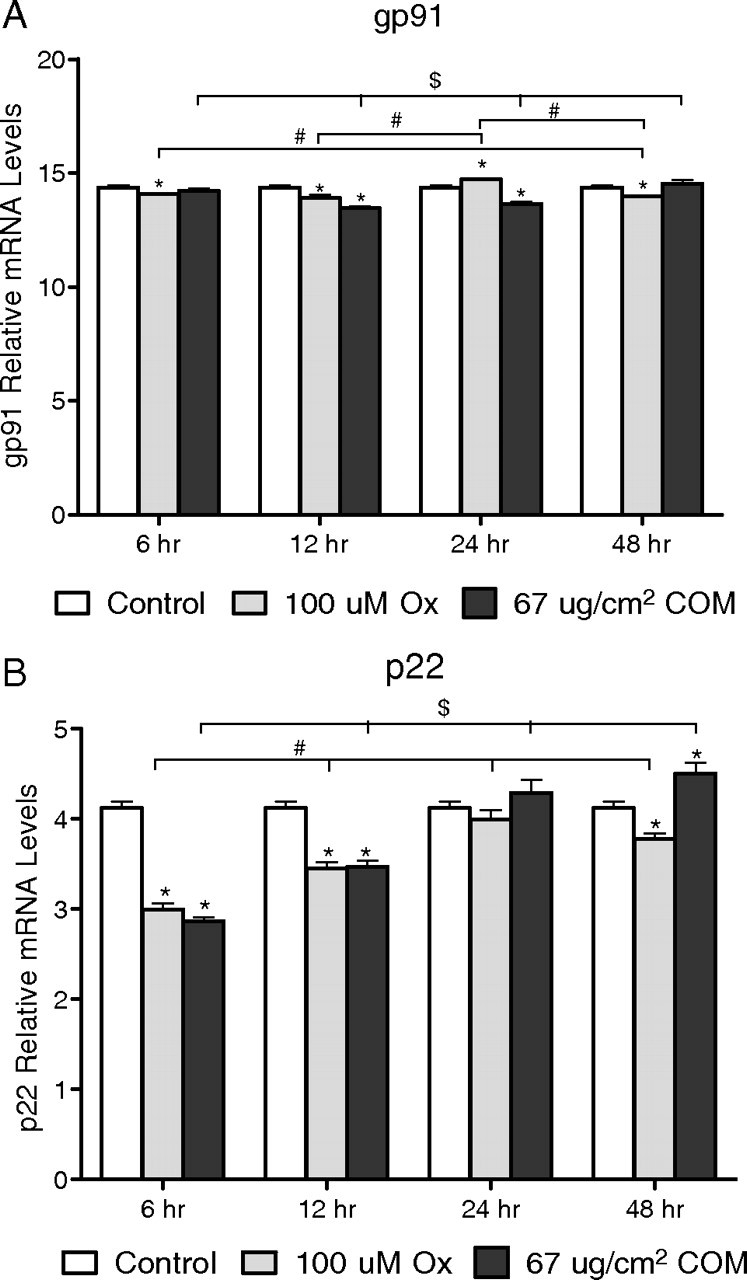
Relative levels of mRNA from real-time PCR of the membrane subunits of NADPH oxidase. Delta C value of membrane-bound subunit gp91phox (A) and p22phox (B).
Expression of cytosolic unit p47phox increased significantly, compared with their respective control, after exposures of 12, 24 or 48 h to both the Ox and CaOx crystals (Figure 2A). There was no change in the expression of p47phox in the unexposed control cells during the experimental period of 48 h. Significant change in the expression of p40phox was seen only after 24 or 48 h of exposure. It increased significantly after 24-h exposure to oxalate and then decreased significantly after 48-h exposure compared with their controls. CaOx crystals exposure for 24 or 48 h, on the other hand, caused a significant decrease in the expression of p40phox (Figure 2B). For other time periods, it was lower in exposed cells than the control cells. Expression of p40phox increased gradually in the unexposed controls reaching significant levels from the baseline after 24 or 48 h. Expression of p67phox similarly increased over time in the unexposed cells reaching significant levels after 12, 24 or 48 h (Figure 2C). p67phox expression increased after 6-h exposure to both the Ox and CaOx crystals. Thereafter, either it stayed the same as in the control or the expression went down except on exposure to CaOx crystals after 12 h of exposure when it increased significantly. The expression of GTPase rac increased significantly in the unexposed cells after 12-, 24- or 48-h exposures (Figure 2D). A similar increase over 6-h exposure was seen after 12-, 24- or 48-h exposure to oxalate. Exposure to CaOx crystals demonstrated mixed responses. A significant increase was seen after 12-h treatment, while a reduction was seen after 24-h exposure.
Fig. 2.

Relative levels of mRNA from real-time PCR of the cytosolic subunits of NADPH oxidase. Delta C values of cytosolic NADPH oxidase subunits p47phox (A), p40phox (B), p67phox (C) and RAC-GTPase (D).
NADPH oxidase activity and production of superoxide
NADPH oxidase activity was determined based on superoxide-induced lucinigen photoemission. Exposure of renal epithelial cells to both the Ox and CaOx crystals resulted in significant increase of lucigenin chemiluminescence measured in RLU (Figure 3) as well as RLU/mg protein. However, there were no significant time-dependent differences in the Ox-induced NADPH oxidase activities. The activity generally stayed the same after 6, 12, 24 or 48 h of Ox exposure. On the other hand, CaOx crystal-induced NADPH oxidase activities not only were higher than those in the control unexposed cells but also increased over time in the exposed cells. The highest significant increase in NADPH oxidase activity was seen after a 12-h exposure to CaOx crystals. CaOx crystal-induced NADPH oxidase activity was significantly higher than Ox-induced activity. The increase in NADPH oxidase activity following an exposure to CaOx crystals was positively and significantly related to changes in the expression of p22phox (r = 0.85, two-tailed P = 0.0005) and p47phox (r = 0.79, two-tailed P = 0.002). No such correlation was seen between NADPH oxidase activity and the expression of either p22phox (r = − 0.042, two-tailed P = 0.897) or p47phox (r = 0.02, two-tailed P = 0.949) when cells were exposed to oxalate.
Fig. 3.

NADPH oxidase production after HK monolayer cells exposed to oxalate (Ox) and CaOx monohydrate (COM) crystals.
Superoxide production was determined indirectly by measuring inhibition of superoxide dismutase activity in the medium after cellular exposure to Ox or CaOx crystals. Exposure to both the Ox and CaOx crystals resulted in increased superoxide production (Figure 4). However, the amounts produced after the two different exposures were different at different times. By 48 h, however, there was no significant difference in SOD production by cells exposed to Ox or CaOx crystals. There was a significant correlation between NADPH oxidase and superoxide production (r = 0.61, two-tailed P = 0.012) when cells were exposed to CaOx crystals. No correlation was seen when cells were exposed to oxalate alone (r = − 0.46, P = 0.129).
Fig. 4.

Effect of oxalate (Ox) and CaOx monohydrate (COM) crystals on HK-2 monolayer demonstrating extracellular production of SOD through conversion of WST-1 (2-(4-iodophenyl)- 3-(4-nitrophenyl)-5-(2,4-disulpho-phenyl)-2 H-tetrazolium, monosodium salt) to a water-soluble formazan dye upon reduction with a superoxide anion.
Lipid peroxidation and cell injury
Exposure to Ox as well as CaOx crystals also resulted in increased production of 8-isoprostane (Figure 5). The increase in the amount of 8-IP in the medium following exposure to Ox was also time-dependent. It increased significantly after exposure from 6 to 12 to 24 h. After 48 h, however, there was significantly reduced 8-IP production compared with 12- and 24-h exposures, but was still higher than the control levels. Exposure to CaOx crystals on the other hand resulted in increased production of 8-IP but only until 12 h. Subsequently, there was no increase in the production of 8-IP for the next 12 h, and then, the production showed a dramatic reduction after 48 h of exposure, ultimately reaching control levels. The controls did not show any significant change in 8-IP production over time. The correlation between NADPH oxidase activity and production of 8-IP was not significant when cells were exposed to CaOx crystals (r = 0.36, two-tailed P = 0.174) and slightly so when exposed to oxalate (r = 0.58, two-tailed P = 0.048).
Fig. 5.

Effect of oxalate (Ox) and CaOx monohydrate (COM) crystals on HK-2 monolayer exhibiting cellular membrane injury through lipid peroxidation (8-IP).
Exposure of the HK-2 renal epithelial cells to both Ox and CaOx crystals resulted in the release of LDH into the medium, significantly more than in the controls (Figure 6). The release of LDH was time-dependent, i.e. more LDH was released after longer exposure, with the maximum after 48 h, the longest exposure in our studies. Exposure to CaOx crystals led to the release of significantly more LDH into the medium than exposure to Ox. Interestingly, even in the controls, there was a significant increase in LDH release over time. There was a significant correlation between NADPH oxidase activity and LDH release when cells were exposed to oxalate (r = 0.69, two-tailed P = 0.0136) or CaOx crystals (r = 0.84, two-tailed P = 0.0007).
Fig. 6.

Effect of oxalate (Ox) and CaOx monohydrate crystals (COM) on HK-2 monolayer exhibiting cellular membrane injury through lactate dehydrogenase (LDH) release.
Discussion
Hyperoxaluria is a major risk factor, and crystals of CaOx are the major constituents of most idiopathic urinary stones [7]. Clinical as well as experimental studies have provided evidence that CaOx crystals and high Ox concentration are injurious to renal epithelial cells, and that the injury is most likely associated with the production of excessive amounts of reactive oxygen species and the development of oxidative stress in the kidneys [12]. Urine from stone patients had increased NAG and significantly higher α-glutathione S-transferase (α-GST), malondialdehyde (MDA) and thiobarbituric acid-reactive substances (TBARS), indicating that CaOx kidney stone-associated renal injury is most likely caused by the production of reactive oxygen species [13]. Urinary 8-hydroxydeoxyguanosine (8-OHdG), a marker of oxidative damage of DNA, was increased in stone patients and was positively correlated with tubular damage as assessed by urinary excretion of NAG [14]. All major markers of chronic inflammation including proinflammatory cytokines, adhesion molecules, microalbumin, myeloperoxidase, 8-OHdG, 3-nitrotyrosine and monocyte chemoattractant protein (MCP-1) were detectable in patients with renal stones [15]. Rats with experimentally induced hyperoxaluria showed increased urinary excretion of lipid peroxides in association with LDH. Support for the involvement of oxidative stress in CaOx nephrolithiasis was also provided by treating the hyperoxaluric rats with antioxidants. Administration of vitamin E to the hyperoxaluric rats resulted in the amelioration of their renal tubular injury and reduction in CaOx crystal deposition [16,17]. Taurine treatment of the hyperoxaluric rats improved antioxidant status and resulted in a reduction of CaOx crystal deposition in the kidneys [18]. A reduction in renal epithelial injury and CaOx crystal deposition was also seen in hyperoxaluric rats treated with atorvastatin [19]. Renal cells exposed to CaOx crystals secrete superoxide in real time as measured by an electrochemical superoxide biosensor [20]. The presence of antioxidants produced a significant reduction in cell injury and improved the antioxidant status of the cells when exposed to oxalate or CaOx or CaP crystals [2]. Renal fibroblasts are also stimulated by the exposures to Ox and CaOx crystals. NRK49F exposed to Ox or CaOx crystals showed signs of injury and ROS-induced lipid peroxidation [21].
Major cellular ROS include superoxide anion (O2 −•), nitric oxide radical (NO•), hydroxyl radical (OH•) and hydrogen peroxide (H2O2), which are generated by several pathways. O2 −• anions are produced by NADPH oxidases, xanthine oxidase, lipooxigenase, cyclooxygenase and hemeoxygenase and as a by-product of mitochondrial respiratory chain. Both mitochondria and NADPH appear to be involved in the production of reactive oxygen species during renal epithelial exposure to high Ox and/or CaOx crystals [12]. Investigations using selective probes, substrates and inhibitors have shown that mitochondria play an important role in the production of CaOx crystal-induced superoxide production and glutathione depletion in both LLC-PK1 and MDCK cells [22]. In vivo CaOx crystal deposition in the kidneys correlates with depletion of mitochondrial glutathione [23]. Furthermore, the exposure to Ox caused a decrease in mitochondrial membrane potential in MDCK cells [24]. Isolated mitochondria responded to oxalate exposure by the accumulation of ROS, lipid peroxides and oxidized thiol proteins [25].
NADPH oxidase is a major source of ROS in the kidneys [26,27], particularly in the presence of angiotensin II [28]. Angiotensin II is implicated in causing oxidative stress by stimulating membrane-bound NAD(P)H oxidase leading to increased generation of superoxide [29]. A significant reduction in hyperoxaluria-induced production of renal lipid peroxides after administration of AT 1 receptor blockers [30] or ACE inhibitors [31] was seen in hyperoxaluric rats. In addition, these treatments produced a reduction in TGF-β expression in the kidneys. TGF-β has been shown to participate in ROS production through the activation of NADPH oxidase. Ox-induced activation of NADPH oxidase in LLC-PK1 cells was associated with increased production of TGF-β1. Treatment with neutralizing TGF-β antibodies significantly reduced the generation of ROS [32]. Oxalate-induced injury of NRK52E cells was also significantly reduced in the presence of diphenyleneiodonium chloride (DPI), an NADPH oxidase inhibitor [9]. Prior incubation with 10 − 6 M DPI resulted in a reduction of oxalate as well as CaOx and brushite crystal-induced LDH release, and the production of H2O2 and 8-isoprostane. In addition, DPI reduced both CaOx- and brushite crystal-induced gene expression and the production of MCP-1. Our previous study also demonstrated that DPI and catalase, a free radical scavenger, caused similar reductions in LDH release and production of H2O2 and 8-isoprostane as well as MCP-1 gene expression and protein production. Ox activates NADPH oxidase by increasing PKC activity [33].
Reduction in ROS production and injury by DPI treatment, as well as ACE inhibitors, suggests an involvement of NADPH oxidase in the Ox- and CaOx crystal-induced cell injury. Since DPI as well as apocynin can act through many pathways, we decided to investigate the actual changes in the enzyme and its activity. NADPH oxidase consists of six subunits, the two transmembrane units, p22phox and gp91phox; and four cytosolic units, p47phox, p67phox, p40phox and the small GTPase rac1 or rac2. The two transmembrane units, gp91phox and p22phox, associate with a flavin to make cytochrome b558. The gp91phox unit is the core catalytic component for the electron transfer activity, while p22phox has regulatory and stabilizing functions. Cytosolic units translocate to the membrane and assemble with the cytochrome to activate the enzyme. Several homologues of gp91phox have been recognized. The NADPH oxidase enzyme transfers electrons to molecular O2 via the flavin-containing subunit. Gp91phox and the homologues Nox1 and Nox4 have been identified as the electron-transferring subunit. Nox4 with 39% sequence identity to gp91phox, often called renal oxidase or renox, has high expression in various segments of the renal tubules and high constitutive activity [5].
These results indicate that the HK-2 human renal epithelial cell line expresses all subunits of NADPH oxidase. There was no change in the mRNA expression of gp91phox, p22phox and p47phox in the controls from 6 to 48 h, while the expression of other subunits increased gradually as the culture aged. A significant reduction in the expression of p22phox after 6-h exposure to both Ox and CaOx crystals was followed by a gradual increase to control levels. A less striking reduction and recovery was seen in the expression of gp91phox. Both these units are situated in the membrane, and changes in the expression of their mRNA may indicate initial membrane involvement in cell response. Even though expression of all cytosolic units changed over time in both the control and treated cells, p47phox expression showed a significant increase over control for all time periods. Previously, we examined changes in the expression of p47phox in NRK52 E cells exposed to CaOx crystals in the presence or absence of DPI. Cells exposed to crystals showed enhanced expression of p47phox, which was reduced following DPI treatment [6]. Docking of p47phox and other cytosolic units with the cytochrome activates NADPH oxidase. This docking is inhibited by DPI and apocynin. DPI as well as apocynin treatment has also been shown to reduce oxalate-induced production of ROS by LLC-PK1 cells. That p47phox is activated when renal epithelial cells are exposed to high Ox and CaOx crystals have also been indicated by the observations that administration of apocynin to hyperoxaluric rats is associated with reduced p47phox expression in the kidneys and significantly reduced urinary excretion of 8-IP.
Both p22phox and p47phox have been shown to be involved in the development of oxidative stress in a number of other animal models of diseases with renal involvement [4,34]. Enhanced renal expression of p47phox, gp91phox and p22phox has been seen in the kidneys of diabetic humans [35] or animals [34,36]. Expression of gp91phox and p22phox in parallel with 8-hydroxy-deoxyguanosine was increased in the kidneys of streptozotocin-induced diabetes in rats [37]. Apocynin treatment prevented the development of diabetic nephropathy in a rat model [4]. Activation of NADPH oxidase also plays a part in renal damage and dysfunction in salt-sensitive hypertension. Renal medullary p22phox and p47phox were elevated in salt-sensitive rats than consomic salt-tolerant ones [38], and expression of p47phox and gp91phox was increased in renal cortex of the Sprague–Dawley rats [39]. Apocynin treatment of salt-sensitive rats on high salt not only lowered the expression of p47phox, p67phox, gp91phox and p22phox but also reduced NADPH activity and superoxide production as well as glomerular and interstitial damage [40].
The results of the current study show that exposure to Ox and CaOx crystals is associated with not only an increase in LDH release and production of 8-IP, as previously demonstrated, but also increased NADPH oxidase activity and production of superoxide. In general, exposure to CaOx crystals resulted in significantly higher NADPH oxidase activity, production of superoxide and LDH release than Ox exposure. The results of 8-IP are, however, ambiguous. As hypothesized, exposure to Ox and CaOx crystals affected the expression of various subunits of NADPH oxidase. More consistent were increases in the expression of membrane-bound p22phox and cytosolic p47phox from 6 to 48 h after exposures to Ox or CaOx crystals. Increased NADPH activity preceded the upregulation of p22phox and p47phox, because initial activation is accomplished through assembly of the existing subunits. Significant and strong correlations were seen between NADPH oxidase activity, the expression of p22phox and p47phox, production of superoxide and release of LDH when cells were exposed to CaOx crystals. The expressions of neither p22phox nor p47phox were significantly correlated with increased NADPH oxidase activity after the Ox exposure. The divergence may indicate that more than one pathway is involved. Ox and CaOx crystals appear to be stimulating different pathways.
Acknowledgments
This research is supported by NIH grant no. RO1-DK078602 and the University of Florida Center for the Study of Lithiasis.
Conflict of interest statement. None declared.
References
- 1.Khan SR. Renal tubular damage/dysfunction: key to the formation of kidney stones. Urol Res. 2006;34:86–91. doi: 10.1007/s00240-005-0016-2. [DOI] [PubMed] [Google Scholar]
- 2.Khan SR. Hyperoxaluria-induced oxidative stress and antioxidants for renal protection. Urol Res. 2005;33:349–357. doi: 10.1007/s00240-005-0492-4. [DOI] [PubMed] [Google Scholar]
- 3.Thannickal VJ, Fanburg BL. Reactive oxygen species in cell signaling. Am J Physiol Lung Cell Mol Physiol. 2000;279:L1005–L1028. doi: 10.1152/ajplung.2000.279.6.L1005. [DOI] [PubMed] [Google Scholar]
- 4.Gill PS, Wilcox CS. NADPH oxidases in the kidney. Antioxid Redox Signal. 2006;8:1597–1607. doi: 10.1089/ars.2006.8.1597. [DOI] [PubMed] [Google Scholar]
- 5.Shiose A, Kuroda J, Tsuruya K, et al. A novel superoxide-producing NAD(P)H oxidase in kidney. J Biol Chem. 2001;276:1417–1423. doi: 10.1074/jbc.M007597200. [DOI] [PubMed] [Google Scholar]
- 6.Umekawa T, Tsuji H, Uemura H, et al. Superoxide from NADPH oxidase as second messenger for the expression of osteopontin and monocyte chemoattractant protein-1 in renal epithelial cells exposed to calcium oxalate crystals. BJU Int. 2009;104:115–120. doi: 10.1111/j.1464-410X.2009.08374.x. [DOI] [PMC free article] [PubMed] [Google Scholar]
- 7.Khan SR, Kok DJ. Modulators of urinary stone formation. Front Biosci. 2004;9:1450–1482. doi: 10.2741/1347. [DOI] [PubMed] [Google Scholar]
- 8.Wesson JA, Johnson RJ, Mazzali M, et al. Osteopontin is a critical inhibitor of calcium oxalate crystal formation and retention in renal tubules. J Am Soc Nephrol. 2003;14:139–147. doi: 10.1097/01.asn.0000040593.93815.9d. [DOI] [PubMed] [Google Scholar]
- 9.Umekawa T, Byer K, Uemura H, et al. Diphenyleneiodium (DPI) reduces oxalate ion- and calcium oxalate monohydrate and brushite crystal-induced upregulation of MCP-1 in NRK 52E cells. Nephrol Dial Transplant. 2005;20:870–878. doi: 10.1093/ndt/gfh750. [DOI] [PubMed] [Google Scholar]
- 10.Habibzadegah-Tari P, Byer K, Khan SR. Oxalate induced expression of monocyte chemoattractant protein-1 (MCP-1) in HK-2 cells involves reactive oxygen species. Urol Res. 2005;33:440–447. doi: 10.1007/s00240-005-0505-3. [DOI] [PubMed] [Google Scholar]
- 11.Habibzadegah-Tari P, Byer KG, Khan SR. Reactive oxygen species mediated calcium oxalate crystal-induced expression of MCP-1 in HK-2 cells. Urol Res. 2006;34:26–36. doi: 10.1007/s00240-005-0007-3. [DOI] [PubMed] [Google Scholar]
- 12.Khan SR. Crystal-induced inflammation of the kidneys: results from human studies, animal models, and tissue-culture studies. Clin Exp Nephrol. 2004;8:75–88. doi: 10.1007/s10157-004-0292-0. [DOI] [PubMed] [Google Scholar]
- 13.Huang HS, Ma MC, Chen CF, et al. Lipid peroxidation and its correlations with urinary levels of oxalate, citric acid, and osteopontin in patients with renal calcium oxalate stones. Urology. 2003;62:1123–1128. doi: 10.1016/s0090-4295(03)00764-7. [DOI] [PubMed] [Google Scholar]
- 14.Boonla C, Wunsuwan R, Tungsanga K, et al. Urinary 8-hydroxydeoxyguanosine is elevated in patients with nephrolithiasis. Urol Res. 2007;35:185–191. doi: 10.1007/s00240-007-0098-0. [DOI] [PubMed] [Google Scholar]
- 15.Tsao KC, Wu TL, Chang PY, et al. Multiple risk markers for atherogenesis associated with chronic inflammation are detectable in patients with renal stones. J Clin Lab Anal. 2007;21:426–431. doi: 10.1002/jcla.20215. [DOI] [PMC free article] [PubMed] [Google Scholar]
- 16.Huang HS, Chen J, Chen CF, et al. Vitamin E attenuates crystal formation in rat kidneys: roles of renal tubular cell death and crystallization inhibitors. Kidney Int. 2006;70:699–710. doi: 10.1038/sj.ki.5001651. [DOI] [PubMed] [Google Scholar]
- 17.Thamilselvan S, Menon M. Vitamin E therapy prevents hyperoxaluria-induced calcium oxalate crystal deposition in the kidney by improving renal tissue antioxidant status. BJU Int. 2005;96:117–126. doi: 10.1111/j.1464-410X.2005.05579.x. [DOI] [PubMed] [Google Scholar]
- 18.Li CY, Deng YL, Sun BH. Taurine protected kidney from oxidative injury through mitochondrial-linked pathway in a rat model of nephrolithiasis. Urol Res. 2009;37:211–220. doi: 10.1007/s00240-009-0197-1. [DOI] [PubMed] [Google Scholar]
- 19.Tsujihata M, Momohara C, Yoshioka I, et al. Atorvastatin inhibits renal crystal retention in a rat stone forming model. J Urol. 2008;180:2212–2217. doi: 10.1016/j.juro.2008.07.024. [DOI] [PubMed] [Google Scholar]
- 20.Gaspar S, Niculite C, Cucu D, et al. Effect of calcium oxalate on renal cells as revealed by real-time measurement of extracellular oxidative burst. Biosens Bioelectron. 2010;25:1729–1734. doi: 10.1016/j.bios.2009.12.013. [DOI] [PubMed] [Google Scholar]
- 21.Umekawa T, Iguchi M, Uemura H, et al. Oxalate ions and calcium oxalate crystal-induced up-regulation of osteopontin and monocyte chemoattractant protein-1 in renal fibroblasts. BJU Int. 2006;98:656–660. doi: 10.1111/j.1464-410X.2006.06334.x. [DOI] [PubMed] [Google Scholar]
- 22.Khand FD, Gordge MP, Robertson WG, et al. Mitochondrial superoxide production during oxalate-mediated oxidative stress in renal epithelial cells. Free Radic Biol Med. 2002;32:1339–1350. doi: 10.1016/s0891-5849(02)00846-8. [DOI] [PubMed] [Google Scholar]
- 23.Meimaridou E, Lobos E, Hothersall JS. Renal oxidative vulnerability due to changes in mitochondrial-glutathione and energy homeostasis in a rat model of calcium oxalate urolithiasis. Am J Physiol Renal Physiol. 2006;291:F731–F740. doi: 10.1152/ajprenal.00024.2006. [DOI] [PubMed] [Google Scholar]
- 24.Meimaridou E, Jacobson J, Seddon AM, et al. Crystal and microparticle effects on MDCK cell superoxide production: oxalate-specific mitochondrial membrane potential changes. Free Radic Biol Med. 2005;38:1553–1564. doi: 10.1016/j.freeradbiomed.2005.02.020. [DOI] [PubMed] [Google Scholar]
- 25.Cao LC, Honeyman TW, Cooney R, et al. Mitochondrial dysfunction is a primary event in renal cell oxalate toxicity. Kidney Int. 2004;66:1890–1900. doi: 10.1111/j.1523-1755.2004.00963.x. [DOI] [PubMed] [Google Scholar]
- 26.Geiszt M, Kopp JB, Varnai P, et al. Identification of renox, an NAD(P)H oxidase in kidney. Proc Natl Acad Sci USA. 2000;97:8010–8014. doi: 10.1073/pnas.130135897. [DOI] [PMC free article] [PubMed] [Google Scholar]
- 27.Li N, Yi FX, Spurrier JL, et al. Production of superoxide through NADH oxidase in thick ascending limb of Henle's loop in rat kidney. Am J Physiol Renal Physiol. 2002;282:F1111–F1119. doi: 10.1152/ajprenal.00218.2001. [DOI] [PubMed] [Google Scholar]
- 28.Hanna IR, Taniyama Y, Szocs K, et al. NAD(P)H oxidase-derived reactive oxygen species as mediators of angiotensin II signaling. Antioxid Redox Signal. 2002;4:899–914. doi: 10.1089/152308602762197443. [DOI] [PubMed] [Google Scholar]
- 29.Wilcox CS, Welch WJ. Oxidative stress: cause or consequence of hypertension. Exp Biol Med (Maywood) 2001;226:619–620. doi: 10.1177/153537020222600702. [DOI] [PubMed] [Google Scholar]
- 30.Umekawa T, Hatanaka Y, Kurita T, et al. Effect of angiotensin II receptor blockage on osteopontin expression and calcium oxalate crystal deposition in rat kidneys. J Am Soc Nephrol. 2004;15:635–644. doi: 10.1097/01.asn.0000113321.49771.2d. [DOI] [PubMed] [Google Scholar]
- 31.Toblli JE, Ferder L, Stella I, et al. Protective role of enalapril for chronic tubulointerstitial lesions of hyperoxaluria. J Urol. 2001;166:275–280. [PubMed] [Google Scholar]
- 32.Rashed T, Menon M, Thamilselvan S. Molecular mechanism of oxalate-induced free radical production and glutathione redox imbalance in renal epithelial cells: effect of antioxidants. Am J Nephrol. 2004;24:557–568. doi: 10.1159/000082043. [DOI] [PubMed] [Google Scholar]
- 33.Thamilselvan V, Menon M, Thamilselvan S. Oxalate-induced activation of PKC-alpha and -delta regulates NADPH oxidase-mediated oxidative injury in renal tubular epithelial cells. Am J Physiol Renal Physiol. 2009;297:F1399–F1410. doi: 10.1152/ajprenal.00051.2009. [DOI] [PMC free article] [PubMed] [Google Scholar]
- 34.Asaba K, Tojo A, Onozato ML, et al. Effects of NADPH oxidase inhibitor in diabetic nephropathy. Kidney Int. 2005;67:1890–1898. doi: 10.1111/j.1523-1755.2005.00287.x. [DOI] [PubMed] [Google Scholar]
- 35.Li JM, Shah AM. ROS generation by nonphagocytic NADPH oxidase: potential relevance in diabetic nephropathy. J Am Soc Nephrol. 2003;14:S221–S226. doi: 10.1097/01.asn.0000077406.67663.e7. [DOI] [PubMed] [Google Scholar]
- 36.Onozato ML, Tojo A, Goto A, et al. Oxidative stress and nitric oxide synthase in rat diabetic nephropathy: effects of ACEI and ARB. Kidney Int. 2002;61:186–194. doi: 10.1046/j.1523-1755.2002.00123.x. [DOI] [PubMed] [Google Scholar]
- 37.Etoh T, Inoguchi T, Kakimoto M, et al. Increased expression of NAD(P)H oxidase subunits, NOX4 and p22phox, in the kidney of streptozotocin-induced diabetic rats and its reversibity by interventive insulin treatment. Diabetologia. 2003;46:1428–1437. doi: 10.1007/s00125-003-1205-6. [DOI] [PubMed] [Google Scholar]
- 38.Taylor NE, Glocka P, Liang M, et al. NADPH oxidase in the renal medulla causes oxidative stress and contributes to salt-sensitive hypertension in Dahl S rats. Hypertension. 2006;47:692–698. doi: 10.1161/01.HYP.0000203161.02046.8d. [DOI] [PubMed] [Google Scholar]
- 39.Kitiyakara C, Chabrashvili T, Chen Y, et al. Salt intake, oxidative stress, and renal expression of NADPH oxidase and superoxide dismutase. J Am Soc Nephrol. 2003;14:2775–2782. doi: 10.1097/01.asn.0000092145.90389.65. [DOI] [PubMed] [Google Scholar]
- 40.Tian N, Moore RS, Phillips WE, et al. NADPH oxidase contributes to renal damage and dysfunction in Dahl salt-sensitive hypertension. Am J Physiol Regul Integr Comp Physiol. 2008;295:R1858–R1865. doi: 10.1152/ajpregu.90650.2008. [DOI] [PMC free article] [PubMed] [Google Scholar]