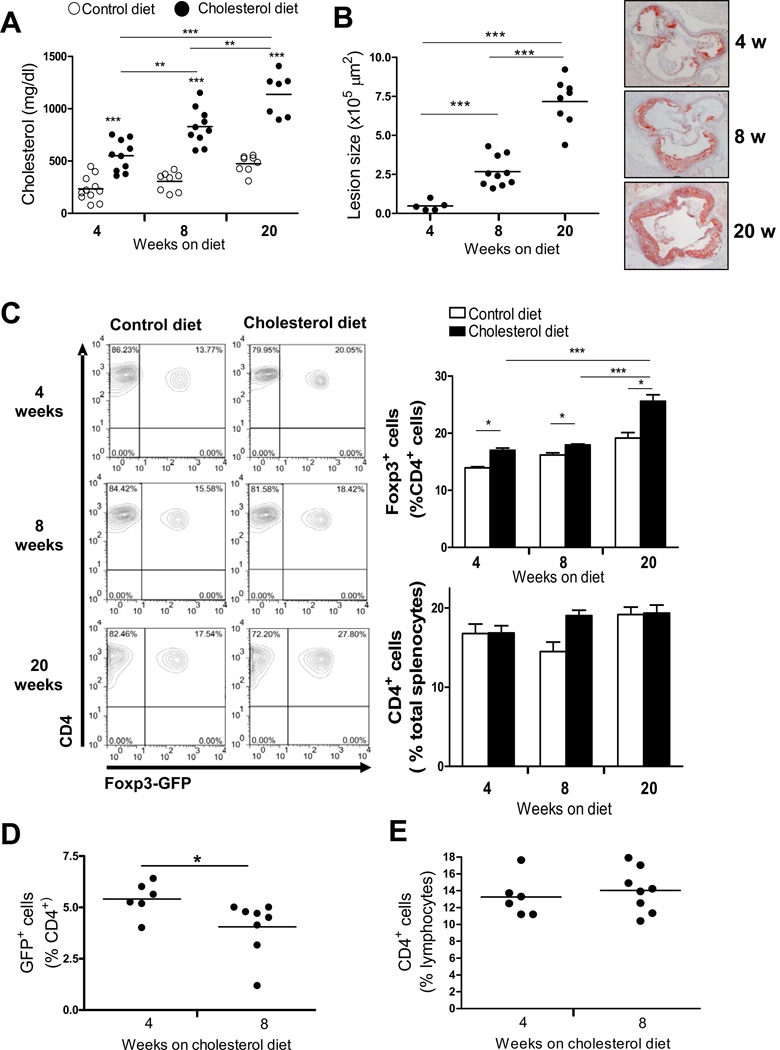
Figure 1. Splenic and circulating Treg numbers change under prolonged hypercholesterolemia.
A, Foxp3-eGFP+/Ldlr−/− mice (total 63) were fed a control or cholesterol rich diet and sacrificed after 4, 8 and 20 weeks on diet. Total cholesterol levels were measured in serum. B, Aortic root atherosclerotic lesions were quantified by analysis of ORO stained sections. A representative section from each group is also shown. C, Splenocytes were stained for CD4 and the percent of CD4+ cells dthat were GFP+ cells was determined by FACS. Horizontal bars and column heights represent the mean for each group. Error bars represent S.E.M.. N=6–10 mice per group. Each symbol in A and B represents one mouse. * P <0.05, ** P<0.01, *** P<0.001, analyzed by two way ANOVA with Bonferroni post test (A) or one way ANOVA with Tukey’s post test (B). In a separate experiment, Foxp3-eGFP+/Ldlr−/− mice (14 total) were fed a cholesterol rich diet and sacrificed after 4 and 8 weeks, and blood leukocytes were stained for CD4, and analyzed by FACS. D, The percent of CD4+ cells that were GFP+ is shown. E, the % total lymphocytes by scatter that were CD4+ is shown. Data are mean +/− S.E.M., N=6–8 mice per group. * P <0.05, analyzed by Students t test. Each symbol in D and E represents one mouse.

