

Abstract
Virtual screening of small molecule databases against macromolecular targets was used to identify binding ligands and predict their lowest energy bound conformation (i.e., pose). AutoDock4- generated poses were rescored using mean-field pathway decoupling free energy of binding calculations and evaluated if these calculations improved virtual screening discrimination between bound and non-bound ligands. Two small molecule databases were used to evaluate the effectiveness of the rescoring algorithm in correctly identifying binders of L99A T4 lysozyme. Self-dock calculations of a database containing compounds with known binding free energies and co-crystal structures largely reproduced experimental measurements, although the mean difference between calculated and experimental binding free energies increased as the predicted bound poses diverged from the experimental poses. In addition, free energy rescoring was more accurate than AutoDock4 scores in discriminating between known binders and non-binders, suggesting free energy rescoring could be a useful approach to reduce false positive predictions in virtual screening experiments.
INTRODUCTION
Structure-based virtual screening of chemical databases against macromolecular targets has identified bioactive compounds for the potential treatment of diseases such as dengue fever,1 cancer,2–4 bacterial infections,5, 6 inflammation,7 depression,8 and diabetes.9 Virtual screening approaches systematically utilize docking programs (e.g., EUDOC,10 Dock,11 Glide,12 GOLD,13 FlexX,14 AutoDock415) to predict a small molecule’s lowest “energy” conformation and orientation (i.e., pose) when bound to a macromolecular binding site. The energy scoring function in conventional docking programs typically sums empirically-derived terms meant to describe intramolecular conformational energies and non-bonding interaction energies between the ligand and macromolecular target.16–20 The degree to which the empirical energy function represents the observed free energy of binding (FEB) influences the accuracy of the relative energy difference between bound potential ligands, and therefore the correct identification of molecules that bind to the macromolecular target. Recent comparative evaluations of several widely used docking programs concluded that no docking program showed a significant performance advantage with respect to pose accuracy and chemical database enrichment.21–24 Moreover, the pose accuracies of each docking program were dependent on the protein target and no program had a significant advantage in terms of accurate pose predictions for all tested proteins. Encouragingly, the lowest energy docking pose of many programs typically differed from the known co-crystal structure by 1–2 Å root-mean-square deviation (rmsd).21–24 In contrast, docking energy scores generally had poor agreements to experimental FEB, and were often biased by molecular weight, functional groups, and/or number of intermolecular contacts.21–24
Consensus25, 26 and weighting27 score methods have attempted to correct inaccuracies and bias in docking energy scores. However, significant errors persist in the docking scores due to incomplete enumeration of conformational states, inexact treatment of solvent and entropy contributions, and empirical parameterization of enthalpic energy terms. Thus, contemporary virtual screening calculations have high false positive rates that necessitate time-consuming laboratory validation to identify active (i.e., true positive) compounds from large numbers of false positive predictions.
In principle, the FEB between a ligand and protein can be accurately calculated from rigorous statistical mechanical (SM) theory.17, 28 Both endpoint and pathway algorithms have been developed to efficiently perform SM-FEB calculations. End point methods (e.g., linear interaction energy [LIE],29 molecular mechanics Poisson-Boltzmann-and-surface-area [MM-PBSA]30) compute FEB from the difference between unique states, whereas pathway methods (e.g., alchemical pathways,31 annihilation,32 intermolecular interaction decoupling33) incrementally transfer a ligand-protein system between states and integrate energies along the transfer path to calculate FEB. Recent mean-field pathway decoupling FEB calculations34–36 that used co-crystal structures for the starting states reproduced experimental FEB measurements with accuracies of ~1 kcal/mol.
SM-FEB calculations offer an alternative to empirical “energy” scoring approaches since they can appear to be able to largely reproduce observed ligand-protein FEBs.37 However, these calculations are computationally demanding. One possible approach to improve the accuracy of virtual screening within the constraints of limited computing resources is to use conventional docking programs to predict poses and preliminary interaction “scores” for the compound library, and then perform rigorous calculations to determine FEB for the “best” (i.e., top-ranked) docked compounds. This FEB rescoring method is attractive because ligand poses can be rapidly determined with empirical energy functions, and SM-FEB calculations can be limited to a subset of the original virtual library. Moreover, compound databases can be examined with parallel calculations, and individual perturbation steps in SM-FEB calculations are amenable to parallel processing and distributed computing environments. For example, the perturbation sampling steps in pathway decoupling calculations34–36 can be independently calculated in a distributed computing environment.38
This study compared the accuracy of virtual screening a library of known binders and non-binders of L99A T4 lysozyme39 using either FEB rescoring or empirical docking scores. The rescoring approach used the well-established AutoDock415, 40 program to compute initial poses and empirical docking scores. Roux’ mean-field pathway decoupling FEB approach34–36 was used to subsequently calculate FEBs. In addition, the sensitivity of these calculations to the initial docked structures was determined. Significantly, FEB calculations initiated with either crystal structures or AutoDock4 poses were in good agreement with experimental measurements. In a limited virtual screening experiment, false-positive rates were reduced and enrichment rates improved when libraries were evaluated with FEB rescoring as opposed to AutoDock4 scores. Moreover, rescoring allowed clear discrimination between ligands that were known binders and non-binders. These results suggest that FEB rescoring could be used to efficiently screen large virtual libraries for novel drug leads.
EXPERIMENTAL METHODS
Hardware
All calculations were performed at the Texas Advanced Computing Center (TACC; Austin, TX) using the “Lonestar” high-performance cluster that consisted of 1,300 dual core 64-bit 2.66 GHz Xeon (Intel) processors.
Atomic Coordinates
Atomic coordinates for L99A T4 lysozyme apo-enzyme and co-crystal structures were obtained from the Protein Data Bank. The reference codes were 2B6Y for the apo-enzyme and co-crystal structures were 1NHB (ethybenzene ligand), 188L (o-xylene ligand), 187L (p-xylene ligand), 182L (benzofuran ligand), 185L (indole ligand), 186L (n-butlybenznene ligand), and 184L (isobulbenzene ligand).41, 42 The benzene-lysozyme co-crystal coordinates were provided by Y. Deng (University of Chicago).
Docking Calculations
Ligand coordinates, if not available from co-crystal structures, were generated with PyMol 0.99.43 Ligands were parameterized with Antechamber44 using the generalized AMBER force field45 and AM1-BCC charges.46 The three-dimensional structures of all ligands were minimized with CHARMM using an adopted basis Newton-Raphson minimization.47, 48
Ligands and lysozyme target proteins were prepared for docking using the program AutoDockTools40 and its default parameters, including assigning of AutoDock’s atom types and charges. All lysozyme side-chains were treated as fixed entities. Dockings were performed using the program AutoDock 4.01.15, 40 Previously, this docking program had successfully predicted co-crystal conformations for a number of systems.15 Grid parameters were used with default settings, and the search areas were centered on the lysozyme-binding pocket. Docking parameters were optimized for large-scale virtual screening (data not shown), with the number of genetic algorithm runs set to 100, the maximum number of energy evaluations set to one million, and the population size set to 200; all other docking parameters were set tof default values. The most likely pose from a docking simulation was determined using a pose-based cluster analysis and a 1.5 Å cut-off. Based on previous work, poses that most closely mimicked the crystallographic structure typically had the lowest energy score within the largest pose cluster (data not shown). The most likely pose was protonated using PyMol and re-parameterized with Antechamber as described above; however these poses were not subjected to additional minimization.
Mean-field Free Energy of Binding (MF-FEB) Calculations
The calculations were applied as described previously.34–36 Calculations were performed using the CHARMM package47, 48 with the CHARMM22 force field49, 50 used to describe the protein and TIP3 water parameters51 used to describe the explicit waters. Each binding calculation was done in triplicate using same equilibrated starting coordinates.
Statistics
All statistics were preformed using Microsoft’s Excel 2003. P-scores were calculated using the two-tailed Student T-test and varying standard deviation options. All other functions used the default settings.
RESULTS AND DISCUSSION
Test Systems
We tested the accuracy of the AutoDock scoring function and free energy calculations using the L99A T4 lysozyme39 as a test system. The L99A mutation in T4 lysozyme created an ~150 A3 void in center of a helix bundle that can bind small hydrophobic molecules.52 Two collections of small molecules were used as test sets. The first set, or control set, consisted of eight lysozyme ligands (n-butlybenznene, i-butlybenzene, ethylbenzene, benzofuran, benzene, indole, p-xylene, and o-xylene), each with a known binding affinity and co-crystal structure.39, 42 Experimental binding energies (ΔGexp) for the control set ranged from −6.70 to −4.60 kcal/mol. 39 This set was used to examine the accuracy of MF-FEB predictions relative to the experimental energies. We used a second ligand set, or screening set, to examine the ability of MF-FEB predictions to discriminate between lysozyme binders and non-binders in a small-scale virtual screening experiment. The screening set consisted of 30 compounds selected from thermal shift experiments that categorized the compounds as either lysozyme binders (16 compounds) or non-binders (14 compounds).39 Experimental binding energies for the known binders in the screening set ranged from −6.70 to −4.59 kcal/mol. 39
Accuracy of MF-FEB Calculations Using AutoDock4-predicted Binding Poses
Three experiments were performed with the control set to test the accuracy of MF-FEB calculations. These experiments used as initial coordinates for the MF-FEB calculations the coordinates from co-crystal structures, AutoDock4-generated self-docked binding poses, and AutoDock4-generated cross-docked binding poses.
To minimize errors arising from inaccurate binding orientations between a ligand and target protein, the first set of MF-FEB calculations were completed using coordinates extracted from inhibitor-lysozyme co-crystal structures (Table 1). The implicit assumption was that these structures represented the biologically relevant docking result, and thus were good starting structures for MF-FEB (ΔΔGbinding) calculations. These calculations showed good agreement to ΔGexp measurements, with a linear correlation coefficient r=0.85 and an average error of 1.3 kcal/mol (s.d.=0.99 kcal/mol; n=3) between calculated and experimental free energies (Table 1). In addition, these calculations were in good agreement (average error of 1.6 ± 1.2 kcal/mol) with previous MF-FEB calculations performed with ligand partial charges calculated with CHARMM.34 During the molecular dynamics equilibration phase of the MF-FEB calculations the initial ligand positions shifted on average ~0.7 Å relative to the crystal structure coordinates (Table 1). The average position during equilibration was used as the reference pose for applying translation and conformation constraints to the ligand. These calculations were more accurate than MF-FEB calculations that used co-crystal structures as the constraint reference poses.36
Table 1.
Comparison between MF-FEB Calculations and Experimental Binding Energies a
| Ligands | Experimental | MF-FEB | |
|---|---|---|---|
| ΔGexp (kcal/mol) | rmsd* (Å) | ΔΔGbinding ( kcal/mol) | |
| n-butylbenzene | −6.7 ± 0.02 | 0.9 | −7.8 ± 0.5 |
| i-butylbenzene | −6.5 ± 0.06 | 0.9 | −9.5 ± 0.6 |
| ethylbenzene | −5.8 ± 0.07 | 1.3 | −8.0 ± 0.2 |
| benzofuran | −5.5 ± 0.03 | 0.3 | −6.5 ± 0.4 |
| benzene | −5.2 ± 0.2 | 0.8 | −5.2 ± 1.0 |
| indole | −4.9 ± 0.06 | 0.7 | −3.9 ± 0.2 |
| p-xylene | −4.7 ± 0.06 | 0.6 | −5.5 ± 0.8 |
| o-xylene | −4.6 ± 0.06 | 0.3 | −5.3 ± 0.2 |
Inhibitor-lysozyme co-crystal structures were used as the starting poses for the ΔΔGbinding calculations. MF-FEB calculations were performed in triplicate. Root-mean-square deviation (rmsd) reflects the displacement of heavy atom positions between the final equilibrated pose and the starting structure.
Previous studies had observed that conformational bias in the T4 lysozyme binding site could reduce the accuracy FEB predictions.34, 53 To determine the sensitivity of MF-FEB calculations to the initial coordinates of the ligand-protein structure, ligands of the control set were self-docked into the binding site of their corresponding lysozyme structures using AutoDock4. The ligands were not energy minimized prior to the docking calculations and therefore the docking simulations inherited the information implicit in the co-crystal coordinates. Since Val111 in the T4 lysozyme binding pocket was observed to adopt ligand-dependent conformations,39 self-docking was expected to reduce systematic bias arising from treating the protein binding site as a fixed structure.
The AutoDock generated structures and the MF-FEB constraint structures had average rmsd of 1.4 Å and 0.8 Å, respectively, relative to the co-crystal structures (Table 2). However, the constraint reference structures produced from either AutoDock or co-crystal starting structures differed by ~1 Å after the equilibration phase of the MF-FEB calculations. AutoDock scores for each ligand-lysozyme complex showed little correlation with ΔGexp measurements (r = 0.52), while the MF-FEB ΔΔGbinding calculations correlated weakly with the ΔGexp measurements (r=0.67) (Table 2). The average deviation between AutoDock scores and ΔGexp measurements was 0.86 “kcal/mol”, whereas the average deviation between MF-FEB ΔΔGbinding and ΔGexp measurements was 1.5 kcal/mol. However, these differences in the average deviation were not statistical different (two-tailed Student T-test, p=0.23). These results implied that AutoDock scores and MF-FEB calculations would likely be unable to correctly rank-order ligands with <10-fold differences in equilibrium dissociation constants.
Table 2.
MF-FEB Predictions Performed with Self-docked Poses a
| Ligands | Experimental | AutoDock4 | MF-FEB | ||
|---|---|---|---|---|---|
| ΔGexp (kcal/mol) | rmsd (Å) | Score (kcal/mol) | rmsd (Å) | ΔΔGbinding (kcal/mol) | |
| n-butylbenzene | −6.7 ± 0.02 | 1.0 | −5.24 | 1.2 | −11.3 ± 1.2 |
| i-butylbenzene | −6.5 ± 0.06 | 1.7 | −4.97 | 0.4 | −7.3 ± 0.1 |
| ethylbenzene | −5.8 ± 0.07 | 1.3 | −4.46 | 0.4 | −5.9 ± 0.1 |
| benzofuran | −5.5 ± 0.03 | 2.2 | −4.77 | 2.1 | −6.2 ± 0.5 |
| benzene | −5.2 ± 0.16 | 1.1 | −4.00 | 0.7 | −4.4 ± 0.7 |
| indole | −4.9 ± 0.06 | 1.5 | −5.05 | 0.6 | −3.8 ± 0.2 |
| p-xylene | −4.7 ± 0.06 | 1.3 | −4.54 | 0.6 | −7.0 ± 0.6 |
| o-xylene | −4.6 ± 0.06 | 1.1 | −4.51 | 0.7 | −6.4 ± 0.2 |
The listed root-mean-square deviation (rmsd) compared the co-crystal structures to either AutoDock-generated or MD-FEB poses. Only non-hydrogen atoms were used to tabulate rmsd values. The MF-FEB calculations were repeated 3 times with different starting seeds. The ΔGexp data was included for ease of reference.
In more demanding experiments, the control set used the apo lysozyme structure as a target for AutoDock and MF-FEB calculations (Table 3). These simulations would be characteristic of approaches used for virtual screening where numerous ligand structures would be tested for binding to a single protein conformation. In these cross-docked experiments, the AutoDock program positioned the test ligands within the apo lysozyme structure in orientations that approximated the experimentally determined co-crystal structures (average rmsd ~1.6 Å) (Table 3). The MF-FEB molecular dynamics calculations typically repositioned the ligands so they more closely matched the co-crystal structures (average rmsd ~1.4 Å). The observed displacements of the docked ligands relative to the corresponding X-ray structures were largely due to the conformation of Val111 in the apo structure, which reduced the volume of the lysozyme apo binding site relative to the observed co-crystal structures. MF-FEB calculations performed with the AutoDock cross-docked poses as a starting conformation differed an average of ~1.4 kcal/mol from the ΔGexp measurements (Table 3). However, the set of individual MF-FEB ΔΔGbinding calculations correlated poorly with ΔGexp measurements (r = −0.16). As observed for MF-FEB calculations that used self-docked poses, these cross-docked MF-FEB results implied that MF-FEB calculations would likely be unable to correctly rank-order ligands with <10-fold differences in equilibrium dissociation constants.
Table 3.
MF-FEB Predictions using an Apo Lysozyme Protein Structure as the Docking Target a
| Ligands | Experimental | Autodock4 | MF-FEB | ||
|---|---|---|---|---|---|
| ΔGexp (kcal/mol) | rmsd (Å) | Score (kcal/mol) | rmsd (Å) | ΔΔGbinding (kcal/mol) | |
| n-butylbenzene | −6.7 ± 0.02 | 1.6 | −6.20 | 1.6 | −3.5 ± 0.4 |
| i-butylbenzene | −6.5 ± 0.06 | 1.7 | −5.50 | 1.7 | −3.9 ± 0.6 |
| ethylbenzene | −5.8 ± 0.07 | 1.4 | −4.84 | 0.9 | −7.3 ± 0.2 |
| benzofuran | −5.5 ± 0.03 | 2.1 | −4.69 | 2.1 | −5.5 ± 0.6 |
| benzene | −5.2 ± 0.2 | 1.3 | −3.72 | 0.5 | −4.5 ± 1.1 |
| indole | −4.9 ± 0.06 | 1.3 | −5.03 | 1.6 | −3.0 ± 0.2 |
| p-xylene | −4.7 ± 0.06 | 1.4 | −4.37 | 1.8 | −4.4 ± 1.0 |
| o-xylene | −4.6 ± 0.06 | 1.8 | −4.50 | 0.8 | −5.9 ± 2.4 |
For the MF-FEB calculations, three replicate calculations were performed. The experimental binding data is repeated for ease of reference. The root-mean-square deviation (rmsd) compared the co-crystal structures to either AutoDock-generated or MD-FEB poses.
MF-FEB calculations initiated with either AutoDock-generated or co-crystal ligand conformations generally produced similar values. On average, more accurate MF-FEB ΔΔGbinding calculations occurred in cases where the AutoDock structures most closely reproduced the available co-crystal structures. Docking against an apo protein that had binding site conformational differences relative to the co-crystal structure produced ligand structures that were displaced from the co-crystal structure and generally produced less accurate agreements between MF-FEB ΔΔGbinding and ΔGexp values.
Receptor binding site flexibility is a challenge for docking programs.16, 19, 20, 54, 55 Some approaches have modeled receptor flexibility by combining docking calculations with receptor molecular dynamics (MD).56 However, the MD performed during the above MF-FEB calculations was not sufficiently lengthy to enable significant changes in the receptor binding site conformation. More accurate MF-FEB predictions may result from calculations that incorporate receptor flexibility.57,58
Enrichment and Discrimination Characteristics of MF-FEB-based Virtual Screening
Although relatively accurate binding free energies could be calculated using the bound conformations that resulted from docking ligands in the control set to the apolysozyme, the average error of ~1.4 kcal/mol for these calculations was not sufficiently accurate to produce a high correlation to the experimental binding energies that spanned only 2.1 kcal/mol. Since virtual screening experiments require discrimination between molecules that bind to the target protein (binders) and molecules that do not bind to the target protein (non-binders), the free energy range for these molecules includes both positive and negative values and likely spanned a larger range of free energies than existed in the control set. Thus, a small-scale virtual screening experiment was performed to determine if the accuracy of MF-FEB calculations would be sufficient to distinguish between binding and nonbinding molecules. This experiment used apo T4 lysozyme L99A as the target protein and a library of 16 known binders and 14 known non-binders known as the screening set (Table 4). In this experiment, a correlation coefficient between experimental and calculated FEB could not be determined as the ΔGexp for the non-binders was unknown. However, this experiment provided insight on library enrichment, ligand discrimination, the responsiveness of the energy functions, and the role of solvation in binding predictions.
Table 4.
Small-scale Virtual Screening of T4 Lysozyme L99A against a Library of 30 Ligands a
| Ligand | Experimental | AutoDock4 | MF-FEB | ||
|---|---|---|---|---|---|
| ΔGexp (kcal/mol) | Score (kcal/mol) | Δ ΔGbinding (kcal/mol) | ΔGsite (kcal/mol) | ΔGsolvation (kcal/mol) | |
| n-butylbenzene | −6.70 ± 0.02 | −6.20 | −3.5 ± 0.4 | −4.6 ± 0.2 | −1.0 ± 0.5 |
| propylbenzene | −6.55 ± 0.02 | −5.46 | −8.3 ± 0.6 | −9.1 ± 0.7 | −0.8 ± 0.1 |
| isobutylbenzene | −6.51 ± 0.06 | −5.50 | −3.9 ± 0.6 | −5.3 ± 0.5 | −1.4 ± 0.3 |
| ethylbenzene | −5.76 ± 0.07 | −4.84 | −7.3 ± 0.2 | −8.5 ± 0.3 | −1.2 ± 0.2 |
| thianaphthene | −5.71 ± 0.05 | −5.07 | −7.0 ± 0.5 | −10.0 ± 0.2 | −3.0 ± 0.4 |
| toluene | −5.52 ± 0.04 | −4.19 | −6.4 ± 0.4 | −7.6 ± 0.06 | −1.1 ± 0.4 |
| benzofuran | −5.46 ± 0.03 | −4.69 | −5.5 ± 0.6 | −9.5 ± 0.5 | −4.0 ± 0.2 |
| 4-ethyltoluene | −5.42 ± 0.01 | −5.77 | −7.3 ± 0.1 | −8.6 ± 0.06 | −1.2 ± 0.03 |
| benzene | −5.19 ± 0.16 | −3.72 | −4.5 ± 1.1 | −5.2 ± 1.2 | −0.7 ± 0.2 |
| indene | −5.13 ± 0.01 | −5.03 | −6.1 ± 1.0 | −9.3 ± 0.3 | −3.2 ± 0.6 |
| 3-ethyltoluene | −5.12 ± 0.02 | −5.72 | −6.6 ± 0.4 | −7.7 ± 0.2 | −1.1 ± 0.3 |
| indole | −4.89 ± 0.06 | −4.85 | −3.0 ± 0.2 | −10.2 ± 0.2 | −7.2 ± 0.3 |
| m-xylene | −4.75 ± 0.15 | −4.33 | −5.2 ± 0.4 | −6.1 ± 0.2 | −0.9 ± 0.3 |
| p-xylene | −4.67 ± 0.06 | −4.37 | −4.2 ± 1.0 | −5.3 ± 1.2 | −1.1 ± 0.4 |
| o-xylene | −4.60 ± 0.06 | −4.50 | −5.9 ± 2.4 | −6.9 ± 2.5 | −1.2 ± 0.4 |
| 2-ethyltoluene | −4.56 ± 0.06 | −5.53 | −6.9 ± 0.9 | −7.9 ± 0.5 | −1.0 ± 0.7 |
| pyridine | NB | −3.30 | −1.0 ± 0.4 | −5.4 ± 0.4 | −4.4 ± 0.3 |
| phenol | NB | −4.10 | −1.1 ± 0.4 | −7.4 ± 0.3 | −6.2 ± 0.2 |
| cyclohexane | NB | −4.07 | −1.6 ± 1.1 | −0.2 ± 1.6 | 1.4 ± 0.5 |
| p-cresol | NB | −4.55 | −2.0 ± 0.3 | −7.9 ± 0.6 | −5.9 ± 0.3 |
| 1,1-diethylurea | NB | −3.96 | 2.2 ± 0.5 | −8.8 ± 0.4 | −11.0 ± 0.8 |
| aniline | NB | −3.99 | −3.0 ± 0.8 | −8.7 ± 0.5 | −5.7 ± 0.3 |
| benzyl alcohol | NB | −4.47 | −0.02 ± 1.3 | −7.4 ± 0.9 | −7.4 ± 0.5 |
| trans- cinnamaldehyde | NB | −5.56 | −1.8 ± 0.4 | −8.0 ± 0.12 | −6.3 ± 0.4 |
| tert- butylbenzene | NB | −5.09 | −6.7 ± 1.3 | −8.1 ± 1.2 | −1.4 ± 0.3 |
| ethanol | NB | −2.13 | 5.6 ± 0.1 | 2.3 ± 0.2 | −3.4 ± 0.3 |
| quinoline | NB | −5.01 | −3.7 ± 0.5 | −10.2 ± 0.7 | −6.5 ± 0.2 |
| 1-heptoanol | NB | −5.19 | −4.8 ± 0.6 | −8.0 ± 0.9 | −3.3 ± 0.6 |
| azulene | NB | −5.38 | −0.8 ± 0.3 | −4.6 ± 0.3 | −3.8 ± 0.1 |
| furan | NB | −2.76 | −3.7 ± 0.3 | −4.2 ± 0.2 | −0.4 ± 0.1 |
Listed are ΔGexp observations and calculated AutoDock scores and MF-FEB ΔΔGbinding. NB indicates a non-binding molecule (experimentally determined).
Enrichment curves (Fig. 1) that compared the percent of binders relative to the energy-ranked virtual database were constructed from the information in Table 4. Ranking the compound library by either AutoDock score or MF-FEB ΔΔGbinding identified known lysozyme binders as the first three hits (Table 4, Fig. 1). Moreover, the top scoring hit in each method corresponded to one of the strongest lysozyme binders in the screening set. However, after the initial three successful hits, the percentage of binders predicted by AutoDock scores began to approach a random distribution. In contrast, there were very few false positive hits using MF-FEB ΔΔGbinding calculations, and the percentage of binders identified relative to percentage of hits examined closely followed an ideal distribution. One of the few false positive MF-FEB predictions was tert-butylbenezene, which both scoring methods predicted to be a lysozyme binder. Tert-butylbenezene was an interesting non-binding ligand since it was chemically similar to the two strongest binders in the screening set. It is possible that tert-butylbenezene was experimentally classified as a non-binder because it could not enter the lysozyme binding site as opposed to having unfavorable interactions with the binding site; this restriction on binding would not be recognized by either the AutoDock or MF-FEB calculations.
Figure 1.

Enrichment curve showing AutoDock and MF-FEB results for small-scale virtual screening of T4 lysozyme L99A against a library of 16 known binders and 14 known non-binders. The ideal line represents a best-case prediction with no false positives. The random line corresponds to a random distribution of binders and non-binders.
The ΔGexp for ligands in the co-crystal test set spanned 2.1 kcal/mol. In contrast, the range of free energies should be greater in the screening set since both non-binders and binders were included. The AutoDock calculations displayed similar scoring ranges for both binders and non-binders, with AutoDock scores for the screening set spanning ~4 kcal/mol (Table 4, Fig. 2) and scores for the bound ligands of the screening set spanning 2.5 kcal/mol (Table 4, Fig. 2). This small response range of AutoDock scores was consistent with previous virtual screening experiences in our laboratory (data not shown). In contrast, MF-FEB values calculated for the screening set spanned ~14 kcal/mol, and the majority of non-binders were predicted to have ΔGbinding > −2 kcal/mol. (Table 4, Fig. 2). MF-FEB energies were significantly better than AutoDock scores at discriminating between binders and non-binders. The average AutoDock score for lysozyme binders and non-binders was −5.0±0.3 and −4.3±0.5 kcal/mol, respectively. The p-score between these two groups was 0.015, which suggested a weak statistically relevant difference between the two groups. In contrast, the average MF-FEB ΔΔGbinding for lysozyme binders and non-binders was −5.7±0.7 and −1.6±1.6 kcal/mol respectively. The p-score between these groups was 0.00009, indicating the discrimination between the two groups based on MF-FEB energies was highly significant.
Figure 2.
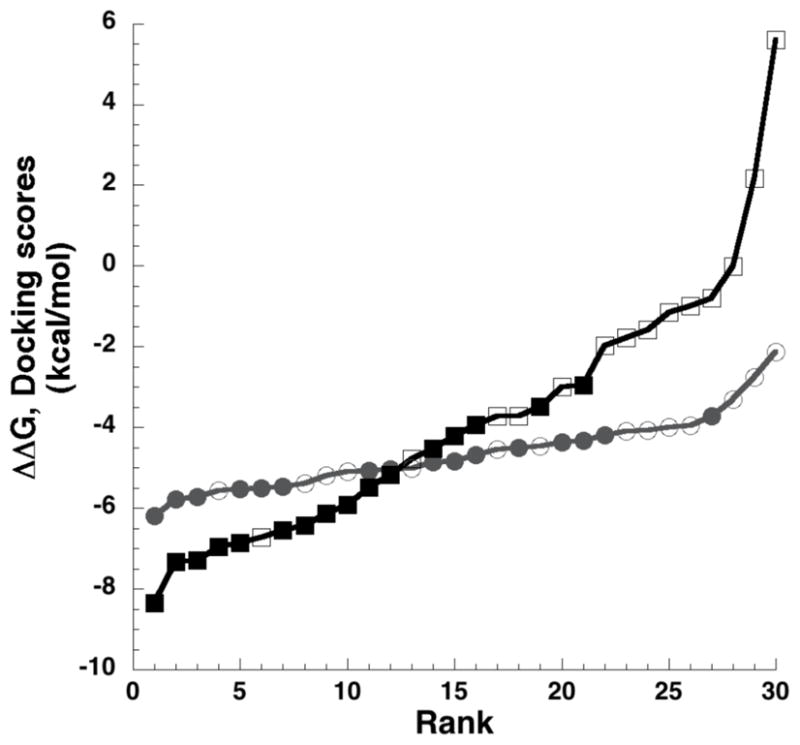
Energy distribution of ligands rank-ordered by AutoDock score (circles) or MF-FEB ΔΔGbinding (squares). Filled and unfilled markers represent lysozyme binders and non-binders, respectively.
Overall, the screening set was more highly enriched for lysozyme binders when ordered by MF-FEB energies instead of AutoDock scores. However, it was difficult to compare the enrichment observed in this MF-FEB study to previous comparative enrichment studies of docking programs21–24 because the number of compounds in the screening set was small and contained similar numbers of binders and non-binders.
The high degree of discrimination observed with the MF-FEB calculations may arise from its accurate treatment of solvation effects. The majority (11 of 14) of non-binders in the screening set were weakly polar, whereas the T4 lysozyme L99A binding site was predominantly hydrophobic. The MF-FEB ΔΔGbinding was the differential energy for the ligand interacting with the protein (ΔGsite) and the solvent (ΔGsolvation) (Table 4). The average ΔGsite for binders and non-binders was -7.6±0.9 and −6.2±1.8 kcal/mol, respectively, and the p-score between these groups was 0.096. The average ΔGsolvation for binders and non-binders was −1.9±0.8 and −4.6±1.6 kcal/mol, respectively, with a p-score of 0.005 between these groups. Thus, it appeared that the discrimination between binders and non-binders observed with the MF-FEB calculations was largely driven by solvation calculations, which was consistent with the physical nature of ligands and binding site. The screening set contained 3 non-binders that lacked polar groups. Tert-butylbenzene, already discussed, ranked high (i.e., lower AutoDock score or MF-FEB energy relative to other ligands) in both docking and MF-FEB calculations. Cyclohexane and azulene non-binders had unfavorable MF-FEB energies due to steric constraints that resulted in weak ΔGsite contributions. The screening set highlighted the importance of determining both solvation and interaction energy contributions for the accurate calculation of the binding free energy.
Despite the promising discrimination observed with the lysozyme small-scale virtual screen, the MF-FEB calculations suffered from many of the drawbacks common to all molecular mechanical calculations. The available force fields were approximate, and could be improved by including polarizable force fields.37, 59 Convergence of the molecular dynamics simulations was a concern, since the variations in replicate MF-FEB calculations might suggest that some systems were not fully converged. In addition, the molecular dynamics simulations must sufficiently sample protein-ligand conformation space to ensure accurate calculation of solvation and interaction energies. Moreover, these simulations only permit local protein conformational changes and do not allow long-range protein motions or partial charge redistribution during protein-ligand interactions. However, in spite of these limitations, the use of MF-FEB energies with AutoDock-determined poses provided a powerful approach to discriminate between binders and non-binders in a virtual screening experiment.
CONCLUSIONS
MF-FEB energies correlated strongly with experimental binding energies when accurate structures of the lysozyme-ligand complex were used to initiate the MF-FEB calculations. As the deviation between the crystallographic and docked structures increased, the average error of the MF-FEB calculations only slightly increased. However, small-scale virtual screening results showed that rank-ordering libraries based on MF-FEB energies of docking poses could provide significant enrichment relative to rank-ordering based on AutoDock scores. The MF-FEB rescoring provided significant discrimination between micromolar binders and non-binders. These results suggested that rescoring docking poses with MF-FEB calculations could significantly reduce the false positive rate of conventional virtual screening projects.
Currently, limits on the accuracy of MF-FEB calculations initiated from docking poses may prevent these calculations from being used to design ligands with incremental improvements (e.g., 1.5 kcal/mol) in binding free energies. However, since these calculations can discriminate between binders and non-binders, they could be used to ensure that novel molecules proposed for chemical synthesis will bind to desired molecular targets. The results of this study were encouraging and merit further testing against larger virtual libraries.
Acknowledgments
We thank Drs. J. Boisseau, J. Briggs, Y. Deng, S. Gilbertson, and B. Roux for helpful discussions. Generous computer support was provided by the IBM World Community Grid project team (J. Armstrong, V. Bertis, B. Boverman, B. Dolph, T. Hahn, K. Reed, G. Suh, S. Swick, K. Uplinger, N. Wadycki, R. Willner) and the Texas Advanced Computing Center (University of Texas, Austin, TX). This research was supported in part by grants from the NIH/NIAID (1R21AI066160-01A2 to SJW), The Welch Foundation (H-1642 to SJW), and the John S. Dunn Research Foundation, and a fellowship from the Pharmacoinformatics Training Program (RDM; NIH Grant No. T90 DK071504-03) of the W. M. Keck Center for Interdisciplinary Bioscience Training of the Gulf Coast Consortia.
References
- 1.Tomlinson SM, Malmstrom RD, Russo A, Mueller N, Pang YP, Watowich SJ. Structure-Based Discovery of Dengue Virus Protease Inhibitors. Antiviral Res. 2009;82:110–114. doi: 10.1016/j.antiviral.2009.02.190. [DOI] [PMC free article] [PubMed] [Google Scholar]
- 2.Kiss R, Polgar T, Kirabo A, Sayyah J, Figueroa NC, List AF, Sokol L, Zuckerman KS, Gali M, Bisht KS, Sayeski PP, Keseru GM. Identification of a Novel Inhibitor of Jak2 Tyrosine Kinase by Structure-Based Virtual Screening. Bioorg Med Chem Lett. 2009 doi: 10.1016/j.bmcl.2009.04.138. [DOI] [PMC free article] [PubMed] [Google Scholar]
- 3.Lee K, Kim J, Jeong KW, Lee KW, Lee Y, Song JY, Kim MS, Lee GS, Kim Y. Structure-Based Virtual Screening of Src Kinase Inhibitors. Bioorg Med Chem. 2009;17:3152–3161. doi: 10.1016/j.bmc.2009.02.054. [DOI] [PubMed] [Google Scholar]
- 4.Ravindranathan KP, Mandiyan V, Ekkati AR, Bae JH, Schlessinger J, Jorgensen WL. Discovery of Novel Fibroblast Growth Factor Receptor 1 Kinase Inhibitors by Structure-Based Virtual Screening. J Med Chem. 2010;53:1662–1672. doi: 10.1021/jm901386e. [DOI] [PMC free article] [PubMed] [Google Scholar]
- 5.Khan KM, Wadood A, Ali M, Zia U, Ul-Haq Z, Lodhi MA, Khan M, Perveen S, Choudhary MI. Identification of Potent Urease Inhibitors Via Ligand- and Structure-Based Virtual Screening and in Vitro Assays. J Mol Graph Model. 2010;28:792–798. doi: 10.1016/j.jmgm.2010.02.004. [DOI] [PubMed] [Google Scholar]
- 6.Moro WB, Yang Z, Kane TA, Brouillette CG, Brouillette WJ. Virtual Screening to Identify Lead Inhibitors for Bacterial Nad Synthetase (Nads) Bioorg Med Chem Lett. 2009;19:2001–2005. doi: 10.1016/j.bmcl.2009.02.034. [DOI] [PMC free article] [PubMed] [Google Scholar]
- 7.Chen CS, Tan CM, Huang CH, Chang LC, Wang JP, Cheng FC, Chern JW. Discovery of 3-(4-Bromophenyl)-6-Nitrobenzo[1.3. 2]Dithiazolium Ylide 1,1-Dioxide as a Novel Dual Cyclooxygenase/5-Lipoxygenase Inhibitor That Also Inhibits Tumor Necrosis Factor-Alpha Production. Bioorg Med Chem. 2010;18:597–604. doi: 10.1016/j.bmc.2009.12.008. [DOI] [PubMed] [Google Scholar]
- 8.Ahmed A, Choo H, Cho YS, Park WK, Pae AN. Identification of Novel Serotonin 2c Receptor Ligands by Sequential Virtual Screening. Bioorg Med Chem. 2009;17:4559–4568. doi: 10.1016/j.bmc.2009.05.003. [DOI] [PubMed] [Google Scholar]
- 9.Kang NS, Lee GN, Kim CH, Bae MA, Kim I, Cho YS. Identification of Small Molecules That Inhibit Gsk-3beta through Virtual Screening. Bioorg Med Chem Lett. 2009;19:533–537. doi: 10.1016/j.bmcl.2008.10.120. [DOI] [PubMed] [Google Scholar]
- 10.Pang YP, Perola E, Xu K, Prendergast FG. Eudoc: A Computer Program for Identification of Drug Interaction Sites in Macromolecules and Drug Leads from Chemical Databases. J Comput Chem. 2001;22:1750–1771. doi: 10.1002/jcc.1129. [DOI] [PubMed] [Google Scholar]
- 11.Moustakas DT, Lang PT, Pegg S, Pettersen E, Kuntz ID, Brooijmans N, Rizzo RC. Development and Validation of a Modular, Extensible Docking Program: Dock 5. J Comput Aided Mol Des. 2006;20:601–619. doi: 10.1007/s10822-006-9060-4. [DOI] [PubMed] [Google Scholar]
- 12.Friesner RA, Banks JL, Murphy RB, Halgren TA, Klicic JJ, Mainz DT, Repasky MP, Knoll EH, Shelley M, Perry JK, Shaw DE, Francis P, Shenkin PS. Glide: A New Approach for Rapid, Accurate Docking and Scoring. 1. Method and Assessment of Docking Accuracy. J Med Chem. 2004;47:1739–1749. doi: 10.1021/jm0306430. [DOI] [PubMed] [Google Scholar]
- 13.Joy S, Nair PS, Hariharan R, Pillai MR. Detailed Comparison of the Protein-Ligand Docking Efficiencies of Gold, a Commercial Package and Arguslab, a Licensable Freeware. In Silico Biol. 2006;6:601–605. [PubMed] [Google Scholar]
- 14.Kramer B, Rarey M, Lengauer T. Evaluation of the Flexx Incremental Construction Algorithm for Protein-Ligand Docking. Proteins. 1999;37:228–241. doi: 10.1002/(sici)1097-0134(19991101)37:2<228::aid-prot8>3.0.co;2-8. [DOI] [PubMed] [Google Scholar]
- 15.Huey R, Morris GM, Olson AJ, Goodsell DS. A Semiempirical Free Energy Force Field with Charge-Based Desolvation. Journal of Computational Chemistry. 2007;28:1145–1152. doi: 10.1002/jcc.20634. [DOI] [PubMed] [Google Scholar]
- 16.Ghosh S, Nie A, An J, Huang Z. Structure-Based Virtual Screening of Chemical Libraries for Drug Discovery. Current Opinion in Chemical Biology. 2006;10:194–202. doi: 10.1016/j.cbpa.2006.04.002. [DOI] [PubMed] [Google Scholar]
- 17.Gilson MK, Zhou HX. Calculation of Protein-Ligand Binding Affinities. Annu Rev Biophys Biomol Struct. 2007;36:21–42. doi: 10.1146/annurev.biophys.36.040306.132550. [DOI] [PubMed] [Google Scholar]
- 18.Halperin I, Ma B, Wolfson H, Nussinov R. Principles of Docking: An Overview of Search Algorithms and a Guide to Scoring Functions. Proteins. 2002;47:409–443. doi: 10.1002/prot.10115. [DOI] [PubMed] [Google Scholar]
- 19.Kitchen DB, Decornez H, Furr JR, Bajorath J. Docking and Scoring in Virtual Screening for Drug Discovery: Methods and Applications. Nat Rev Drug Discov. 2004;3:935–949. doi: 10.1038/nrd1549. [DOI] [PubMed] [Google Scholar]
- 20.Leach AR, Shoichet BK, Peishoff CE. Prediction of Protein-Ligand Interactions. Docking and Scoring: Successes and Gaps. J Med Chem. 2006;49:5851–5855. doi: 10.1021/jm060999m. [DOI] [PubMed] [Google Scholar]
- 21.Bursulaya BD, Totrov M, Abagyan R, Brooks CL. 3rd Comparative Study of Several Algorithms for Flexible Ligand Docking. J Comput Aided Mol Des. 2003;17:755–763. doi: 10.1023/b:jcam.0000017496.76572.6f. [DOI] [PubMed] [Google Scholar]
- 22.Cummings MD, DesJarlais RL, Gibbs AC, Mohan V, Jaeger EP. Comparison of Automated Docking Programs as Virtual Screening Tools. J Med Chem. 2005;48:962–976. doi: 10.1021/jm049798d. [DOI] [PubMed] [Google Scholar]
- 23.Kontoyianni M, Sokol GS, McClellan LM. Evaluation of Library Ranking Efficacy in Virtual Screening. J Comput Chem. 2005;26:11–22. doi: 10.1002/jcc.20141. [DOI] [PubMed] [Google Scholar]
- 24.Warren GL, Andrews CW, Capelli AM, Clarke B, LaLonde J, Lambert MH, Lindvall M, Nevins N, Semus SF, Senger S, Tedesco G, Wall ID, Woolven JM, Peishoff CE, Head MS. A Critical Assessment of Docking Programs and Scoring Functions. J Med Chem. 2006;49:5912–5931. doi: 10.1021/jm050362n. [DOI] [PubMed] [Google Scholar]
- 25.Charifson PS, Corkery JJ, Murcko MA, Walters WP. Consensus Scoring: A Method for Obtaining Improved Hit Rates from Docking Databases of Three-Dimensional Structures into Proteins. J Med Chem. 1999;42:5100–5109. doi: 10.1021/jm990352k. [DOI] [PubMed] [Google Scholar]
- 26.Clark RD, Strizhev A, Leonard JM, Blake JF, Matthew JB. Consensus Scoring for Ligand/Protein Interactions. J Mol Graph Model. 2002;20:281–295. doi: 10.1016/s1093-3263(01)00125-5. [DOI] [PubMed] [Google Scholar]
- 27.Garcia-Sosa AT, Hetenyi C, Maran U. Drug Efficiency Indices for Improvement of Molecular Docking Scoring Functions. J Comput Chem. 2009;31:174–184. doi: 10.1002/jcc.21306. [DOI] [PubMed] [Google Scholar]
- 28.Gilson MK, Given JA, Bush BL, McCammon JA. The Statistical-Thermodynamic Basis for Computation of Binding Affinities: A Critical Review. Biophys J. 1997;72:1047–1069. doi: 10.1016/S0006-3495(97)78756-3. [DOI] [PMC free article] [PubMed] [Google Scholar]
- 29.Aqvist J, Marelius J. The Linear Interaction Energy Method for Predicting Ligand Binding Free Energies. Comb Chem High Throughput Screen. 2001;4:613–626. doi: 10.2174/1386207013330661. [DOI] [PubMed] [Google Scholar]
- 30.Kollman PA, Massova I, Reyes C, Kuhn B, Huo S, Chong L, Lee M, Lee T, Duan Y, Wang W, Donini O, Cieplak P, Srinivasan J, Case DA, Cheatham TE., 3rd Calculating Structures and Free Energies of Complex Molecules: Combining Molecular Mechanics and Continuum Models. Acc Chem Res. 2000;33:889–897. doi: 10.1021/ar000033j. [DOI] [PubMed] [Google Scholar]
- 31.Helms V, Wade R. Computational Alchemy to Calculate Absolute Protein-Ligand Binding Free Energy. J Am Chem Soc. 1998;120:2710–2713. [Google Scholar]
- 32.Jorgensen WL, Buckner JK, Boudon S, Tiradorives J. Efficient Computation of Absolute Free-Energies of Binding by Computer-Simulations - Application to the Methane Dimer in Water. Journal of Chemical Physics. 1988;89:3742–3746. [Google Scholar]
- 33.Boresch S, Tettinger F, Leitgeb M, Karplus M. Absolute Binding Free Energies: A Quantitative Approach for Their Calculation. Journal of Physical Chemistry B. 2003;107:9535–9551. [Google Scholar]
- 34.Deng Y, Roux B. Calculation of Standard Binding Free Energies: Aromatic Molecules in T4 Lysozyme L99a Mutant. Journal of Chemical Theory and Computation. 2006;2:1225–1273. doi: 10.1021/ct060037v. [DOI] [PubMed] [Google Scholar]
- 35.Deng Y, Roux B. Computation of Binding Free Energy with Molecular Dynamics and Grand Canonical Monte Carlo Simulations. J Chem Phys. 2008;128:115103. doi: 10.1063/1.2842080. [DOI] [PubMed] [Google Scholar]
- 36.Wang J, Deng Y, Roux B. Absolute Binding Free Energy Calculations Using Molecular Dynamics Simulations with Restraining Potentials. Biophys J. 2006;91:2798–2814. doi: 10.1529/biophysj.106.084301. [DOI] [PMC free article] [PubMed] [Google Scholar]
- 37.Deng Y, Roux B. Computations of Standard Binding Free Energies with Molecular Dynamics Simulations. J Phys Chem B. 2009;113:2234–2246. doi: 10.1021/jp807701h. [DOI] [PMC free article] [PubMed] [Google Scholar]
- 38.Tomlinson SM, Malmstrom RD, Watowich SJ. New Approaches to Structure-Based Discovery of Dengue Protease Inhibitors. Infect Disord Drug Targets. 2009;9:327–343. doi: 10.2174/1871526510909030327. [DOI] [PubMed] [Google Scholar]
- 39.Morton A, Baase WA, Matthews BW. Energetic Origins of Specificity of Ligand Binding in an Interior Nonpolar Cavity of T4 Lysozyme. Biochemistry. 1995;34:8564–8575. doi: 10.1021/bi00027a006. [DOI] [PubMed] [Google Scholar]
- 40.Morris GM, Huey R, Lindstrom W, Sanner MF, Belew RK, Goodsell DS, Olson AJ. Autodock4 and Autodocktools4: Automated Docking with Selective Receptor Flexibility. J Comput Chem. 2009;30:2785–2791. doi: 10.1002/jcc.21256. [DOI] [PMC free article] [PubMed] [Google Scholar]
- 41.Collins MD, Hummer G, Quillin ML, Matthews BW, Gruner SM. Cooperative Water Filling of a Nonpolar Protein Cavity Observed by High-Pressure Crystallography and Simulation. Proc Natl Acad Sci U S A. 2005;102:16668–16671. doi: 10.1073/pnas.0508224102. [DOI] [PMC free article] [PubMed] [Google Scholar]
- 42.Morton A, Matthews BW. Specificity of Ligand Binding in a Buried Nonpolar Cavity of T4 Lysozyme: Linkage of Dynamics and Structural Plasticity. Biochemistry. 1995;34:8576–8588. doi: 10.1021/bi00027a007. [DOI] [PubMed] [Google Scholar]
- 43.DeLano WL. The Pymol Molecular Graphics System. DeLano Scientific LLC; Palo Alto, CA, USA: 2008. [Google Scholar]
- 44.Wang J, Wang W, Kollman PA, Case DA. Automatic Atom Type and Bond Type Perception in Molecular Mechanical Calculations. J Mol Graph Model. 2006;25:247–260. doi: 10.1016/j.jmgm.2005.12.005. [DOI] [PubMed] [Google Scholar]
- 45.Wang J, Wolf RM, Caldwell JW, Kollman PA, Case DA. Development and Testing of a General Amber Force Field. J Comput Chem. 2004;25:1157–1174. doi: 10.1002/jcc.20035. [DOI] [PubMed] [Google Scholar]
- 46.Jakalian A, Jack DB, Bayly CI. Fast, Efficient Generation of High-Quality Atomic Charges. Am1-Bcc Model: Ii. Parameterization and Validation. Journal of Computational Chemistry. 2002;23:1623–1641. doi: 10.1002/jcc.10128. [DOI] [PubMed] [Google Scholar]
- 47.Brooks BR, Bruccoleri RE, Olafson DJ, States DJ, Swaminathan S, Karplus M. Charmm: A Program for Macromolecular Energy, Minimization, and Dynamics Calculations. Journal of Computational Chemistry. 1983;4:187–217. [Google Scholar]
- 48.MacKerel AD, Jr, Brooks CL, Iii, Nilsson L, Roux B, Won Y, Karplus M. Charmm: The Energy Function and Its Parameterization with an Overview of the Program. Vol. 1. John Wiley & Sons; Chichester: 1998. pp. 271–277. [Google Scholar]
- 49.MacKerell AD, Bashford D, Bellott M, Dunbrack RL, Evanseck JD, Field MJ, Fischer S, Gao J, Guo H, Ha S, Joseph-McCarthy D, Kuchnir L, Kuczera K, Lau FTK, Mattos C, Michnick S, Ngo T, Nguyen DT, Prodhom B, Reiher WE, Roux B, Schlenkrich M, Smith JC, Stote R, Straub J, Watanabe M, Wiorkiewicz-Kuczera J, Yin D, Karplus M. All-Atom Empirical Potential for Molecular Modeling and Dynamics Studies of Proteins. J Phys Chem B. 1998;102:3586–3616. doi: 10.1021/jp973084f. [DOI] [PubMed] [Google Scholar]
- 50.Mackerell AD, Jr, Feig M, Brooks CL., 3rd Extending the Treatment of Backbone Energetics in Protein Force Fields: Limitations of Gas-Phase Quantum Mechanics in Reproducing Protein Conformational Distributions in Molecular Dynamics Simulations. J Comput Chem. 2004;25:1400–1415. doi: 10.1002/jcc.20065. [DOI] [PubMed] [Google Scholar]
- 51.Mahoney MW, Jorgensen WL. A Five-Site Model for Liquid Water and the Reproduction of the Density Anomaly by Rigid, Nonpolarizable Potential Functions. J Chem Phys. 2000;112:8910–8922. [Google Scholar]
- 52.Eriksson AE, Baase WA, Wozniak JA, Matthews BW. A Cavity-Containing Mutant of T4 Lysozyme Is Stabilized by Buried Benzene. Nature. 1992;355:371–373. doi: 10.1038/355371a0. [DOI] [PubMed] [Google Scholar]
- 53.Mobley DL, Graves AP, Chodera JD, McReynolds AC, Shoichet BK, Dill KA. Predicting Absolute Ligand Binding Free Energies to a Simple Model Site. Journal of Molecular Biology. 2007;371:1118–1134. doi: 10.1016/j.jmb.2007.06.002. [DOI] [PMC free article] [PubMed] [Google Scholar]
- 54.Teodoro ML, Kavraki LE. Conformational Flexibility Models for the Receptor in Structure Based Drug Design. Curr Pharm Des. 2003;9:1635–1648. doi: 10.2174/1381612033454595. [DOI] [PubMed] [Google Scholar]
- 55.Totrov M, Abagyan R. Flexible Ligand Docking to Multiple Receptor Conformations: A Practical Alternative. Curr Opin Struct Biol. 2008;18:178–184. doi: 10.1016/j.sbi.2008.01.004. [DOI] [PMC free article] [PubMed] [Google Scholar]
- 56.Alonso H, Bliznyuk AA, Gready JE. Combining Docking and Molecular Dynamic Simulations in Drug Design. Med Res Rev. 2006;26:531–568. doi: 10.1002/med.20067. [DOI] [PubMed] [Google Scholar]
- 57.Mobley DL, Chodera JD, Dill KA. The Confine-and-Release Method: Obtaining Correct Binding Free Energies in the Presence of Protein Conformational Change. J Chem Theory Comput. 2007;3:1231–1235. doi: 10.1021/ct700032n. [DOI] [PMC free article] [PubMed] [Google Scholar]
- 58.Mobley DL, Graves AP, Chodera JD, McReynolds AC, Shoichet BK, Dill KA. Predicting Absolute Ligand Binding Free Energies to a Simple Model Site. J Mol Biol. 2007;371:1118–1134. doi: 10.1016/j.jmb.2007.06.002. [DOI] [PMC free article] [PubMed] [Google Scholar]
- 59.Mobley DL, Chodera JD, Dill KA. On the Use of Orientational Restraints and Symmetry Corrections in Alchemical Free Energy Calculations. J Chem Phys. 2006;125:084902. doi: 10.1063/1.2221683. [DOI] [PMC free article] [PubMed] [Google Scholar]