Abstract
We present a novel methodology combining traditional fluorescent in situ hybridization with an in situ protein detection technology called proximity ligation assay. This method has potential to perform a detailed analysis of the relationship between gene status and corresponding protein expression in cells and tissues. We demonstrate that the fluorescent in situ gene protein assay methodology is capable of resolving gene and protein patterns simultaneously on a cell-by-cell basis.
Keywords: epidermal growth factor receptor, fluorescence in situ hybridization, fluorescence in situ gene protein assay, gene amplification, glioblastoma, proximity ligation assay
The flow of information from gene to protein is one of the fundamental principles of molecular biology. However, the relationship between a gene and its protein in complex human diseases is less well-understood. Genetic aberrations are the cornerstone of human cancer. These aberrations frequently involve alterations of gene dosage: the number of copies of a particular gene locus in the genome. Gene dosage changes are thought to exert their effect on tumor cells primarily by altering the expression of the corresponding protein. Yet many questions persist regarding the ultimate impact of gene dosage on protein expression and biological activity. In human cancers, altered gene dosage is not the only mechanism leading to protein deregulation but often involves epigenetic perturbations. Therefore, the relationship between DNA and protein can be less linear than in normal cells.
No currently available technique can assess gene and corresponding protein in the same cells. It is possible to examine the gene copy number and protein expression for a candidate gene separately using traditional fluorescent in situ hybridization (FISH) for the gene status and immunohistochemistry (IHC) or immunofluorescence for the protein status. These assays have proven beneficial for lab and clinical use alike; yet, these assays have remained mutually exclusive.
Studying only the protein provides important information about the biological player but disregards the potential mechanism of protein alteration. In turn, studying only the gene captures potential causes of protein deregulation but omits looking at what is the ultimate effect on the biological player. Here, we describe a new methodology, fluorescent in situ gene protein assay (FIGPA), which allows for parallel inference of gene and corresponding protein status in single cells.
Methods and Results
FIGPA utilizes FISH with commercially available probes to determine the genetic status and, instead of utilizing IHC, captures protein expression using in situ proximity ligation assay (PLA). PLA is a novel in situ technique capable of resolving individual protein molecules in a quantitative fashion with unseen sensitivity and specificity.1,2 PLA has a detection limit in the zeptomolar range and reduces background over traditional techniques by requiring two antibodies to bind in proximity to produce a signal. We have previously shown PLA to reliably mimic protein abundances consistent with heterozygous gene losses.3
Epidermal growth factor receptor (EGFR) is an emerging biomarker with a complex relationship between gene and protein in several human cancers, such as lung cancer, prostate cancer, and glioblastoma multiforme.4–9 EGFR is the target of an expanding body of anticancer agents.10 Screening EGFR concurrently at the genetic and the protein level could therefore simultaneously expose the underlying mechanism of alteration and the presence of the therapeutic target. Given the established heterogeneity of EGFR distribution in human tumors, we used the EGFR oncogene and oncoprotein to study and highlight the utility of FIGPA for gene–protein correlation in glioblastoma multiforme. Glioblastomas, highly malignant human brain tumors, harbor EGFR amplifications in almost half of tumors. Additionally, such concurrent analysis is particularly important in the case of EGFR, where deregulation of the protein emerges in about half of cases from a nongenetic, alternative splicing event that leads to a constitutively active receptor protein (EGFRvIII).
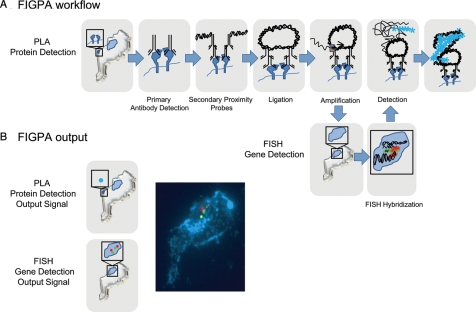
FIGPA can be performed on both paraffin-embedded tissue samples and fixed cells. FIGPA begins by performing PLA (Duolink kit, OLINK Bioscience) (Fig. 1). Following pretreatment appropriate for the type of sample (antigen retrieval and/or permeabilization), the EGFR protein is recognized by a primary antibody and then probed for secondary antibodies tethered to an oligonucleotide (proximity probes). Additional oligonucleotides form a circle of DNA where there are antibodies bound in proximity. This circle becomes the template for a rolling circle PCR reaction, resulting in a thousand-fold amplification of the original protein signal. The protein signal is essentially translated into a nucleic acid sequence. In tissue samples, this sequence is cross-linked into the surrounding environment with a 20-minute 4% paraformaldehyde fix at room temperature. This cross-linking step is necessary because to proceed with FISH in tissues, the sample is digested with pepsin at 37°C. The digest rids the sample of endogenous protein, making room for the 300-bp FISH probes to reach the nucleus in these metabolically active cells. We speculate that the pepsin digest may also cleave the proximity probes, allowing the nucleic acid sequences to wash away in solution if not cross-linked first. We could show that digestion with pepsin after fixation did not alter the abundance or appearance of the PLA signals (data not shown). In fixed cells, the post–PLA fixation and digest steps can be omitted. The samples are then dehydrated and the FISH probe (Spectrum Orange EGFR gene locus at chromosome 7p12 probe and Spectrum Green centromere 7–specific probe, Abbott Molecular) is applied according to manufacturer's procedure. After hybridization, the samples are washed twice in 2X saline sodium citrate (SSC) 0.5% Tween: one at 42°C for 2 minutes and the other at room temperature for 1 minute. Next, the detection mix for PLA, containing fluorescently labeled oligonucleotides complementary to the PCR product, is added and incubated at 37°C for 1 hour. We used either a commercially available 563-nm red emitting fluorophore or a customized Pacific Blue fluorophore (455 nm) (courtesy of OLINK Bioscience) and found comparable PLA signals (Fig. 2). A final wash series of 2X SSC, 1X SSC, 0.2X SSC, and 0.02X SSC for 2 minutes each at room temperature under gentle agitation is performed. After allowing slides to dry, mounting media and a coverslip prepare the sample for fluorescent microscopy (Zeiss Axiovert 200M). Samples for which FISH alone was performed are prepared using the protocol of the probe manufacturer (Abbott Molecular) and visualized with a Zeiss LSM710 microscope.
Fig. 1.
(A) Workflow of FIGPA. FIGPA begins with protein detection by performing PLA. Antibodies recognizing the target of interest are added and that signal is amplified through PCR of linked, tethered nucleic acids. The tissue samples are additionally fixed in 4% paraformaldehyde and digested with pepsin. The genetic detection then takes place as the samples are dehydrated and hybridized overnight with the FISH probe. After washing, the PLA detection probe, complementary to the PCR amplification product, is added. (B) The output of FIGPA consists of the combined protein detection signals (blue dots) and genetic detection signals (green and red dots). These outputs are visualized with a fluorescent microscope.
Fig. 2.
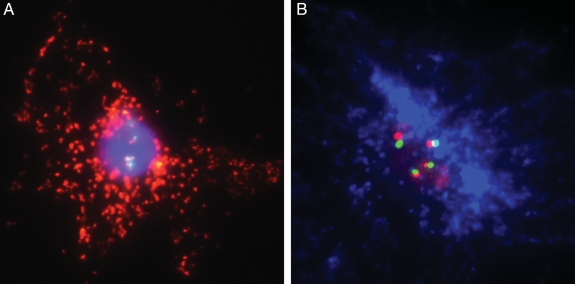
FIGPA in fixed human tumor cells. (A) FIGPA in U87 glioblastoma cells transfected with EGFRvIII. Proximate green (Spectrum Green) and red (Spectrum Orange) signals represent the centromere of chromosome 7 and the EGFR gene locus, respectively; the cytoplasmic red dots (563-nm dye) visualize the EGFRvIII protein. The nucleus is counterstained with Hoechst 33342. (B) Use of Pacific Blue protein detection dye (455 nm) in place of red 563-nm dye. All magnifications ×400.
We initially performed FIGPA in fixed human tumor cells. In U87 glioblastoma cells transfected to overexpress the oncogene EGVRvIII, PLA was targeted to the EGFRvIII protein using the L8A4 antibody,11 and interphase FISH was performed using commercial EGFR probes (Spectrum Orange EGFR locus-specific probe and Spectrum Green centromere 7-specific probe). Figure 2A shows the FIGPA results using the commercially available red dye (563 nm) to capture the cytoplasmic EGFR protein signals and the red/green EGFR gene/chromosome 7 centromere pairs located in the nucleus. Because this design has red signals for both protein and gene, genetic from protein information cannot be easily discriminated, particularly in the case of proteins that localize primarily to the nucleus. Figure 2B represents FIGPA using a customized Pacific Blue (455 nm) protein detection probe to allow genes and proteins to be differentiated by color. We found comparable protein signal patterns with both protein detection probes and, therefore, used the color combination of blue for protein, red for gene-specific locus, and green for chromosome-specific centromere for the remainder of the experiments.
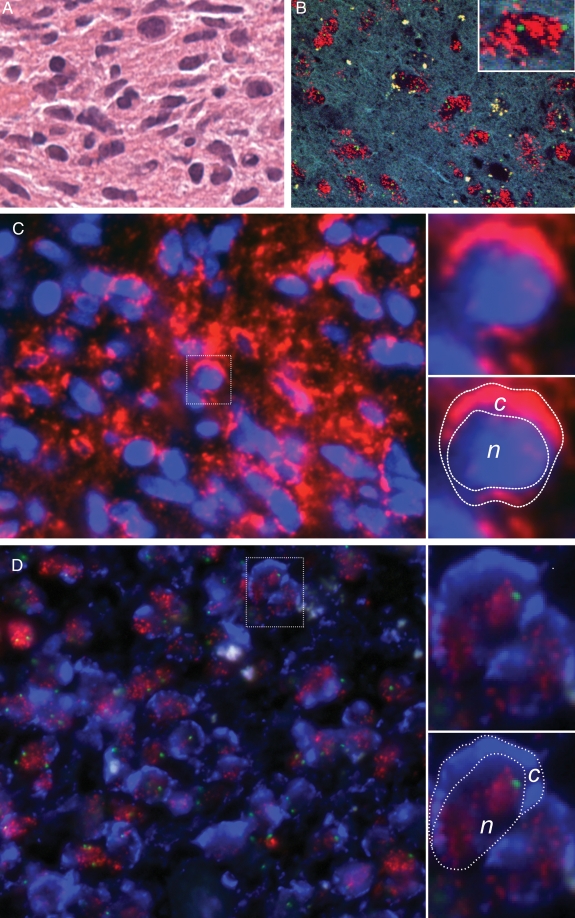
We then tested FIGPA in human tumor tissue. Compared with the monoclonal origin of human cell lines, the polyclonality of human cancers can lead to substantial focal microheterogeneity. Such microheterogeneity can be easily portrayed by FIGPA on cross-tumor sections. We performed FIGPA for EGFR on paraffin-embedded glioblastoma tumors, known to be amplified for EGFR.12 We first display the tumor architecture with a hematoxylin-and-eosin stained section (Fig. 3A). Subsequently, the FIGPA technique is displayed in a stepwise fashion as the sum of FISH (Fig. 3B) and PLA (Fig. 3C) in combination simultaneously to reveal EGFR amplification at the genetic level is associated with high EGFR protein abundance (Fig. 3D). The in situ approach confirmed that EGFR gene information localized to the nucleus (and demonstrated a pattern consistent with double minutes in interphase cells13) and EGFR protein information in the cytoplasm with enrichment and saturation at the membrane.
Fig. 3.
FIGPA in paraffin-embedded tumor tissue. (A) Hematoxylin-and-eosin stain of glioblastoma sample. (B) FISH probe targeted for EGFR gene locus at chromosome 7p12 (red dots) and centromere of chromosome 7 (green dots). Insert: single cell nucleus showing this tumor to be highly amplified for EGFR at the genetic level. (C) PLA reliably captures EGFR protein expression at the cytoplasmic cell membrane and the cytoplasm. Nucleus counterstained with Hoechst 33342. Top, right insert: single cell with EGFR protein overexpression. Bottom, right insert: same cell as above with demarcated cytoplasmic (c) and nuclear (n) compartments. (D) Same tumor analyzed via FIGPA (green and red signals represent the FISH probes denoting the centromere of chromosome 7 and the EGFR gene locus, and Pacific Blue dye denotes EGFR protein expression), demonstrating that the EGFR gene is amplified and that EGFR protein expression is concordantly elevated. The protein signal captured via Pacific Blue protein detection dye (455 nm) shows a similar pattern as the protein signal captured via red dye (563 nm) in Panel c. Top, right insert: single cell with amplified EGFR gene locus and EGFR protein overexpression. Bottom, right insert: same cell as above with demarcated cytoplasmic (c) and nuclear (n) compartments. All magnifications ×400.
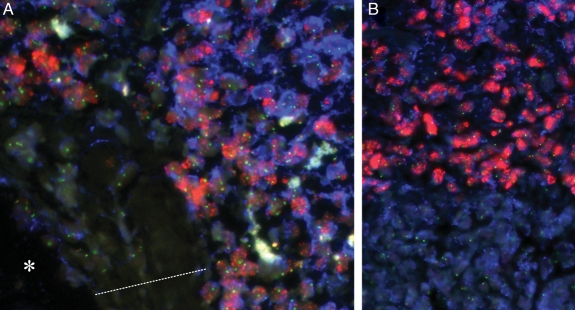
The reliability of FIGPA is evidenced by its ability to capture distinct gene and protein expression patterns for different cell types within cross-tumor sections. Figure 4A captures an area of tumor adjacent to a tumor blood vessel. Epithelial cells comprising the lumen wall are wild-type for EGFR gene dosage and show low levels of protein expression, serving as a control for the specificity of the technique. Distal to the lumen, the tumor cell population is highly amplified for EGFR at both the gene and protein levels. Within the tumor, the amplification of the EGFR gene and subsequent protein expression were highly correlated. FIGPA also highlighted molecular microenvironments and heterogeneity within the tumors (Fig. 4B). In Figure 4B, the area at the top is highly amplified for EGFR, while the area on the bottom shows wild-type status. Resolving the genetic and protein expression changes across the tumor may be helpful in understanding what drives the overall behavior of the tumor.
Fig. 4.
FIGPA captures tissue heterogeneity. (A) Tumor section near a tumor blood vessel highlights the specificity of FIGPA by revealing that EGFR amplification is confined to tumor cells and EGFR protein expression is high in tumor cells but virtually absent in cells of the tumor vessel wall. Asterisk (*) denotes the tumor vessel lumen, and the dotted line indicates the vessel wall. (B) Molecular heterogeneity within a glioblastoma tumor with one tumor cell population showing EGFR amplification and EGFR protein overexpression, and one population showing EGFR wild-type status. Green and red signals represent the FISH probes denoting the centromere of chromosome 7 and the EGFR gene locus, and Pacific Blue dye denotes EGFR protein expression. All magnifications ×400.
Discussion
Screening for predictive and prognostic markers is an emerging field in clinical cancer therapy. For example, determination of human epidermal growth factor receptor 2 (HER-2) status is now an integral part of the clinical-pathological workup of breast cancer. HER-2 protein overexpression is usually a direct consequence of gene amplification. This unique gene-protein relationship has spawned several methods for assessing HER-2 status, with the optimal testing methods under heated debate.14 Several HER-2 testing algorithms have been proposed, including screening by IHC and confirming indeterminate results with FISH, confirming both indeterminate and positive IHC results with FISH, or FISH alone as the primary screening test.14
No current test for molecular targets is absolute, and making a recommendation for or against the use of a molecular therapeutic based on a single test is debatable. Algorithm approaches that utilize parallel or sequential tissue-based profiling methods and take advantage of the strengths of different technologies will be especially important given the increasing number of prognostic and predictive biomarkers in oncology. FIGPA is a technique that obviates the need for such testing algorithms by being capable of concurrently visualizing and quantifying both gene dosage and protein expression in individual cells. It also has the potential to refine mechanistic hypotheses of gene expression (i.e., gene dosage and epigenetic regulation) and their impact on tumor biology.
In aggregate, the FIGPA technique offers the potential to test the correlation between gene dosage and protein expression in complex human diseases. Establishing correlations for specific genes may result in a greater understanding of gene expression and its regulation. We believe FIGPA has particular relevance to cancer research given implications of epigenetic and posttranscriptional regulation. The ability of FIGPA to concurrently capture and correlate gene and protein information in the same cells serves to increase the reliability of biomarker screens. It may particularly aid in therapeutic decision making in cases where screening for only the gene or the protein yields indeterminate results. Finally, FIGPA can be applied to genome-integrating transfection models where the researcher may want to study the efficiency of genome integration and its effect on target protein abundance. We thus envision broad applicability of FIGPA in disease-oriented and cell/molecular biology research.
Conflict of interest. The authors declare no conflict of interest.
Funding
This work was supported by State of Illinois Excellence in Academic Medicine (EAM) Award 211 and by State of Alabama Investment Pool for Action (IMPACT) Funds (to M.B.).
Acknowledgment
We are indebted to Dr. Paul Mischel (UCLA) for providing U87-EGFRvIII cells, Dr. Darell Bigner (Duke University) for providing the EGFRvIII antibody, L8A4, and OLINK Bioscience for providing the customized detection probe.
References
- 1.Soderberg O, Gullberg M, Jarvius M, et al. Direct observation of individual endogenous protein complexes in situ by proximity ligation. Nat Methods. 2006;3:995–1000. doi: 10.1038/nmeth947. doi:10.1038/nmeth947. [DOI] [PubMed] [Google Scholar]
- 2.Soderberg O, Leuchowius KJ, Gullberg M, et al. Characterizing proteins and their interactions in cells and tissues using the in situ proximity ligation assay. Methods. 2008;45:227–232. doi: 10.1016/j.ymeth.2008.06.014. doi:10.1016/j.ymeth.2008.06.014. [DOI] [PubMed] [Google Scholar]
- 3.Yadav AK, Renfrow JJ, Scholtens DM, et al. Monosomy of chromosome 10 associated with dysregulation of epidermal growth factor signaling in glioblastomas. JAMA. 2009;302:276–289. doi: 10.1001/jama.2009.1022. doi:10.1001/jama.2009.1022. [DOI] [PMC free article] [PubMed] [Google Scholar]
- 4.Dacic S, Flanagan M, Cieply K, et al. Significance of EGFR protein expression and gene amplification in non–small cell lung carcinoma. Am J Clin Pathol. 2006;125:860–865. doi: 10.1309/H5UW-6CPC-WWC9-2241. doi:10.1309/H5UW6CPCWWC92241. [DOI] [PubMed] [Google Scholar]
- 5.Hirsch FR, Varella-Garcia M, Bunn PA, Jr, et al. Epidermal growth factor receptor in non–small-cell lung carcinomas: correlation between gene copy number and protein expression and impact on prognosis. J Clin Oncol. 2003;21:3798–3807. doi: 10.1200/JCO.2003.11.069. doi:10.1200/JCO.2003.11.069. [DOI] [PubMed] [Google Scholar]
- 6.Wang X, Jones TD, Zhang S, et al. Amplifications of EGFR gene and protein expression of EGFR, Her-2/neu, c-kit, and androgen receptor in phyllodes tumor of the prostate. Mod Pathol. 2007;20:175–182. doi: 10.1038/modpathol.3800724. doi:10.1038/modpathol.3800724. [DOI] [PubMed] [Google Scholar]
- 7.Wang X, Zhang S, MacLennan GT, et al. Epidermal growth factor receptor protein expression and gene amplification in small cell carcinoma of the urinary bladder. Clin Cancer Res. 2007;13:953–957. doi: 10.1158/1078-0432.CCR-06-2167. doi:10.1158/1078-0432.CCR-06-2167. [DOI] [PubMed] [Google Scholar]
- 8.McLendon R, Friedman A, Bigner D, et al. Comprehensive genomic characterization defines human glioblastoma genes and core pathways. Nature. 2008;455:1061–1068. doi: 10.1038/nature07385. [DOI] [PMC free article] [PubMed] [Google Scholar]
- 9.Parsons DW, Jones S, Zhang X, et al. An integrated genomic analysis of human glioblastoma multiforme. Science. 2008;321:1087–1812. doi: 10.1126/science.1164382. [DOI] [PMC free article] [PubMed] [Google Scholar]
- 10.Nicholas MK, Lukas RV, Jafri NF, et al. Epidermal growth factor receptor–mediated signal transduction in the development and therapy of gliomas. Clin Cancer Res. 2006;12:7261–7270. doi: 10.1158/1078-0432.CCR-06-0874. doi:10.1158/1078-0432.CCR-06-0874. [DOI] [PubMed] [Google Scholar]
- 11.Wikstrand CJ, Hale LP, Batra SK, et al. Monoclonal antibodies against EGFRvIII are tumor specific and react with breast and lung carcinomas and malignant gliomas. Cancer Res. 1995;55:3140–3148. [PubMed] [Google Scholar]
- 12.Bredel M, Bredel C, Juric D, et al. High-resolution genome-wide mapping of genetic alterations in human glial brain tumors. Cancer Res. 2005;65:4088–4096. doi: 10.1158/0008-5472.CAN-04-4229. doi:10.1158/0008-5472.CAN-04-4229. [DOI] [PubMed] [Google Scholar]
- 13.Lopez-Gines C, Gil-Benso R, Ferrer-Luna R, et al. New pattern of EGFR amplification in glioblastoma and the relationship of gene copy number with gene expression profile. Mod Pathol. 2011;23:856–865. doi: 10.1038/modpathol.2010.62. doi:10.1038/modpathol.2010.62. [DOI] [PubMed] [Google Scholar]
- 14.Yaziji H, Goldstein LC, Barry TS, et al. HER-2 testing in breast cancer using parallel tissue-based methods. JAMA. 2004;291:1972–1977. doi: 10.1001/jama.291.16.1972. doi:10.1001/jama.291.16.1972. [DOI] [PubMed] [Google Scholar]


