

Abstract
Sequence–function relations for small RNA (sRNA)-mediated gene silencing were quantified for the sRNA RyhB and some of its mRNA targets in Escherichia coli. Numerous mutants of RyhB and its targets were generated and their in vivo functions characterized at various levels of target and RyhB expression. Although a core complementary region is required for repression by RyhB, variations in the complementary sequences of the core region gave rise to a continuum of repression strengths, correlated exponentially with the computed free energy of RyhB-target duplex formation. Moreover, sequence variations in the linker region known to interact with the RNA chaperone Hfq also gave rise to a continuum of repression strengths, correlated exponentially with the computed energy cost of keeping the linker region open. These results support the applicability of the thermodynamic model in predicting sRNA–mRNA interaction and suggest that sequences at these locations may be used to fine-tune the degree of repression. Surprisingly, a truncated RyhB without the Hfq-binding region is found to repress multiple targets of the wild-type RyhB effectively, both in the presence and absence of Hfq, even though the former is required for the activity of wild-type RyhB itself. These findings challenge the commonly accepted model concerning the function of Hfq in gene silencing—both in providing stability to the sRNAs and in catalyzing the target mRNAs to take on active conformations—and raise the intriguing question of why many endogenous sRNAs subject their functions to Hfq-dependences.
Keywords: gene regulation, noncoding RNA, posttranscriptional control, quantitative biology, RNA interaction
A significant development in gene regulation in the past decade is a growing appreciation of the complex roles that small regulatory RNA (sRNA) can play in coordinating gene activities in both prokaryotes and eukaryotes (1–3). In Escherichia coli, approximately 80 sRNA genes have been identified (3). There exists by now a basic understanding of the molecular components and mechanisms involved, at least for a major class of bacterial sRNA that acts in trans through base pairing (4–15). Recent theoretical and experimental studies have further revealed unique functional features of sRNA-mediated gene regulation (9, 16–20): because of the stoichiometric mode of target inactivation, sRNA-mediated regulation exhibits an abrupt and sensitive response to input signals while being robust to stochastic fluctuations.
How is this mode of regulation encoded in the molecular sequences of the sRNA and its targets? In the case of transcriptional regulation, a great deal is known quantitatively about the interaction between a DNA binding sequence (operator) and its cognate transcription factor (TF) and the regulatory consequences of this interaction: similarity of the operator to its “consensus sequence” determines its binding affinity to the cognate TF (21–24), and the latter in turn affects the rate of transcriptional initiation (25). Such knowledge, obtained by quantitative experimental studies of a few exemplary TFs decades ago (21–23), led to the later development of powerful bioinformatic approaches for the discovery of TF binding sites from genomic analysis (26), quantitative analysis of transcriptional regulation for complex promoters and even realistic modeling of promoter evolution (27, 28). Knowledge of sequence–function relation for sRNA-mediated gene regulation could lead to similar progress in bioinformatic identification of sRNA genes and their targets, in quantitative modeling of sRNA-mediated genetic circuits and their evolution.
Such sequence–function relation has been characterized to some extent for the best-studied class of bacterial sRNAs involving the RNA chaperon Hfq (1, 29). Members of this class include OxyS (4, 30), DsrA (5, 31), RyhB (6, 32), Spot42 (7), SgrS (8, 13), MicC (10), MicA (11), and MicF (12). Common structural features of these sRNAs include one or more target interaction regions, each contained in a hairpin loop, an unstructured Hfq-binding linker region, and a Rho-independent terminator at the 3′ end (1). Hfq binds to many mRNAs and sRNAs (33). It is known to protect some sRNAs and mRNAs from rapid degradation (11, 32, 34) and stimulate the interaction between various sRNAs and their targets (13, 30, 35, 36). Much work has gone into defining the interaction region of the sRNA, usually complementary to the translation initiation regions of the targets (1, 3, 29), although pairings in the coding sequence have also been reported recently (37, 38). Extensive in vivo characterization of sequence–function relation was performed on the repression of ptsG mRNA by the sRNA SgrS in response to sugar phosphate stress (13, 39). Scanning by single base substitution throughout the interaction region, a core interaction region consisting of six bases was identified to be required for exerting repression function (13), whereas replacement of bases flanking the core hardly affected repression (39). Similar results were echoed by studies in other systems (5, 10, 37, 38). Compared with the interaction region, the Hfq binding region has not been as extensively characterized, other than its preference for AU-rich sequences (30, 40).
Among the existing studies characterizing the sequence–function relation, most have been done at a qualitative level (i.e., whether a certain sRNA sequence repressed its targets). On the other hand, the threshold-linear response of sRNA-mediated regulation depends quantitatively on the energetics and kinetics of the sRNA-target interaction (16, 18), specified through the RNA sequences. Quantitative knowledge of the sequence–function relation may therefore lead to another layer of appreciation of how the sRNA systems work in vivo.
In this study, we took a first step toward quantifying the in vivo sequence–function relation, focusing on the regulation of sodB expression by the sRNA RyhB in E. coli. RyhB, expressed under low Fe2+ conditions and central to the iron homeostasis control (41), is one of the best-characterized members of the Hfq-dependent class of sRNA (1). sodB mRNA, encoding a superoxide dismutase expressed under the condition of high Fe2+ level, is one of the most prominent targets of RyhB (32, 41). To quantify the sequence determinants of RyhB–sodB interaction, we generated a large number of targeted mutants in both the interaction region and the Hfq-binding region and characterized the interactions of the mutants quantitatively using translational sodB-gfp fusion constructs, expressed under the control of a titratable promoter (16). The sequence–function relations obtained were then further correlated with the energetics of RyhB–sodB interaction through RNA secondary structure analysis. A plethora of results were obtained, including the graded nature of RyhB–sodB interaction, tunable by the composition of complementary sequences in the core interaction region and by the composition of the Hfq-binding region. Surprisingly, a truncated RyhB without the Hfq-binding region is found to be sufficient to repress targets of the wild-type RyhB, both in the presence and absence of Hfq. Implications of these results are discussed.
Results
RyhB has a distinct secondary structure consisting of three hairpin loops with the Hfq-binding linker (Fig. S1, Upper). The loop regions mediate interaction with different mRNA targets (1); Fig. S1 shows an example of the core contacts (red nucleotides) between RyhB and its most prominent target, the 5′ region of the sodB mRNA (32, 41).
To elucidate the sequence determinant of RyhB–sodB interaction, we generated mutations of RyhB and sodB in their respective control regions (SI Materials and Methods) and examined their effects on the repression of sodB expression using a strategy introduced earlier by Levine et al. (16). To quantify the degree of repression, we fused the 5′ UTR of each mutated sodB along with its first 11 codons, including the entire control region of sodB mRNA (Fig. S1), to the 5′ end of the gfp structural gene. The resulting fusion gene was incorporated into the pZE12S-series plasmid under the control of a synthetic PLlac-O1 promoter inducible by isopropyl β-d-thiogalactoside (IPTG). Analogously, each mutated ryhB gene was incorporated into the pZA31R-series plasmid under the control of a synthetic PLTet-O1 promoter inducible by anhydrotetracycline (aTc). pZE12S# and pZA31R# plasmids, harboring specific combinations of RyhB mutant and sodB mutant, respectively, were subsequently transformed into E. coli ZZS00 cells derived from K-12 BW25113, harboring constitutive expression of the regulators TetR and LacI and with the native ryhB gene deleted (16). In some cases we incorporated a PLTet-O1-driven ryhB or its mutant chromosomally and monitored their effects on the endogenous targets of RyhB using quantitative real-time PCR. Tables S1–S3 contain a summary of all of the strains, plasmids, and primers used. The sequence fragments corresponding to the various mutants of ryhB and sodB are listed in Tables S4–S6.
Graded Tuning of Repression.
Expression of the sodB-gfp fusion was quantified for each strain during exponential growth in glucose minimal medium containing varying levels of the inducers and appropriate antibiotics. First, we characterized the effect of a series of RyhB derivatives on IPTG-induced expression of the wild-type sodB-GFP. These derivatives (expressed in strains ZZS00-R1 to ZZS00-R11 and referred to as R1 to R11 for brevity), contain one to three mutations in positions corresponding to the middle hairpin of the wild-type RyhB structure (nucleotide positions 32 through 56) (Fig. S1 and Table S4). The fold-repression, defined as the ratio of sodB-GFP expressions obtained at 0 and 10 ng/mL aTc with 1 mM IPTG, is shown in Fig. 1A (data in Table S7) for each strain characterized. The results are clearly divided into two groups: a few derivatives (R6, R7, R9) gave ≈10-fold repression, similar to the wild-type RyhB (W), whereas the rest hardly showed any response. Inspection of the sequences (Table S4) reveals that none of the RyhB derivatives maintaining strong repression has any alteration of the core interaction region (red nucleotides in Fig. S1), whereas the ones showing no repression all have at least one substitution within the core. These results demonstrate that functional RyhB–sodB interaction can be disrupted by a single point substitution in the core (e.g., R1 and R5). We further verified that a single point substitution in the complementary region of sodB made it nonresponsive to wild-type RyhB, whereas compensating mutation restoring sequence complementarity restored repression (Fig. S2).
Fig. 1.

Regulation by mutants of RyhB and sodB. Bar graphs showing the degrees of repression by the R-mutants (A) and C-mutants (B). (C) Correlation of fold-repression with the computed duplex formation energy ΔE for RyhB-sodB mutant pairs (red circles) and the wild type (black circle). Solid black line is the best fit of the red and black circles to the form  with β-1 ≈1.9 kcal/mol. Dotted black line indicates the expected correlation according to the Boltzmann distribution. Horizontal dashed line indicates the lack of correlation for the R-mutants (green circles). The duplex formation energies are listed in Table S9.
To determine whether complementarity of the core interaction region is sufficient for repression, we generated a second group of mutations (strains ZZS00-C1 through ZZS00-C15, referred to as C1–C15) consisting of all 15 point substitutions at the two positions immediately 5′ to the start codon of sodB (indicated by the black box in Fig. S1), together with the complementary mutations at the corresponding RyhB positions (sequences listed in Table S5). These two positions were chosen because they do not overlap the known functional sites of sodB (i.e., the upstream Shine-Dalgarno sequence and the downstream start codon), which might significantly affect the translational efficiency of the sodB-gfp mRNA in ways unrelated to the sRNA. Surprisingly, the C-mutants showed a continuum degree of repression (Fig. 1B), between 1- and 10-fold. Thus, even for perfectly complementary core sequences, significant differences in expression can be easily generated through choices of the complementary bases. This differential expression is unlikely to be due to differences in the expression levels of the RyhB mutants, because most of the characterized mutants expressed at levels within two to threefold of the wild type, without noticeable correlation to the repression effects they exerted (Fig. S3, with data in Table S8).
Energetics of the RyhB–sodB Interaction.
The role that the energetics of RNA interaction may play in defining the regulatory properties of the sRNAs is not known, although the energetics is often used as a component in guiding bioinformatic searches of sRNA targets (42). To determine the extent to which the observed changes in sodB-GFP expression may be accounted for by the thermodynamics of RNA–RNA interaction, we computed the free energy of duplex formation, ΔE, defined as the difference between the free energy of the RyhB-sodB duplex (Eduplex) and the sum of the self-binding free energy of RyhB and the sodB control region (ERyhB and EsodB, respectively) for each mutant RyhB–sodB pair (SI Materials and Methods). The results are listed in Table S9.
We investigated possible correlations between this duplex formation energy and the measured fold-repression for the various mutants characterized. Out of the 15 mutants in the C-series, several were found to have reduced expression levels with altered self-binding energy even in the absence of RyhB (Fig. S4, with data in Table S10). This may be attributed to alternative secondary structures of the sodB mRNA formed in the vicinity of the start codon (Fig. S4), and the corresponding mutants were dropped from further analysis. The remaining nine sodB mutants exhibited expression very similar to that of the wild type in the absence of RyhB. Their interactions with the complementary RyhB mutants were examined by plotting the duplex formation energies (ΔE) with the degrees of repression (red and black circles in Fig. 1C). A clear exponential correlation (solid black line) is revealed, according to the form  with
with  . In contrast, no correlation is apparent between fold-repression and the other energy parameters of the system (Fig. S5).
We next consider the R-mutants. The duplex formation energies of these RyhB mutants with the wild-type sodB are listed in Table S9, and the correlation of these energies with the fold-repression of sodB-GFP expression measured in Fig. 1A are shown as the green circles in Fig. 1C. The three mutants with large fold-repression all have negative ΔE values below that of the wild type, consistent with the exponential correlation observed for the C-mutants (solid black line in Fig. 1C). However, the other R-series mutants (which contained at least one substitution in the core interaction region, as shown in Table S4) gave no repression regardless of their duplex formation energies (dashed black line in Fig. 1C). Taken together, these results indicate that thermodynamic binding strength is a predictor of sRNA functionality only if sequence complementarity in the core interaction region is uninterrupted.
Correlation of the Interaction Parameter with Interaction Energy.
For the mutant pairs showing exponential correlation between fold-repression and duplex formation energy (red circles in Fig. 1C), the dependence on energy is surprisingly weak compared with what would be naively expected (dotted black line in Fig. 1C) on the basis of the Boltzmann distribution of equilibrium thermodynamics at 37 °C. One possible cause of this discrepancy is that fold-repression does not directly reflect the strength of the sRNA–mRNA interaction. It was shown by Levine et al. (16) that gene expression regulated by noncatalytic sRNA exhibited a nonlinear, “threshold-linear” response. Specifically, for mRNA and sRNA transcribed at rates αm and αs, respectively, the output is expected to follow the form
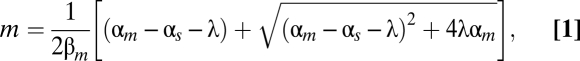 |
where λ is a “leakage” parameter describing the rate that the mRNA is not codegraded with the regulatory sRNA but by sRNA-independent basal mechanisms. According to thermodynamics, we expect λ to be inversely related to the sRNA–mRNA binding constant, such that  , where
  .
.
The parameter λ can be inferred for each mutant strain. To do so, we characterized the expression levels of sodB-GFP at various IPTG levels with aTc at either 0 or 10 ng/mL for a number of C-mutants (Fig. 2A). Following the analysis of ref. 16, we took the measured GFP expression with/without RyhB expression to be proportional to m and αm respectively. We then fitted the expression data to Eq. 1, using a single parameter αs (characterizing the degree of sRNA expression) for all of the strains and a strain-dependent λ (Table S11). The best-fit curves shown in Fig. 2A describe the expression data well. Plotting the deduced values of λ with the duplex formation energies ΔE again reveals an exponential correlation,  , with
  (solid black line in Fig. 2B). The result is, however, still substantially different from the thermodynamic expectation (dotted black line).
Fig. 2.

Repression characteristics by RyhB and the energetics of RyhB–sodB interaction. (A) sodB-GFP expressions in the presence and absence of RyhB are shown in the plot, for different degrees of inducer-controlled sodB-GFP expression. Data for each mutant RyhB-sodB pair are indicated by a different set of symbol and color. Lines of corresponding colors indicate the results of fitting to Eq. 1. The best-fit value of  nM/min is comparable to the results of ref. 18 at the same level of RyhB induction. Best-fit values of λ are listed in Table S11. Diagonal gray line indicates the absence of repression. (B) Correlation between the RyhB–sodB duplex formation energy ΔE and the interaction parameters λ obtained from the fits shown in A. Solid black line indicates the best fit of the results to the exponential form
  with β-1≈1.3 kcal/mol. Dotted black line indicates the expected correlation according to the Boltzmann distribution.
Effect of the Hfq-Binding Region.
We next examined the effect of mutated sequences in the Hfq-binding region on the function of RyhB. Hfq is required for gene silencing by RyhB (6, 35), and the AU-rich linker region that Hfq binds to has been used as a cue in the bioinformatic search of sRNA genes (43, 44). We generated the H-series mutants (H1–H19) by varying the 12 bases at positions 57–68 of RyhB, which are shown as the blue bases between the second and third hairpin in Fig. S1; the sequences are given in Table S6. The expression levels of a number of H-mutants were characterized and found comparable to the wild-type RyhB (Fig. S3). The effects of these mutants on the expression of the wild-type sodB-GFP reporter were characterized next. Because the mutated linker region is involved in RyhB–Hfq interaction but away from the region where wild-type RyhB interacts with its targets, one might expect differences in sodB-GFP expression to reflect primarily functional effects of the RyhB–Hfq interaction, including the known effect of Hfq on RyhB stability (32, 34) and possibly also the proposed effect of Hfq on RyhB–sodB interaction (35). As shown in Fig. 3A, the H-mutants exhibited >10-fold difference in their abilities to repress the target sodB-gfp (at 1 mM IPTG induction). Fold-repression for most of the mutants correlated exponentially with the energy cost ( ) of keeping the linker region open (data in Table S12, SI Materials and Methods gives the definition and calculation of
  ). This finding is consistent with the expectation that RyhB function requires the binding of Hfq to the linker region, because the accessibility of the linker region (and hence the association of the Hfq to the linker) is expected to be an exponentially decreasing function of
  according to thermodynamics.
Fig. 3.

Effects of RNA–Hfq interactions. A series of 19 RyhB mutants was constructed by random oligosynthesis. Each of these mutants has a number of bases in the linker region (positions 57–68 in Fig. S1) replaced by a different base. (A) The repressive effect of these mutant RyhBs on sodB-GFP expression (induced by 1 mM IPTG) is seen to correlate well with the energy cost ( ) of keeping the 12-base linker region open. (B) The minimal free energy structure of the mutant RyhB-rh11 expressed in strain ZZS00-H11. This mutant gave strong repression (13.7×) despite a large value of
  . The structure of this mutant is predicted to have the interaction region completely open. The bases are colored by the same color scheme as that used in Fig. S1; the substituted bases are circled.
It is interesting to examine the mutants deviating from the exponential correlation. In principle, with enough mutations in the linker region the secondary structure of the molecule can be significantly altered, making its function uncorrelated to the accessibility of the linker. The effect is likely to reduce the activity of the mutant, because the altered structure may not have its interaction region exposed; additionally, unprotected RNAs are known to degrade rapidly (32, 34). It is therefore rather intriguing to find a mutant (H11) that repressed sodB-GFP even more strongly than the wild type, despite a rather high linker opening cost. This mutant (RyhB-rh11) has five substitutions in the linker region (Table S6). Inspection of its minimal free energy structure (Fig. 3B) reveals that indeed its secondary structure may be significantly altered, with the linker region predicted to base pair with the first hairpin (positions 21–30) of the wild-type RyhB structure (Fig. S1). Interestingly, the interaction region of this mutant (red bases in Fig. 3B) remains open in the minimal free energy structure despite significant rearrangement of the structure elsewhere. The high abundance of the H11 mutant (Fig. S3) and its ability to repress target expression raise questions regarding the necessity of an accessible linker region.
Function of the Truncated RyhB.
We performed experiments to test the necessity of the Hfq-binding region in mediating RyhB's function. A truncated RyhB mutant (RyhBt) was constructed, removing the entire linker region (position 57–68) as well as the first hairpin (position 1–31) from the wild-type structure shown in Fig. S1. We chose this sequence because a minimal free energy structure of this sequence (Fig. 4A), consisting of the second hairpin (positions 32–56) of the wild-type structure with the exposed interaction region (red bases) followed immediately by the Rho-independent terminator (positions 69–90), preserves the core interaction part of RyhB. We incorporated RyhBt into the pZA31 plasmid (pZA31Rt) and characterized its effect on the expression of wild-type sodB-GFP in strain ZZS00-Rt. RyhBt is seen to exhibit strong repression, at levels comparable to the effect of wild-type RyhB in strain ZZS00-W, across the range of target expression (Fig. S6). Thus, the linker region seems to be dispensable for the repressive effect of RyhB on sodB-GFP.
Fig. 4.

Functional effects exerted by the truncated RyhB. (A) Predicted minimal free-energy structure of the mutant RyhBt, which is truncated of the first hairpin and the linker region of the wild-type RyhB (Fig. S1). (B) Relative expression of the chromosomally encoded RyhB and RyhBt in hfq+ (blue and red bars) and hfq− background (green and black bars). (C and D) Effect of chromosomally expressed RyhB and RyhBt on the expression of various endogenous targets (sodB, fumA, sdhD, and sucA) in hfq+ strains (C) and hfq− strains (D). sRNA and mRNA abundances were determined using quantitative real-time PCR in strains harboring chromosomal PLTet-o1:ryhB (strain ZZS0R, ZZS0Rq, blue and green bars) or PLTet-o1:ryhBt (strain ZZS0T, ZZS0Tq, red and black bars). Open and solid bars refer to results from cells grown with 10 ng/mL and no aTc, respectively. For each RNA species characterized, the abundance was normalized to the level of 16S RNA (encoded by rrsB), which is relatively constant in the different strains and conditions. In C and D the mRNA abundances were given relative to the mRNA level in strain ZZS0T grown with no aTc. The numerical values are listed in Tables S13, S14, and S15.
To determine whether this surprising effect persists at lower levels of RyhBt expression, we constructed strains ZZS0R and ZZS0T, harboring chromosomally encoded ryhB and ryhBt, respectively, both driven by the PLtet-O1 promoter (Table S1). The expression levels of RyhB and RyhBt under full aTc induction are found to be comparable as characterized by quantitative real-time PCR (blue and red bars in Fig. 4B). We next used quantitative real-time PCR to quantify the effect of RyhBt on the expression of sodB, fumA, and sdhD, which are all well-established endogenous targets of RyhB (6). As shown in Fig. 4C, RyhBt repressed these targets 20-fold, 10-fold, and 5-fold, respectively (red bars); the degrees of repression in fact exceeded those of the wild-type RyhB (blue bars) for each target. As a negative control, neither RyhB nor RyhBt repressed the expression of sucA, which is in the same operon as sdhD but is not known to be a target of RyhB.
We further tested the role of Hfq in mediating repression by RyhB and RyhBt, using strains ZZS0Rq and ZZS0Tq, respectively, both of which contain hfq deletion (Table S1). As expected (6, 32, 34), RyhB exhibited no repression effect to any of the tested targets in hfq− background (green bars in Fig. 4D). However, RyhBt remains active (black bars), repressing each of the RyhB targets but not the nontarget sucA, at a similar level as that found in hfq+ background (red bars in Fig. 4C). Quantitation of the levels of RyhB and RyhBt reveals that in hfq− background, RyhBt remained expressed at the same level, but the level of RyhB dropped significantly compared with that in hfq+ background (Fig. 4B, black and green bars). The latter is consistent with the known instability of RyhB in hfq− background (32, 34), whereas the former reaffirms the observed activity of RyhBt in hfq− background.
Discussion
Predictive understanding of the sequence–function relation is one of the grand challenges of systems biology. In the case of transcriptional control, a great deal is understood owing to quantitative molecular studies of protein–DNA interaction pioneered by von Hippel and collaborators (21). Even though such sequence–function relations were established only for a few exemplary systems (21–23), firm knowledge on these systems stimulated a large body of later computational work to identify and characterize TF binding sites across the genomes of organisms in the postgenome era (26).
In this work, we intended to probe a similar sequence–function relation for the interaction between sRNAs and their targets using an exemplary sRNA–mRNA system in vivo. We chose RyhB and sodB of E. coli, both well characterized at the molecular and biochemical levels. Three series of mutants were generated: the R-series featuring mutants of RyhB in the vicinity of the core interaction region, the C-series featuring mutated but complementary sequences of RyhB and sodB-gfp translational fusion within the core interaction region, and the H-series featuring RyhB mutants in the Hfq-binding linker region (Fig. S1). For each mutant series, we characterized the expressions of a selected number of mutants (Fig. S3) and quantified the activity of each mutant on target expression using sodB-GFP reporters. The gene expression levels were then correlated to various energetic characteristics calculated according to the available RNA-folding algorithms.
Sequence Dependence of sRNA Function.
The R-mutants showed that one or more mismatches in the core interaction region of RyhB resulted in the complete loss of its repression on sodB-GFP expression, whereas point substitutions in the immediate vicinity of the core may have no effect on repression (Fig. 1A). The lost function due to mutation in the core of either RyhB or sodB can be restored by complementary changes in the target sequence (Fig. S2). These findings reinforce earlier results on the SgrS-ptsG system by Aiba and collaborators (13, 39). In the present study, we find additionally that when the core sequence is perturbed, sRNA–mRNA binding energy is not a good predictor of functionality (green symbols in Fig. 1C).
The C-mutants surprisingly exhibited a continuum of repression. It is generally believed that a complementary core along with other supplemental features of the sRNA (e.g., a hairpin and an Hfq binding region) is sufficient to silence its target mRNA (1). Our results suggest instead that the identities of the complementary core nucleotides can be used to tune the strength of sRNA–mRNA interaction over a relevant range. For example, strain C8, containing a single pair of changes (C:G to A:U) compared with the wild type, exhibited only a twofold repression compared with 8.5-fold repression by the wild type.
Energetics of RNA–RNA Interaction.
The difference between C:G and A:U pairing suggests a role exerted by the pairing energy between RyhB and sodB. The computed free energy of the RyhB-sodB duplex formation, a key intermediate in RyhB-mediated repression (32, 35), exhibits a clear exponential correlation with the fold-repression of the corresponding RyhB-sodB pair (Fig. 1C, red circles and solid black line). The exponential dependence is qualitatively consistent with the expectation that the RyhB–sodB interaction is dominated by the thermodynamics of RNA binding. However, the slope of the solid black line describing the exponential dependence is much smaller than that expected of the Boltzmann distribution at 37 °C (Fig. 1C, dotted black line). To further characterize the energy dependence, gene expression was characterized more quantitatively for a number of the C-mutants to quantify the interaction parameters (Fig. 2A). The results (Fig. 2B) still exhibited an exponential correlation (solid black line) and still deviated significantly from the Boltzmann distribution (dotted black line), which would be expected for an interaction driven by the thermodynamics of base pairing.
The quantitative discrepancy between the observed energy dependence of interaction is rather surprising from the perspective of molecular biophysics but is quite reasonable from the biological perspective. According to the Boltzmann distribution, there would be a 10-fold change in interaction for every 1.5 kcal/mole increase in the duplex formation energy. This would be a very large change: the smallest energy difference between two nucleotide pairings (e.g., from A:U to U:A) already involves 1 kcal/mole difference in binding energy (45). On the other hand, with the observed correlations, the degree of repression can be tuned over the functionally relevant regime (10- to 20-fold) from the choices of multiple base pairings.
The origin of the discrepancy from the Boltzmann form of energy dependence is not understood. It could be that the RyhB–sodB interaction was not describable by thermodynamics in vivo, in which case, however, the existence of the exponential correlation with equilibrium energy values would be perplexing. Another possibility is that the energy values used in RNA folding calculations, obtained from in vitro experiments, were systematically overestimated. In fact, in a few studies in which the results of RNA folding calculations can be compared directly to in vivo activities studied (46–48), a systematic two- to threefold overestimation of RNA binding energies has been reported. This may account for the discrepancies we observed, because the differences in the slopes of the dotted and solid lines in Figs. 1C and 2B are also two- to threefold.
Role of Hfq and Hfq-Binding Sequence.
The H-mutants show that gradual tuning of the degree of repression (from 1- to 20-fold) can also be realized by changing the bases in the linker region (Fig. 3A), away from the hairpin involved in interaction with the targets. The exponential correlation of the fold-repression with the computed energy cost of opening the linker region is consistent with the notion that the binding of Hfq to the linker region is necessary for RyhB–sodB interaction. Regardless of the possible causes (see below), the gradual dependence of the degree of repression on the linker sequence provides another means to fine-tune the interaction. We note that tuning of the interaction strength by base changes in the linker region may be a more evolvable strategy compared with base changes in the interaction region (C-mutants), because the latter requires changes in both the sRNA and the mRNA, possibly even changes in multiple targets if the same base-pairing region is used for different targets.
Puzzling behavior exhibited by the mutant H11 led us to construct the truncated RyhB mutant, RyhBt, whose structure is expected to contain a hairpin with the open interaction region (Fig. 4A). Characterization of the functional effect of RyhBt, both the plasmid and chromosomally encoded versions, led to a number of surprises: first, direct characterization of RyhB and RyhBt levels (Fig. 4B) establishes that the level of RyhBt, which is comparable to that of RyhB in the wild-type background, is independent of Hfq. Thus, it is the Hfq-binding region that makes the wild-type RyhB unstable in hfq− strain. This finding is consistent with the knowledge that the AU-rich linker sequence is also the binding target of RNaseE, which degrades RNAs (32, 34), and the notion that the binding of Hfq to this region protects the RNA from cleavage. Without this RNaseE binding sequence, apparently protection by Hfq is not necessary, at least for RyhB.
Second, the Hfq-binding region of RyhB is apparently not needed for function (Figs. 4 C and D). Even in the presence of Hfq, where both RyhB and RyhBt can function, RyhBt is found to repress the endogenous RyhB targets† more strongly than RyhB itself for all of the cases studied (Fig. 4C), even though the expression levels of RyhB and RyhBt are comparable (Fig. 4B). Although the dependence of wild-type RyhB's function on Hfq is well known and attributed to the higher turnover rate of RyhB in hfq− strain (32), it is remarkable that RyhBt repressed the endogenous RyhB targets to the same degree with or without Hfq (Fig. 4 C and D). In Vibrio cholerae, the sRNA VrrA was shown to reduce the level of its target OmpA in hfq− background when overexpressed, although the degree of repression was weaker than that in hfq+ background (49). Recently, it was also shown that positive regulation of the rpoS mRNA by the sRNA DsrA occurred in the absence of Hfq when DsrA was overexpressed (50). These findings led to the views that Hfq might not be essential under high concentrations of sRNA (3, 50) or under conditions whereby the sRNA and its target could form a stable complex on their own (50). In the case of RyhBt, we see that overexpression of the sRNA is not even necessary. The dependence of sRNA-mediated gene silencing has been reported for many sRNAs studied and has been used as a defining feature of this class of sRNAs (29). Because the activity of RyhBt does not require Hfq, obvious questions are raised concerning the necessity and function of the linker region (and consequently the reliance on Hfq) in these Hfq-binding bacterial sRNAs.
The independence of RyhBt's function on Hfq has another strong implication. It has been established in vitro that Hfq modifies the secondary structure of sodB by opening up the RyhB-binding region (35), and it is commonly assumed that this effect is important for RyhB repression on its targets in vivo. Enhancement of base pairing between sRNAs and target mRNAs by Hfq has also been shown in numerous other cases of sRNA-mediated repression, including Spot42–galK (7), MicA–ompA (11), SgrS–ptsG (13), and OxyS–fhlA (30). Together, these results project a model in which Hfq functions as a RNA chaperone mediating sRNA–mRNA interaction. Our results show that, at least for sodB, fumA, and sdhD, Hfq-target interaction is not necessary for repression by RyhBt.
Materials and Methods
Strains and Plasmids.
We constructed a series of reporter systems to quantify the RyhB–sodB interaction as in ref. 16. Experiments were performed in ZZS00 cells (16). Two types of plasmids, one carrying ryhB or its mutant (pZA31R#) and the other carrying the translational fusion of sodB (or its mutant) with the reporter gene gfpmut3b (pZE12S#), were transformed into ZZS00 to generate three series of mutant strains ZZS00-R#, ZZS00-C#, and ZZS00-H# (Table S1). In some cases, the wild-type ryhB and the truncated ryhB (ryhBt) in respective pZA31R and pZA31Rt plasmids were integrated into the ryhB locus of the chromosome.
Medium, Growth, Measurements.
The ZZS00 cells carrying the appropriate plasmids were grown to mid-log phase in M63 minimal media at 37 °C with 0.5% glucose and the appropriate antibiotics. The cells were diluted (1:250) to fresh media and shaken overnight. The cultures were diluted into fresh M63 media (OD600=0.002) containing the antibiotics and carbon source, as well as varying amounts of the inducers (aTc and IPTG) in wells of 48-well plates. The plates were incubated with shaking at 37 °C and examined for OD600 and fluorescence measurements every 0.5–1 h for up to 10 h. Each measurement was repeated three times, and the data were analyzed similarly as in ref. 16. For real-time PCR analyses, total RNA was prepared using a Qiagen RNeasy Mini-prep kit or a miRNeasy Mini Kit. RNA samples were treated with the Ambion Turbo DNA-free DNase. Either a dilution series of RNA was used, or 50 ng RNA (for target genes) and 0.5 ng RNA (for rrsB) were used for cDNA synthesis and amplification reaction using the Bio-Rad One-Step RT-PCR Kit. Real-time PCR was performed in the Bio-Rad iQ5 Real Time PCR System. See all details in SI Materials and Methods.
Supplementary Material
Acknowledgments
T.H. thanks Han Lim for helpful suggestions on qRT-PCR, and H.S. thanks Zhongcan Ouyang, Weimou Zheng for support. This work was supported by National Institutes of Health Grant R01-GM77298 (to T.H.), National Natural Science Foundation of China Grants 10428409 and 90403140, and National Basic Research Program of China Grant 2007CB814800 (to H.S.).
Footnotes
The authors declare no conflict of interest.
*This Direct Submission article had a prearranged editor.
This article contains supporting information online at www.pnas.org/lookup/suppl/doi:10.1073/pnas.1100432108/-/DCSupplemental.
†The repression of sdhD by the truncated RyhB is worth noting. It was pointed out long ago (6) that the wild-type RyhB contained sequence with extended complementarity to the translational initiation region of sdhD, the second gene of the sdhCDAB operon. In fact, the region of RyhB complementary to the translational initiation region is contained in the first hairpin of RyhB, which is deleted from RyhBt. Our results suggest that the second hairpin, which has a 10-nt continuous match with the region ending 13 nucleotides upstream of the sdhD Shine-Dalgarno sequence, is sufficient to repress sdhD. Base pairing at a distance of 10–15 nt downstream of the start codon was reported to be sufficient for repression (37). Apparently, similar action could also be accomplished upstream, as encountered here.
References
- 1.Gottesman S. The small RNA regulators of Escherichia coli: Roles and mechanisms. Annu Rev Microbiol. 2004;58:303–328. doi: 10.1146/annurev.micro.58.030603.123841. [DOI] [PubMed] [Google Scholar]
- 2.Flynt AS, Lai EC. Biological principles of microRNA-mediated regulation: shared themes amid diversity. Nat Rev Genet. 2008;9:831–842. doi: 10.1038/nrg2455. [DOI] [PMC free article] [PubMed] [Google Scholar]
- 3.Waters LS, Storz G. Regulatory RNAs in bacteria. Cell. 2009;136:615–628. doi: 10.1016/j.cell.2009.01.043. [DOI] [PMC free article] [PubMed] [Google Scholar]
- 4.Altuvia S, Weinstein-Fischer D, Zhang A, Postow L, Storz G. A small, stable RNA induced by oxidative stress: Role as a pleiotropic regulator and antimutator. Cell. 1997;90:43–53. doi: 10.1016/s0092-8674(00)80312-8. [DOI] [PubMed] [Google Scholar]
- 5.Majdalani N, Cunning C, Sledjeski D, Elliott T, Gottesman S. DsrA RNA regulates translation of RpoS message by an anti-antisense mechanism, independent of its action as an antisilencer of transcription. Proc Natl Acad Sci USA. 1998;95:12462–12467. doi: 10.1073/pnas.95.21.12462. [DOI] [PMC free article] [PubMed] [Google Scholar]
- 6.Massé E, Gottesman S. A small RNA regulates the expression of genes involved in iron metabolism in Escherichia coli. Proc Natl Acad Sci USA. 2002;99:4620–4625. doi: 10.1073/pnas.032066599. [DOI] [PMC free article] [PubMed] [Google Scholar]
- 7.Møller T, Franch T, Udesen C, Gerdes K, Valentin-Hansen P. Spot 42 RNA mediates discoordinate expression of the E. coli galactose operon. Genes Dev. 2002;16:1696–1706. doi: 10.1101/gad.231702. [DOI] [PMC free article] [PubMed] [Google Scholar]
- 8.Vanderpool CK, Gottesman S. Involvement of a novel transcriptional activator and small RNA in post-transcriptional regulation of the glucose phosphoenolpyruvate phosphotransferase system. Mol Microbiol. 2004;54:1076–1089. doi: 10.1111/j.1365-2958.2004.04348.x. [DOI] [PubMed] [Google Scholar]
- 9.Lenz DH, et al. The small RNA chaperone Hfq and multiple small RNAs control quorum sensing in Vibrio harveyi and Vibrio cholerae. Cell. 2004;118:69–82. doi: 10.1016/j.cell.2004.06.009. [DOI] [PubMed] [Google Scholar]
- 10.Chen S, Zhang A, Blyn LB, Storz G. MicC, a second small-RNA regulator of Omp protein expression in Escherichia coli. J Bacteriol. 2004;186:6689–6697. doi: 10.1128/JB.186.20.6689-6697.2004. [DOI] [PMC free article] [PubMed] [Google Scholar]
- 11.Rasmussen AA, et al. Regulation of ompA mRNA stability: The role of a small regulatory RNA in growth phase-dependent control. Mol Microbiol. 2005;58:1421–1429. doi: 10.1111/j.1365-2958.2005.04911.x. [DOI] [PubMed] [Google Scholar]
- 12.Vogel J, Papenfort K. Small non-coding RNAs and the bacterial outer membrane. Curr Opin Microbiol. 2006;9:605–611. doi: 10.1016/j.mib.2006.10.006. [DOI] [PubMed] [Google Scholar]
- 13.Kawamoto H, Koide Y, Morita T, Aiba H. Base-pairing requirement for RNA silencing by a bacterial small RNA and acceleration of duplex formation by Hfq. Mol Microbiol. 2006;61:1013–1022. doi: 10.1111/j.1365-2958.2006.05288.x. [DOI] [PubMed] [Google Scholar]
- 14.Gerdes K, Wagner EG. RNA antitoxins. Curr Opin Microbiol. 2007;10:117–124. doi: 10.1016/j.mib.2007.03.003. [DOI] [PubMed] [Google Scholar]
- 15.Papenfort K, et al. Specific and pleiotropic patterns of mRNA regulation by ArcZ, a conserved, Hfq-dependent small RNA. Mol Microbiol. 2009;74:139–158. doi: 10.1111/j.1365-2958.2009.06857.x. [DOI] [PubMed] [Google Scholar]
- 16.Levine E, Zhang Z, Kuhlman T, Hwa T. Quantitative characteristics of gene regulation by small RNA. PLoS Biol. 2007;5:e229. doi: 10.1371/journal.pbio.0050229. [DOI] [PMC free article] [PubMed] [Google Scholar]
- 17.Shimoni Y, et al. Regulation of gene expression by small non-coding RNAs: A quantitative view. Mol Syst Biol. 2007;3:138. doi: 10.1038/msb4100181. [DOI] [PMC free article] [PubMed] [Google Scholar]
- 18.Levine E, Hwa T. Small RNAs establish gene expression thresholds. Curr Opin Microbiol. 2008;11:574–579. doi: 10.1016/j.mib.2008.09.016. [DOI] [PMC free article] [PubMed] [Google Scholar]
- 19.Mehta P, Goyal S, Wingreen NS. A quantitative comparison of sRNA-based and protein-based gene regulation. Mol Syst Biol. 2008;4:221. doi: 10.1038/msb.2008.58. [DOI] [PMC free article] [PubMed] [Google Scholar]
- 20.Mitarai N, et al. Dynamic features of gene expression control by small regulatory RNAs. Proc Natl Acad Sci USA. 2009;106:10655–10659. doi: 10.1073/pnas.0901466106. [DOI] [PMC free article] [PubMed] [Google Scholar]
- 21.Berg OG, von Hippel PH. Selection of DNA binding sites by regulatory proteins. II. The binding specificity of cyclic AMP receptor protein to recognition sites. J Mol Biol. 1988;200:709–723. doi: 10.1016/0022-2836(88)90482-2. [DOI] [PubMed] [Google Scholar]
- 22.Betz JL, Sasmor HM, Buck F, Insley MY, Caruthers MH. Base substitution mutants of the lac operator: In vivo and in vitro affinities for lac repressor. Gene. 1986;50:123–132. doi: 10.1016/0378-1119(86)90317-3. [DOI] [PubMed] [Google Scholar]
- 23.Fields DS, He Y, Al-Uzri AY, Stormo GD. Quantitative specificity of the Mnt repressor. J Mol Biol. 1997;271:178–194. doi: 10.1006/jmbi.1997.1171. [DOI] [PubMed] [Google Scholar]
- 24.Gerland U, Moroz JD, Hwa T. Physical constraints and functional characteristics of transcription factor-DNA interaction. Proc Natl Acad Sci USA. 2002;99:12015–12020. doi: 10.1073/pnas.192693599. [DOI] [PMC free article] [PubMed] [Google Scholar]
- 25.Bintu L, et al. Transcriptional regulation by the numbers: Models. Curr Opin Genet Dev. 2005;15:116–124. doi: 10.1016/j.gde.2005.02.007. [DOI] [PMC free article] [PubMed] [Google Scholar]
- 26.Sahota G, Stormo GD. Novel sequence-based method for identifying transcription factor binding sites in prokaryotic genomes. Bioinformatics. 2010;26:2672–2677. doi: 10.1093/bioinformatics/btq501. [DOI] [PMC free article] [PubMed] [Google Scholar]
- 27.Gerland U, Hwa T. On the selection and evolution of regulatory DNA motifs. J Mol Evol. 2002;55:386–400. doi: 10.1007/s00239-002-2335-z. [DOI] [PubMed] [Google Scholar]
- 28.Mustonen V, Lässig M. Evolutionary population genetics of promoters: predicting binding sites and functional phylogenies. Proc Natl Acad Sci USA. 2005;102:15936–15941. doi: 10.1073/pnas.0505537102. [DOI] [PMC free article] [PubMed] [Google Scholar]
- 29.Aiba H. Mechanism of RNA silencing by Hfq-binding small RNAs. Curr Opin Microbiol. 2007;10:134–139. doi: 10.1016/j.mib.2007.03.010. [DOI] [PubMed] [Google Scholar]
- 30.Zhang A, Wassarman KM, Ortega J, Steven AC, Storz G. The Sm-like Hfq protein increases OxyS RNA interaction with target mRNAs. Mol Cell. 2002;9:11–22. doi: 10.1016/s1097-2765(01)00437-3. [DOI] [PubMed] [Google Scholar]
- 31.Sledjeski DD, Whitman C, Zhang A. Hfq is necessary for regulation by the untranslated RNA DsrA. J Bacteriol. 2001;183:1997–2005. doi: 10.1128/JB.183.6.1997-2005.2001. [DOI] [PMC free article] [PubMed] [Google Scholar]
- 32.Massé E, Escorcia FE, Gottesman S. Coupled degradation of a small regulatory RNA and its mRNA targets in Escherichia coli. Genes Dev. 2003;17:2374–2383. doi: 10.1101/gad.1127103. [DOI] [PMC free article] [PubMed] [Google Scholar]
- 33.Sittka A, et al. Deep sequencing analysis of small noncoding RNA and mRNA targets of the global post-transcriptional regulator, Hfq. PLoS Genet. 2008;4:e1000163. doi: 10.1371/journal.pgen.1000163. [DOI] [PMC free article] [PubMed] [Google Scholar]
- 34.Moll I, Afonyushkin T, Vytvytska O, Kaberdin VR, Bläsi U. Coincident Hfq binding and RNase E cleavage sites on mRNA and small regulatory RNAs. RNA. 2003;9:1308–1314. doi: 10.1261/rna.5850703. [DOI] [PMC free article] [PubMed] [Google Scholar]
- 35.Geissmann TA, Touati D. Hfq, a new chaperoning role: Binding to messenger RNA determines access for small RNA regulator. EMBO J. 2004;23:396–405. doi: 10.1038/sj.emboj.7600058. [DOI] [PMC free article] [PubMed] [Google Scholar]
- 36.Soper TJ, Woodson SA. The rpoS mRNA leader recruits Hfq to facilitate annealing with DsrA sRNA. RNA. 2008;14:1907–1917. doi: 10.1261/rna.1110608. [DOI] [PMC free article] [PubMed] [Google Scholar]
- 37.Bouvier M, Sharma CM, Mika F, Nierhaus KH, Vogel J. Small RNA binding to 5′ mRNA coding region inhibits translational initiation. Mol Cell. 2008;32:827–837. doi: 10.1016/j.molcel.2008.10.027. [DOI] [PubMed] [Google Scholar]
- 38.Pfeiffer V, Papenfort K, Lucchini S, Hinton JC, Vogel J. Coding sequence targeting by MicC RNA reveals bacterial mRNA silencing downstream of translational initiation. Nat Struct Mol Biol. 2009;16:840–846. doi: 10.1038/nsmb.1631. [DOI] [PubMed] [Google Scholar]
- 39.Maki K, Morita T, Otaka H, Aiba H. A minimal base-pairing region of a bacterial small RNA SgrS required for translational repression of ptsG mRNA. Mol Microbiol. 2010;76:782–792. doi: 10.1111/j.1365-2958.2010.07141.x. [DOI] [PubMed] [Google Scholar]
- 40.Brennan RG, Link TM. Hfq structure, function and ligand binding. Curr Opin Microbiol. 2007;10:125–133. doi: 10.1016/j.mib.2007.03.015. [DOI] [PubMed] [Google Scholar]
- 41.Massé E, Vanderpool CK, Gottesman S. Effect of RyhB small RNA on global iron use in Escherichia coli. J Bacteriol. 2005;187:6962–6971. doi: 10.1128/JB.187.20.6962-6971.2005. [DOI] [PMC free article] [PubMed] [Google Scholar]
- 42.Backofen R, Hess WR. Computational prediction of sRNAs and their targets in bacteria. RNA Biol. 2010;7:33–42. doi: 10.4161/rna.7.1.10655. [DOI] [PubMed] [Google Scholar]
- 43.Kulkarni RV, Kulkarni PR. Computational approaches for the discovery of bacterial small RNAs. Methods. 2007;43:131–139. doi: 10.1016/j.ymeth.2007.04.001. [DOI] [PubMed] [Google Scholar]
- 44.Chang TH, et al. Prediction of small non-coding RNA in bacterial genomes using support vector machines. Expert Syst Appl. 2010;37:5549–5557. [Google Scholar]
- 45.Mathews DH, Burkard ME, Freier SM, Wyatt JR, Turner DH. Predicting oligonucleotide affinity to nucleic acid targets. RNA. 1999;5:1458–1469. doi: 10.1017/s1355838299991148. [DOI] [PMC free article] [PubMed] [Google Scholar]
- 46.Walton SP, Stephanopoulos GN, Yarmush ML, Roth CM. Prediction of antisense oligonucleotide binding affinity to a structured RNA target. Biotechnol Bioeng. 1999;65:1–9. [PubMed] [Google Scholar]
- 47.Walton SP, Stephanopoulos GN, Yarmush ML, Roth CM. Thermodynamic and kinetic characterization of antisense oligodeoxynucleotide binding to a structured mRNA. Biophys J. 2002;82:366–377. doi: 10.1016/S0006-3495(02)75401-5. [DOI] [PMC free article] [PubMed] [Google Scholar]
- 48.Lu ZJ, Mathews DH. Fundamental differences in the equilibrium considerations for siRNA and antisense oligodeoxynucleotide design. Nucleic Acids Res. 2008;36:3738–3745. doi: 10.1093/nar/gkn266. [DOI] [PMC free article] [PubMed] [Google Scholar]
- 49.Song T, et al. A new Vibrio cholerae sRNA modulates colonization and affects release of outer membrane vesicles. Mol Microbiol. 2008;70:100–111. doi: 10.1111/j.1365-2958.2008.06392.x. [DOI] [PMC free article] [PubMed] [Google Scholar]
- 50.Soper T, Mandin P, Majdalani N, Gottesman S, Woodson SA. Positive regulation by small RNAs and the role of Hfq. Proc Natl Acad Sci USA. 2010;107:9602–9607. doi: 10.1073/pnas.1004435107. [DOI] [PMC free article] [PubMed] [Google Scholar]
Associated Data
This section collects any data citations, data availability statements, or supplementary materials included in this article.