Abstract
A moiré pattern is formed when two copies of a periodic pattern are overlaid with a relative twist. We address the electronic structure of a twisted two-layer graphene system, showing that in its continuum Dirac model the moiré pattern periodicity leads to moiré Bloch bands. The two layers become more strongly coupled and the Dirac velocity crosses zero several times as the twist angle is reduced. For a discrete set of magic angles the velocity vanishes, the lowest moiré band flattens, and the Dirac-point density-of-states and the counterflow conductivity are strongly enhanced.
Low-energy electronic properties of few layer graphene (FLG) systems are known (1–8) to be strongly dependent on stacking arrangement. In bulk graphite 0° and 60° relative orientations of the individual layer honeycomb lattices yield rhombohedral and Bernal crystals, but other twist angles also appear in many samples (9). Small twist angles are particularly abundant in epitaxial graphene layers grown on SiC (10, 11), but exfoliated bilayers can also appear with a twist, and arbitrary alignments between adjacent layers can be obtained by folding a single graphene layer (12, 13).
Recent advances in FLG preparation methods have attracted theoretical attention (14–20) to the intriguing electronic properties of systems with arbitrary twist angles, usually focusing on the two-layer case. The geometry of the bilayer system is characterized by a twist angle θ and by a translation vector d. Commensurability is determined only by θ. Sliding one layer with respect to the other in a commensurate structure modifies the unit cell but leaves the bilayer crystalline. In this work we find it convenient to regard the AB stacking as the aligned configuration. The positions of the carbon atoms in the two misaligned layers labeled by R and R′ are then related by R′ = M(θ)(R - τ) + d, where M is a 2-D rotation matrix within the graphene plane, and τ is a vector connecting the two atoms in the unit cell.
The problem is mathematically interesting because a bilayer forms a two-dimensional crystal only at a discrete set of commensurate rotation angles; for generic twist angles Bloch’s theorem does not apply microscopically and direct electronic structure calculations are not feasible. For twist angles larger than a few degrees the two layers are electronically isolated to a remarkable degree, except at a small set of angles which yield low-order commensurate structures (16, 19). As the twist angles become smaller, interlayer coupling strengthens, and the quasiparticle velocity at the Dirac point begins to decrease.
Here we focus on the strongly coupled small twist angle regime. We derive a low-energy effective Hamiltonian valid for any value of d and for θ ≲ 10° irrespective of whether or not the bilayer structure is periodic. We show that it is meaningful to describe the electronic structure using Bloch bands even for incommensurate twist angles and study the dependence of these bands on θ.
Model
We construct a low-energy continuum model Hamiltonian that consists of three terms: two single-layer Dirac–Hamiltonian terms that account for the isolated graphene sheets and a tunneling term that describes hopping between layers. The Dirac–Hamiltonian (21) for a layer rotated by an angle θ with respect to a fixed coordinate system is
 |
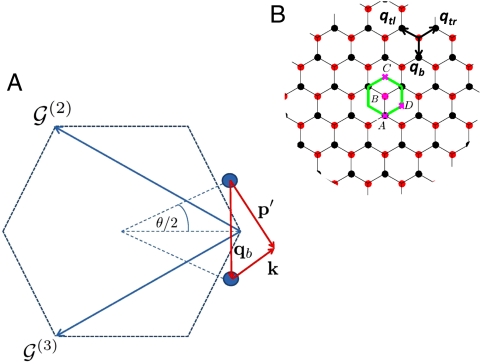
where v is the Dirac velocity, k is momentum measured from the layer’s Dirac point, θk is the momentum orientation relative to the x axis, and the spinor Hamiltonian acts on the individual layer’s A and B sublattice degrees-of-freedom. We choose the coordinate system depicted in Fig. 1 for which the decoupled bilayer Hamiltonian is  , where
  projects onto layer i.
Fig. 1.
Momentum-space geometry of a twisted bilayer. (A) Dashed line marks the first Brillouin zone of an unrotated layer. The three equivalent Dirac points are connected by  and
and  . The circles represent Dirac points of the rotated graphene layers, separated by kθ = 2kD sin(θ/2), where kD is the magnitude of the Brillouin-zone corner wave vector for a single layer. Conservation of crystal momentum implies that p′ = k + qb for a tunneling process in the vicinity of the plotted Dirac points. (B) The three equivalent Dirac points in the first Brillouin zone result in three distinct hopping processes. Interference between hopping processes with different wave vectors captures the spatial variation of interlayer coordination that defines the moiré pattern. For all the three processes |qj| = kθ; however, the hopping directions are (0,-1) for j = 1,
  for j = 2, and
  for j = 3. We interchangeably use 1, 2, 3, b, tr, and tl as subscripts for the three momentum transfers qj. Repeated hopping generates a k-space honeycomb lattice. The green solid line marks the moiré band Wigner–Seitz cell. In a repeated zone scheme the red and black circles mark the Dirac points of the two layers.
We derive a continuum model for the tunneling term by assuming that the interlayer tunneling amplitude between π-orbitals is a smooth function t(r) of spatial separation projected onto the graphene planes. The matrix element
 |
[1] |
of the tunneling Hamiltonian HT describes a process in which an electron with momentum p′ = Mp residing on sublattice β in one layer hops to a momentum state k and sublattice α in the other layer. In a π-band tight-binding model the projection of the wave functions of the two layers to a given sublattice are
 |
[2] |
and
 |
[3] |
Here τA = 0, τB = τ, and R is summed over the triangular Bravais lattice. Substituting Eqs. 2 and 3 in Eq. 1 and invoking the two-center approximation,
| [4] |
for the interlayer hopping amplitude in which t depends on the difference between the positions of the two carbon atoms we find that
 |
[5] |
Here Ω is the unit cell area, tq is the Fourier transform of the tunneling amplitude t(r), the vectors G1 and G2 are summed over reciprocal lattice vectors, and  . The bar notation over momenta in Eq. 5 indicates that momentum is measured relative to the center of the Brillouin zone and not relative to the Dirac point. Note that crystal momentum is conserved by the tunneling process because t depends only on the difference between lattice positions.*
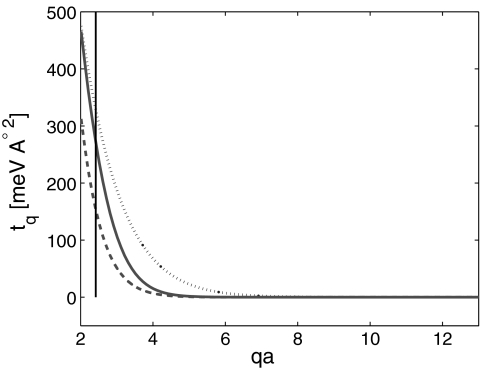
The continuum model for HT is obtained by measuring wave vectors in both layers relative to their Dirac points and assuming that the deviations are small compared to Brillouin-zone dimensions. The model’s utility rests centrally on the observation that, although tq is not precisely known, it should nevertheless fall to zero very rapidly with q on the reciprocal lattice vector scale. This behavior follows from the property that the graphene layer separation d⊥ exceeds the separation between carbon atoms within the layers by more than a factor of 2. Because the two-center integral t(r) varies with the three-dimensional separation  the strong small r hopping processes vary with r on the scale of d⊥. For this reason tq begins to decline rapidly for qd⊥ > 1. Fig. 2 plots tq values obtained numerically from the π-band tight-binding models proposed in refs. 19, 22, and 23. The largest tq values that enter the tunneling near the Dirac point have q = kD, the Brillouin-zone corner (Dirac) wave vector magnitude, and correspond to the three reciprocal vectors 0,
  , and
, and  where the latter two vectors connect a Dirac point with its equivalent first Brillouin-zone counterparts (See Fig. 1). When only these terms are retained,
 |
[6] |
where w = tkD/Ω is the hopping energy,
 |
 |
[7] |
and ϕ = 2π/3. The three qj’s in Eq. 6 are Dirac model momentum transfers that correspond to the three interlayer hopping processes.
Fig. 2.
Hopping amplitude. The Fourier transform of the hopping amplitude is plotted vs. momentum (a is the carbon-carbon distance in single-layer graphene). The different curves correspond to different models described in refs. 19 (dotted), 22 (solid), and 23 (dashed). The vertical line crosses the x axis at kDa.
For d = 0 and a vanishing twist angle the continuum tunneling matrix is 3wδαAδβB, independent of position. By comparing with the experimentally known (24) electronic structure of an AB stacked bilayer we set w ≈ 110 meV for exfoliated samples, however experiments suggest (25) that w may be smaller in some epitaxial graphene samples. As we show below the spectrum is independent of d for θ ≠ 0. In the following we therefore set d = 0.
Results
Moiré Bloch Bands.
In the continuum model hopping is local and periodic, allowing Bloch’s theorem to be applied at any rotation angle irrespective of whether or not the bilayer is crystalline. We solve numerically for the moiré bands using the plane wave expansion illustrated in Fig. 1. Convergence is attained by truncating momentum space at lattice vectors of the order of w/ℏv. The dimension of the matrix, which must be diagonalized numerically, is roughly ∼10 θ-2 for small θ (measured in degrees), compared to the ∼104 θ-2 matrix dimension of microscopic tight-binding models (14, 16).
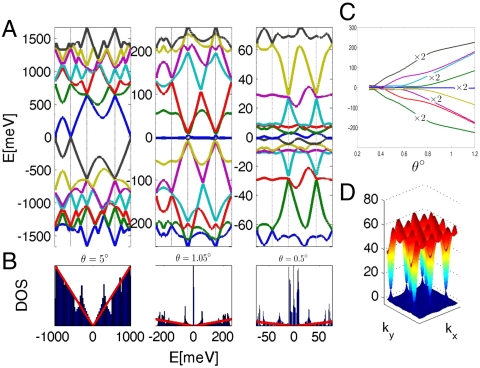
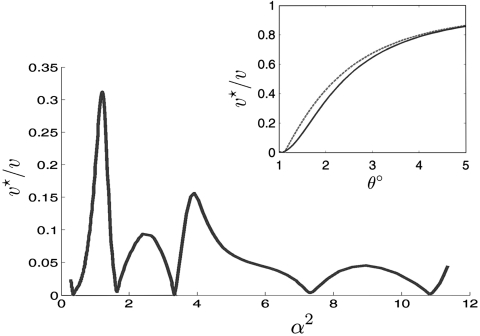
Up to a scale factor the moiré bands depend on a single parameter α = w/vkθ. We have evaluated the moiré bands as a function of their Brillouin-zone momentum k for many different twist angles; results for w = 110 meV, and θ = 5°, 1.05°, and 0.5° are summarized in Fig. 3. For large twist angles the low-energy spectrum is virtually identical to that of an isolated graphene sheet, except that the velocity is slightly renormalized. Large interlayer coupling effects appear only near the high energy van Hove singularities discussed by Andrei and coworkers (26). As the twist angle is reduced, the number of bands in a given energy window increases and the band at the Dirac point narrows. This narrowing has previously been expected to develop monotonically with decreasing θ. As illustrated in Fig. 3, we instead find that the Dirac-point velocity vanishes already at θ ≈ 1.05°, and that the vanishing velocity is accompanied by a very flat moiré band which contributes a sharp peak to the Dirac-point density-of-states (DOS). At smaller twists the Dirac-point velocity has a nonmonotonic dependence on θ, vanishing repeatedly at the series of magic angles illustrated in Fig. 4.
Fig. 3.
Moiré bands. (A) Energy dispersion for the 14 bands closest to the Dirac point plotted along the k-space trajectory A → B → C → D → A (see Fig. 1) for w = 110 meV, and θ = 5° (Left,), 1.05° (Middle), and 0.5° (Right). (B) DOS. (C) Energy as a function of twist angle for the k = 0 states. Band separation decreases with θ as also evident from A. (D) Full dispersion of the flat band at θ = 1.05°.
Fig. 4.
Renormalized Dirac-point band velocity. The band velocity of the twisted bilayer at the Dirac point v⋆ is plotted vs. α2, where α = w/vkθ for 0.18° < θ < 1.2°. The velocity vanishes for θ ≈ 1.05°, 0.5°, 0.35°, 0.24°, and 0.2°. (Inset) The renormalized velocity at larger twist angles. The solid line corresponds to numerical results and dashed line corresponds to analytic results based on the eight-band model.
Partial insight into the origin of these behaviors can be achieved by examining the simplest limit in which the momentum-space lattice is truncated at the first honeycomb shell. Including the sublattice degree of freedom, this truncation gives rise to the Hamiltonian
 |
[8] |
where k is in the moiré Brillouin-zone and kj = k + qj. This Hamiltonian acts on four two-component spinors Ψ = (ψ0,ψ1,ψ2,ψ3). The first (ψ0) is at a momentum near the Dirac point of one layer and the other three ψj are at momenta near qj and in the other layer. The dependence of h(θ) on angle is parametrically small and can be neglected. We have numerically verified that this approximation reproduces the velocity with reasonable accuracy down to the first magic angle (Fig. 4, Inset).
The renormalized velocity  follows from the spectrum
  of the twisted bilayer. The Hamiltonian is expressed as a sum of the k = 0 term
  and the k-dependent term
  and solved to leading order in k.
Consider the k = 0 term in the Hamiltonian. We assume that  has zero energy eigenstates and prove our assumption by explicitly finding these states. The zero energy eigenstates must satisfy
| [9] |
Because
| [10] |
the equation for the ψ0 spinor is h0ψ0 = 0, i.e., ψ0 is one of the two zero energy states  and
and  of the isolated layer. The two zero energy eigenstates of
  then follow from Eq. 9. Given that
  , the wave functions should be normalized by |Ψ|2 = 1 + 6α2. The effective Hamiltonian matrix to leading order in k is therefore
 |
Aside from a renormalized velocity
 |
[11] |
the Hamiltonian is identical to the continuum model Hamiltonian of single-layer graphene. The denominator in Eq. 11 captures the contribution of the Ψj’s to the normalization of the wave function whereas the numerator captures their contribution to the velocity matrix elements. For small α, Eq. 11 reduces to the expression v⋆/v = 1 - 9α2, first obtained by Lopes dos Santos et al. (15). The velocity vanishes at the first magic angle because it is in the process of changing sign. The eigenstates at the Dirac point are a coherent combination of components in the two layers that have velocities of opposite sign.
Counterflow Conductivity.
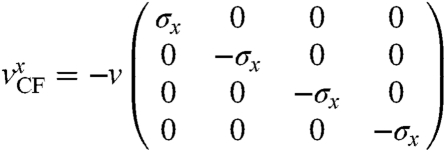
The distribution of the quasiparticle velocity between the two layers implies exotic transport characteristics for separately contacted layers. Consider a counterflow geometry in which currents in the two layers flow antiparallel to one another. We focus on twist angles θ ≳ 2° for which the eight-band model is valid and to the semiclassical regime in which ϵFτ > 1 and find the counterflow conductivity σCF. We assume that the Fermi momentum is much smaller than kθ and that 1/τ0 < ℏvkθ, where τ0 is single particle lifetime. Using the Kubo formula we find that
 |
[12] |
where
 |
[13] |
is the x component of the counterflow velocity operator (we set the electric fields along the x axis),  is the retarded Green function with μ labeling the two Dirac bands, and
  is the energy dispersion of the twisted bilayer at small momenta. For an electron-doped system the valence band can be neglected and
 |
[14] |
where ν⋆ is the DOS of the twisted bilayer. The vertex function
| [15] |
where vCF = v(1 + 3α2)/(1 + 6α2) follows directly from the previous section if we notice the sign differences between the counterflow velocity operator and the normal velocity operator. The counterflow conductivity is then
 |
[16] |
where σ0 ∼ e2ϵFτ/π is the conductivity of an isolated single graphene layer. As θ is reduced from a large value toward 1°, v⋆ is reduced and the DOS is correspondingly increased. The counterflow conductivity is enhanced because of an increased density of carriers, which is not accompanied by a decrease in counterflow velocity. For a conventional measurement in which the current in the bilayer is unidirectional vCF in Eq. 16 is replaced by v⋆. The increase in the DOS is then exactly compensated by the reduction of the renormalized velocity and the single-layer value of the conductivity is regained.
Dependence of the Spectrum on d.
We now show that the spectrum of misaligned bilayers is independent of linear translations of one layer with respect to the other using a unitary transformation that makes the Hamiltonian independent of d. Consider HQ where Q is a momentum in the first moiré Brillouin zone. With each momentum on the k-space triangular Bravais lattice (see Fig. 1)
where  and
and  , we associate the phase
The phase associated with momentum  on the other sublattice is ϕk as well. In terms of the new basis states
  the Hamiltonian HQ is d-independent.
Physically, the lack of dependence on d can be understood by noticing that varying d just shifts the moiré pattern in space. The bilayer spectrum does depend on d at θ = 0, and at other commensurate angles. We expect that dependence on d will be observable only at short period (large θ) commensurate angles.
Discussion
Twisted double-layer graphene is, for most values of θ, a quasi-periodic structure that has no unit cell. Nevertheless, we find that for θ ≲ 10° it is meaningful to describe the electronic structure of the system in terms of Bloch bands. The hidden periodic structure is shown to be related to the moiré pattern of the overlaid layers (27).
The leading corrections to the periodic moiré band Hamiltonian involve hopping amplitudes with the smallest momenta g that satisfy the crystal momentum conservation condition in Eq. 5 and are larger than kD. As we showed in ref. 19, real space commensuration between the two rotated hexagonal lattice is concomitant to momentum space commensuration of the Dirac points in the extended-zone scheme (see figures 2 and 3 in ref. 19). The commensurate vector g can therefore be found using the formula for the moiré periodicity if the lattice vector of graphene  (where a is the carbon-carbon distance in a single-layer graphene) is replaced by the reciprocal lattice vector G. It follows that g(θ) ≈ G/θ. For example g(10°) = 24/a and g(2°) = 120/a. As Fig. 2 demonstrates, the hopping amplitudes for these large wave vectors are indeed negligible compared to the value of tkD. We therefore expect the continuum model to be very accurate up to energies of approximately 1 eV and up to angles of approximately 10°.
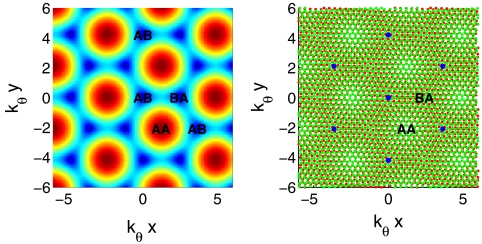
The Bloch band model has a simple and appealing physical interpretation. The hopping Hamiltonian is local in space. At each position, its 4 × 4 matrix, describes sublattice-dependent interlayer hopping, which depends on the local coordination between the atoms in the two layers. In Fig. 5 we have plotted the moiré pattern of atomic positions and the smaller of the two positive eigenvalues of the hopping Hamiltonian as a function of position on the same length scale. At each position, the local interlayer tunneling Hamiltonian, is that of a system in which the local coordination is maintained through all space. At AB and BA points, for example, the tunneling Hamiltonian is that of AB and BA systems, for which tunneling does not produce a gap so that the smallest positive eigenvalue vanishes. On the other hand the gap reaches its maxima (6w) at AA points in the moiré pattern.
Fig. 5.
Moiré period. (Right) Moiré pattern obtained from two graphene layers overlaid with a relative twist angle θ. Distances are measured in units of  , where kθ = 2kD sin(θ/2) with kD being the Dirac wave vector. Blue dots denote areas with local AB coordination. (Left) Smallest positive energy of the interlayer Hamiltonian. The energy vanishes for local AB or BA coordination and reached a maximum of 3w for local AA coordination.
In summary we have formulated a continuum model description of the electronic structure of rotated graphene bilayers. The resulting moiré band structure can be evaluated at arbitrary twist angles, not only at commensurate values. We find that the velocity at the Dirac point oscillates with twist angle, vanishing at a series of magic angles which give rise to large DOS and to large counterflow conductivities. Many properties of the moiré bands are still not understood. For example, although we are able to explain the largest magic angle analytically, the pattern of magic angles at smaller values of θ has so far been revealed only numerically. Additionally the flattening of the entire lowest moiré band at θ ≈ 1.05° remains a puzzle. Interesting new issues arise when our theory is extended to graphene stacks containing three or more layers. Finally, we remark that electron-electron interactions neglected in this work are certain to be important at magic twist angles in neutral systems and could give rise to counterflow superfluidity (28, 29), flat-band magnetism (30), or other types of ordered states.
Acknowledgments.
We acknowledge a helpful conversation with Gene Mele. This work was supported by Welch Foundation Grant F1473 and by the National Science Foundation-Nanoelectronics Research Initiative South West Academy of Nanoelectronics program.
Footnotes
The authors declare no conflict of interest.
*A closely related but slightly different expression appears in ref. 19 in which we chose the origin at a honeycomb lattice point. The present convention is more convenient for the discussion of small rotations relative to the Bernal arrangement.
References
- 1.McCann E, Falko VI. Landau-level degeneracy and quantum hall effect in a graphite bilayer. Phys Rev Lett. 2006;96:086805. doi: 10.1103/PhysRevLett.96.086805. [DOI] [PubMed] [Google Scholar]
- 2.Koshino M, Ando T. Orbital diamagnetism in multilayer graphenes: Systematic study with the effective mass approximation. Phys Rev B. 2007;76:085425. [Google Scholar]
- 3.Nilsson J, Castro Neto AH, Guinea F, Peres NMR. Electronic properties of bilayer and multilayer graphene. Phys Rev B. 2008;78:045405. [Google Scholar]
- 4.Min H, MacDonald AH. Chiral decomposition in the electronic structure of graphene multilayers. Phys Rev B. 2008;77:155416. [Google Scholar]
- 5.Koshino M, McCann E. Trigonal warping and Berrys phase Nπ in ABC-stacked multilayer graphene. Phys Rev B. 2009;80:165409. [Google Scholar]
- 6.Zhang F, Sahu B, Min H, MacDonald AH. Band structure of ABC-stacked graphene trilayers. Phys Rev B. 2010;82:035409. [Google Scholar]
- 7.Wang Y, et al. Stacking-dependent optical conductivity of bilayer graphene. ACS Nano. 2010;4:4074–4080. doi: 10.1021/nn1004974. [DOI] [PubMed] [Google Scholar]
- 8.Ghosh S, et al. Dimensional crossover of thermal transport in few-layer graphene. Nat Mater. 2010;9:555–558. doi: 10.1038/nmat2753. [DOI] [PubMed] [Google Scholar]
- 9.Rong ZY, Kuiper P. Electronic effects in scanning tunneling microscopy: Moiré pattern on a graphite surface. Phys Rev B. 1993;48:17427–17431. doi: 10.1103/physrevb.48.17427. [DOI] [PubMed] [Google Scholar]
-
10.Hass J, et al. Why multilayer graphene on
 behaves like a single sheet of graphene. Phys Rev Lett. 2008;100:125504. doi: 10.1103/PhysRevLett.100.125504. [DOI] [PubMed] [Google Scholar]
 - 11.First PN, et al. Epitaxial graphenes on silicon carbide. MRS Bull. 2010;35:296–305. [Google Scholar]
- 12.Schmidt H, Luedtke T, Barthold P, Haug RJ. Mobilities and scattering times in decoupled graphene monolayers. Phys Rev B. 2010;81:121403(R). [Google Scholar]
- 13.Dobrik G, Tapaszto L, Nemes-Incze P, Lambin Ph, Biro LP. Crystallographically oriented high resolution lithography of graphene nanoribbons by STM lithography. Phys Status Solidi B. 2010;247:896–902. [Google Scholar]
- 14.Trambly de Laissardière G, Mayou D, Magaud L. Localization of Dirac electrons in rotated graphene bilayers. Nano Lett. 2010;10:804–808. doi: 10.1021/nl902948m. [DOI] [PubMed] [Google Scholar]
- 15.Lopes dos Santos JMB, Peres NMR, Castro Neto AH. Graphene bilayer with a twist: Electronic structure. Phys Rev Lett. 2007;99:256802. doi: 10.1103/PhysRevLett.99.256802. [DOI] [PubMed] [Google Scholar]
- 16.Shallcross S, Sharma S, Kandelaki E, Pankratov OA. Electronic structure of turbostratic graphene. Phys Rev B. 2010;81:165105. [Google Scholar]
- 17.Shallcross S, Sharma S, Pankratov OA. Quantum interference at the twist boundary in graphene. Phys Rev Lett. 2008;101:056803. doi: 10.1103/PhysRevLett.101.056803. [DOI] [PubMed] [Google Scholar]
- 18.Mele EJ. Commensuration and interlayer coherence in twisted bilayer graphene. Phys Rev B. 2010;81:161405(R). [Google Scholar]
- 19.Bistritzer R, MacDonald AH. Transport between twisted graphene layers. Phys Rev B. 2010;81:245412. [Google Scholar]
- 20.Morell ES, Correa JD, Vargas P, Pacheco M, Barticevic Z. Flat bands in slightly twisted bilayer graphene: Tight-binding calculations. Phys Rev B. 2010;82:121407(R). [Google Scholar]
- 21.Castro Neto AH, Guinea F, Peres NMR, Novoselov KS, Geim AK. The electronic properties of graphene. Rev Mod Phys. 2009;81:109–162. [Google Scholar]
- 22.Pereira VM, Castro Neto AH, Peres NMR. Tight-binding approach to uniaxial strain in graphene. Phys Rev B. 2009;80:045401. [Google Scholar]
- 23.Tang MS, Wang CZ, Chan CT, Ho KM. Environment-dependent tight-binding potential model. Phys Rev B. 1996;53:979–982. doi: 10.1103/physrevb.53.979. [DOI] [PubMed] [Google Scholar]
- 24.Kuzmenko AB, Crassee I, van der Marel D, Blake P, Novoselov KS. Determination of the gate-tunable band gap and tight-binding parameters in bilayer graphene using infrared spectroscopy. Phys Rev B. 2009;80:165406. doi: 10.1103/PhysRevLett.103.116804. [DOI] [PubMed] [Google Scholar]
- 25.Sprinkle M, et al. First direct observation of a nearly ideal graphene band structure. Phys Rev Lett. 2009;103:226803. doi: 10.1103/PhysRevLett.103.226803. [DOI] [PubMed] [Google Scholar]
- 26.Li G, et al. Observation of van Hove singularities in twisted graphene layers. Nat Phys. 2010;6:109–113. [Google Scholar]
- 27.Amidror I. The Theory of the Moiré Phenomenon. Vol I. London: Springer; 2009. [Google Scholar]
- 28.Eisenstein JP, MacDonald AH. Bose–Einstein condensation of excitons in bilayer electron systems. Nature. 2004;432:691–694. doi: 10.1038/nature03081. [DOI] [PubMed] [Google Scholar]
- 29.Min H, Bistritzer R, Su JJ, MacDonald AH. Room-temperature superfluidity in graphene bilayers. Phys Rev B. 2008;78:121401(R). [Google Scholar]
- 30.Arita R, Suwa Y, Kuroki K, Aoki H. Gate-induced band ferromagnetism in an organic polymer. Phys Rev Lett. 2002;88:127202. doi: 10.1103/PhysRevLett.88.127202. [DOI] [PubMed] [Google Scholar]


