Abstract
PRDM9 is a major specifier of human meiotic recombination hotspots, probably via binding of its zinc-finger repeat array to a DNA sequence motif associated with hotspots. However, our view of PRDM9 regulation, in terms of motifs defined and hotspots studied, has a strong bias toward the PRDM9 A variant particularly common in Europeans. We show that population diversity can reveal a second class of hotspots specifically activated by PRDM9 variants common in Africans but rare in Europeans. These African-enhanced hotspots nevertheless share very similar properties with their counterparts activated by the A variant. The specificity of hotspot activation is such that individuals with differing PRDM9 genotypes, even within the same population, can use substantially if not completely different sets of hotspots. Each African-enhanced hotspot is activated by a distinct spectrum of PRDM9 variants, despite the fact that all are predicted to bind the same sequence motif. This differential activation points to complex interactions between the zinc-finger array and hotspots and identifies features of the array that might be important in controlling hotspot activity.
Keywords: linkage disequilibrium, sperm, cross-over, conversion, meiotic drive
Meiotic recombination is fundamentally important in ensuring correct chromosome disjunction at meiosis and in reshuffling haplotypes between generations, substantially increasing haplotype diversity within a population. Most recombination events in the human genome are clustered into narrow hotspots that can be identified indirectly from patterns of linkage disequilibrium (LD hotspots) (1), or directly through high-resolution linkage analysis in pedigrees (2) or by sperm typing (3). Genome-wide comparison of LD hotspots has identified a sequence motif CCNCCNTNNCCNC associated with 40% of these hotspots; this motif appears to influence the initiation of meiotic recombination, because SNPs that disrupt the motif can down-regulate recombination (4).
Recently, the meiosis-specific protein PRDM9 has been identified as a major specifier of hotspots in the human and mouse genome (5–7). PRDM9 contains a SET domain that might be responsible for activating hotspots by chromatin remodelling (8), plus a C-terminal tandem-repeat zinc-finger (ZnF) array encoded by a variable minisatellite. Evidence that PRDM9 regulates hotspots comes from the finding that the common European variant A has a ZnF array that binds, at least in vitro, to the 13-mer hotspot motif shared by many LD hotspots identified in Europeans (5, 6). Furthermore, association analyses in Hutterites (5) and Icelanders (2) have shown that individuals with variant non-A PRDM9 alleles can show genome-wide shifts in hotspot usage. These shifts suggest that ZnF variants that should not bind the PRDM9 A motif might trigger the appearance of new sets of hotspots (5), although it is possible that some of these shifts reflect additional hotspot-specification systems that only become manifest as the dosage of the PRDM9 A variant is reduced. The Icelandic study highlighted the PRDM9 C variant and its associated predicted motif CCNCNNTNNNCNTNNC, distinct from the A motif, as having a significant effect on cross-over location, with evidence that this variant can explain some of the fine-scale differences in LD profiles between Europeans and Africans (2). However, its influence on individual hotspots was unclear because most “hotspots” apparently activated by this variant were defined by only a single cross-over event (2). Finally, analysis of sperm cross-over activity at specific European LD hotspots revealed a major influence of PRDM9 on hotspot activity and showed that even minor variation within the ZnF array of the A variant could alter recombination activity, in most instances resulting in nonactivating variants (9). Curiously, this influence was seen at all hotspots studied, regardless of whether they contained an obvious PRDM9 A motif, suggesting subtle interactions between PRDM9 and hotspot targets more complex than simple binding to the motif (5, 6).
Our view of PRDM9 regulation is thus strongly biased toward the hotspot motif defined by comparisons of LD hotspots in Europeans (4) and toward hotspots known to be active in Europeans and activated by the PRDM9 A variant that is common in Europeans (9). In contrast, Africans show much greater diversity in the ZnF repeat array and might be expected to use a broader repertoire of hotspots than Europeans (7, 9). To identify these hotspots, we searched for genomic intervals showing high historical cross-over activity preferentially in Africans, and used sperm typing to explore the properties of these African hotspots and to determine whether they too are regulated by PRDM9 and, if so, by which variants.
Results
Detecting Population-Specific Cross-Over Hotspots by LD Mapping.
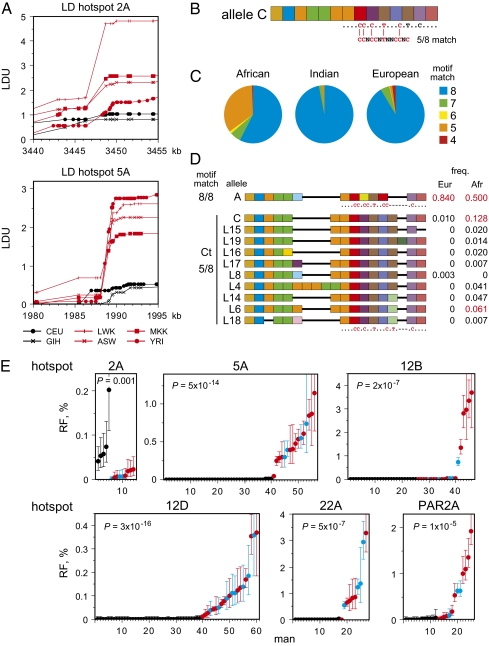
To identify African-enhanced LD hotspots, we surveyed HapMap genotype data (10, 11) for intervals showing strong and consistent LD breakdown in the four available African populations and weaker LD breakdown in Europeans and Indians. We restricted our search within 6 Mb of telomeres because the most intense hotspots discovered to date are mainly subtelomeric (9, 12, 13). This survey across 27 Mb of the human genome yielded 20 LD hotspots (examples shown in Fig. 1A) with average historical cross-over frequencies of 0.06% in Africans and 0.01% in Europeans/Indians, as estimated by coalescent analysis (14). If these hotspots are regulated by PRDM9, then activating variants are likely to be common in Africans but rare in Europeans and Indians. Classification of PRDM9 variants, according to predicted sequence binding motifs (5, 6) (example given for the PRDM9 C variant in Fig. 1B), showed that non-A variants that only partially match the PRDM9 A motif are scarce in Europeans and Indians but common in Africans (Fig. 1C). Particularly prominent are variants, including the C variant, that show a 5/8 match to the A motif. These variants are all predicted to bind the same motif despite a diversity of allele structures (Fig. 1D and Figs. S1B and S2) and are prime candidates for regulating African-enhanced hotspots. We refer to these PRDM9 C and C-related variants collectively as C-type (Ct) variants.
Fig. 1.
Detection of cross-over hotspots activated by African PRDM9 variants. (A) Metric LD plots in linkage disequilibrium units (LDU) (27) of HapMap genotype data (10, 11) showing examples of putative African-specific LD hotspots detected by strong LD breakdown in four African populations (red: LWK, Luhya from Kenya; MKK, Maasai from Kenya; YRI, Yoruba from Nigeria; ASW, individuals of African ancestry in the Southwest USA) and weak LD breakdown in Utah residents with Northern and Western European ancestry (CEU) and in Gujarati Indians in Houston (GIH) (black). LD hotspots were named after the chromosome (e.g., hotspot 2A is located on chromosome 2). Chromosome coordinates are taken from human genome assembly GRCh37/hg19, Ensembl release 61. (B) Structure of the ZnF repeat array in the PRDM9 C variant, with variant repeats (defined in Fig. S1 A and B) colored differently. The predicted DNA binding motif below is aligned to the PRDM9 A motif, showing at best only 5/8 matching bases. (C) Frequencies of PRDM9 variants, classified by their predicted binding match to the PRDM9 A motif, in different populations. (D) Aligned structures of PRDM9 Ct variants showing a 5/8 match with the A motif. All are predicted to recognize the same DNA binding motif, possibly extended for variant L19 (Fig. S2). Allele frequencies in Europeans and Africans are given on the right, with common alleles (frequency >5%) indicated in red. (E) Sperm cross-over frequencies, with 95% confidence intervals, in different men either lacking PRDM9 Ct alleles (black) or containing one Ct allele (red) or two Ct alleles (blue) at each of the six LD hotspot intervals analyzed. Men within each group are ranked in ascending order of cross-over activity. Different sets of men were tested at each hotspot depending on the availability of informative SNPs required for cross-over detection. The significance of association between cross-over activity and the presence of Ct alleles, as established by two-tailed Mann–Whitney tests on ranked cross-over frequencies for each hotspot, is given.
Sperm Cross-Over Analyses at African-Enhanced LD Hotspots.
Six LD hotspots with good SNP density and low historical activities in Europeans and Indians (<15% of activity in Africans) were selected for detailed analysis (Table S1), including one (PAR2A) detected in the pseudoautosomal pairing region PAR2 (15). Sperm cross-over assays (3) across a 6- to 10-kb interval spanning each LD hotspot were applied to men of European, Indian, or African descent who carried PRDM9 alleles that encode proteins showing various levels of match to the PRDM9 A motif (Fig. S1B and Table S2). Simple comparison of sperm cross-over frequencies in men carrying or lacking Ct alleles showed a major and highly significant effect at five of the six test intervals, with high cross-over activity seen only in men with Ct alleles (Fig. 1E). In contrast, none of 20 different non-Ct PRDM9 alleles tested at one or more of these five hotspots was activating (Table S3). Hotspot 2A was exceptional, showing consistently lower activity in men carrying a Ct allele compared with men lacking a Ct allele; the association between PRDM9 status and cross-over activity was nevertheless significant (P = 0.001), suggesting that recombination in this region is also regulated by PRDM9 but triggered by A rather than Ct variants given the high activity in PRDM9 A/A men.
Differential Tuning of Hotspots to Different PRDM9 Ct Variants.
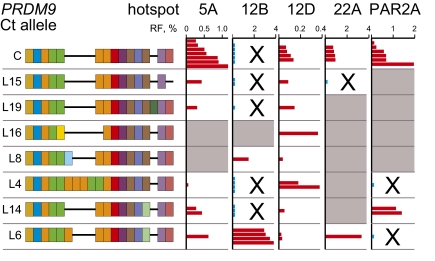
There was considerable variation in sperm cross-over frequencies between Ct carriers (Fig. 1E), suggesting that not all Ct variants activate all hotspots to the same extent. We therefore compared cross-over activities in men carrying different Ct variants (Fig. 2). Men with the same variant showed similar cross-over frequencies. One notable exception was at hotspot PAR2A where four C/A heterozygotes showed 25-fold variation in hotspot activity (Table S2); however, there were not enough men to test whether this variation was caused by factors in cis within the hotspot (16). In contrast, different hotspots showed very different profiles of activation by Ct variants. Thus, hotspot 12D was activated to a greater or lesser extent by all testable variants, whereas hotspot 12B was significantly activated only by variants L6 and L8, explaining the predominance of Ct-positive inactive men at this hotspot (Fig. 1E). Caution is needed in interpreting inactivity in a single man at a single hotspot (e.g., variant L4 appears not to activate hotspot PAR2A in the single testable man, although it does activate hotspot 12D in the same man; Table S2). Inactivity could in theory be caused by an influence in cis within the hotspot in the individual tested (16) and not by PRDM9 variation. Nevertheless, it is clear that each hotspot interval has a different and distinct profile of activation by different Ct variants.
Fig. 2.
Cross-over frequencies in men carrying different PRDM9 Ct alleles. Data were scored at each hotspot for all men carrying a Ct allele plus another allele known to be nonactivating (usually allele A), allowing Ct activity to be estimated. Cross-over frequencies at <2% of maximum activity are indicated in blue, and nonactivating or very weakly activating alleles are marked with a cross. Allele/hotspot combinations for which no informative men were available are shaded in gray.
Morphology of Hotspots Activated by PRDM9 Ct Variants.
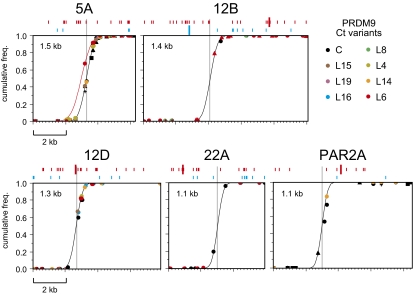
LD profiles across each test interval suggested the presence of a single cross-over hotspot (Fig. 1A). To test this prediction, we mapped sperm cross-over locations (Fig. 3). Each interval contained a single narrow (1.1–1.5 kb) hotspot with cross-over exchange points apparently normally distributed across each hotspot. For most hotspots, men carrying different Ct alleles showed indistinguishable cross-over distributions, indicating that different Ct variants, even if differing in activity, nevertheless trigger the same hotspot. Activation of the same hotspot was even seen for the very weakly activating variant C at hotspot 12B, which triggers activity at only 0.6% of the maximum value (Fig. 2). The only exception was at hotspot 5A, where the man carrying PRDM9 variant L6 showed a highly significant 0.3-kb shift in cross-over distribution. The same shift was seen in reciprocal cross-over molecules and suggests that L6 is activating a second hotspot very close to hotspot 5A.
Fig. 3.
Sperm cross-over distributions across genomic intervals regulated by PRDM9 Ct variants. Cross-over molecules from men carrying the Ct allele indicated at top right were mapped by using internal SNPs. Different men carrying the same Ct allele are indicated by different symbols of the same color. Cumulative cross-over frequencies for each man were estimated by mapping 25–215 cross-overs in each orientation and combining reciprocal cross-over data; the only exceptions were at hotspot PAR2A, where two C carriers and the L14 carrier were mapped in only one orientation. Data from all men were combined to estimate the least-squares best-fit cumulative normal distribution (black line) at each hotspot (3). The L6 carrier at hotspot 5A shows a cross-over distribution (red line) significantly shifted by 0.3 kb relative to the hotspot in other tested men (Fisher exact test on numbers of cross-overs mapping 5′ and 3′ to the central C/T SNP rs13355978 in the L6 carrier vs. three other mapped C/T heterozygotes, P < 10−6). The best-fit distributions were used to estimate the center of each hotspot (gray line) and its width within which 95% of cross-overs are located, as indicated. Sequence matches with the binding motif predicted for PRDM9 Ct variants (CCNCNNTNNNCNTNNC) (2) and the A variant (CCNCCNTNNCCNC) (4, 6) are shown above each graph in red and blue, respectively, with perfect matches indicated by large lines and single base mismatches by small lines. Coordinates of hotspot centers are given in Table S1.
Cis-Acting Influences on Hotspot Activity.
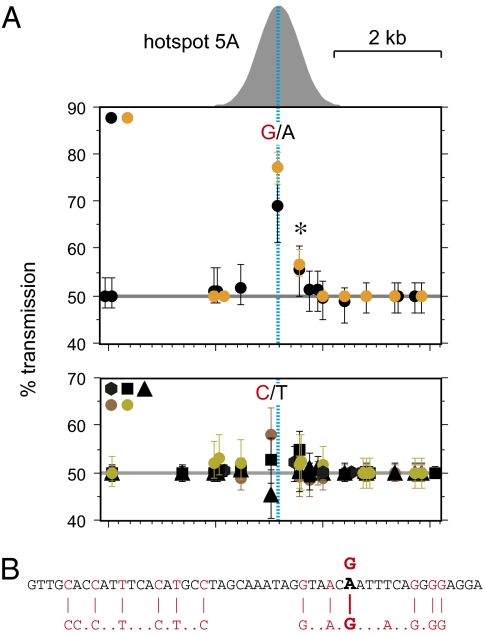
PRDM9 Ct variants are all predicted to bind the sequence motif CCNCNNTNNNCNTNNC (2) (Figs. S1B and S2). A perfect match to this motif was detected within 80 bp of the center of hotspot 12D, and more degenerate matches within 10–40 bp of the center of hotspots 5A and 12B, but not at 22A or PAR2A (Fig. 3). Matches were also seen in recombinationally inert DNA outside hotspots, indicating that the motif is not predictive of hotspot location. To detect possible cis-acting influences on hotspot activity, we looked for biased gene conversion accompanying cross-over that could signal the presence of hotspot sequence variants influencing the efficiency of recombination initiation (16). Hotspots PAR2A and 5A both showed instances of strong bias most pronounced at the SNP closest to the hotspot center. This bias was seen in only one man at PAR2A, preventing further analysis, whereas hotspot 5A was more informative. Two men heterozygous for a central A/G SNP both showed strong overtransmission of the G allele to ≈73% of cross-over progeny (Fig. 4A). In contrast, five A/A homozygotes showed no significant transmission distortion, even at a nearby central C/T SNP. The association between A/G heterozygosity and biased gene conversion was significant (P = 0.024), suggesting that this polymorphism directly influences the efficiency of recombination initiation. The center of hotspot 5A shows a predicted PRDM9 C motif (Fig. 3) plus a second equally well matched motif in inverted orientation generated by the A→G substitution (Fig. 4B). Perversely, the substitution that generates the second putative PRDM9 binding site does not stimulate initiation, but instead down-regulates it by roughly threefold as judged from the strength of overtransmission of the G allele to cross-overs (16).
Fig. 4.
Biased gene conversion accompanying cross-over at hotspot 5A. (A) Transmission frequencies of SNP alleles into cross-over progeny, normalized to equal numbers of reciprocal cross-overs and with 95% confidence intervals. Data for different men are colored according to the PRDM9 Ct allele they carry, as in Fig. 3. Upper shows data from two men heterozygous for a central A/G SNP, with transmission frequencies shown for SNPs from the haplotype carrying the G allele. Significant transmission distortion was seen not only at the A/G SNP but also at a second SNP (*) 410 bp downstream but within the hotspot. Lower shows data from 5 men, all A/A homozygotes at this SNP, with transmissions from the C haplotype in the three C/T heterozygotes at a SNP only 106 bp away from the A/G SNP; this SNP is therefore sufficiently central to detect any biased gene conversion. The morphology of the cross-over hotspot (Fig. 3) is shown above Upper, with the hotspot center marked with a dashed line. (B) Matches to the predicted PRDM9 C binding motif CCNCNNTNNNCNTNNC at the center of the hotspot and spanning the central A/G SNP.
Nonexchange Conversions Are also Regulated by PRDM9.
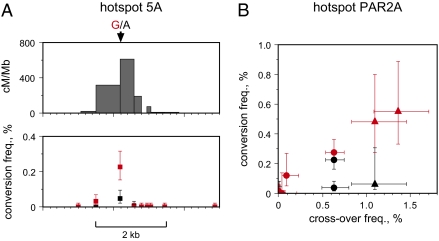
Previously characterized human meiotic cross-over hotspots are also active in nonexchange gene conversion events (conversions) (17). We therefore analyzed hotspots 5A and PAR2A for conversions. Hotspot 5A showed conversions in a PRDM9 C/C homozygote arising at a frequency of 0.15%, compared with 0.54% cross-over frequency. Conversions showed a peak of activity focused at the A→G substitution at the center of the hotspot and, as with cross-overs, were strongly biased, with 83% of conversion events at this SNP resulting in the transfer of the G allele to the A haplotype (Fig. 5A). The strength of this bias was not significantly different between cross-overs and nonexchange conversions (P = 0.19). Hotspot PAR2A was also tested in men carrying a variety of PRDM9 alleles (Fig. 5B). All cross over-active men were active for nonexchange conversions involving marker(s) near the center of the hotspot, whereas no conversions were detected in cross over-inactive men. These conversions were detected at ≈40% of the frequency of cross-overs, although the cross-over:conversion ratio varied substantially between men. There were not enough active men to allow us to explore further the cause of this variation.
Fig. 5.
Gene conversion activity at hotspots activated by PRDM9 Ct variants. (A) Cross-over and nonexchange conversion activity at hotspot 5A in a PRDM9 C/C homozygote. The cross-over profile (Upper) was established from 120 reciprocal cross-overs detected in 28,000 sperm, whereas conversion frequencies per SNP, with 95% confidence intervals (Lower), were determined from 40 conversions also detected. Frequencies are shown separately for transfer of markers from the haplotype carrying the central G allele to the haplotype with the A allele (red) and for haplotype A→G transfers (black). (B) Comparison of sperm cross-over frequencies at hotspot PAR2A with nonexchange conversion frequencies at the two central SNPs (black, red) (Fig. 3) showing maximum conversion activity. Five men were tested carrying activating Ct alleles (circle, allele C; triangle, allele L14), plus two men with nonactivating Ct alleles and seven men lacking Ct alleles. All men were informative at one or both of the central SNPs.
Discussion
Many factors can influence LD patterns across the human genome, and identifying African-enhanced meiotic recombination hotspots through preferential breakdown of LD ran the risk of detecting PRDM9 A-regulated hotspots that happened to have left a greater mark on LD in Africans compared with Europeans. In practice, activation by the A variant was only seen at one of the six hotspots examined. Our strategy could also have detected hotspots that were not regulated by PRDM9. However, every one of the 6 sperm hotspots in this study, as well as the 12 hotspots characterized previously (9), is activated by specific PRDM9 variants, suggesting that PRDM9 regulates most, if not all, sperm cross-over hotspots in humans. PRDM9 is presumed to regulate hotspot activity at the level of recombination initiation rather than downstream processing (8). Regulation at the level of initiation is consistent with nonexchange conversion activity at hotspot PAR2A, increasing roughly in proportion to cross-over activity depending on PRDM9 status, implying that both processes are cotriggered by specific PRDM9 variants.
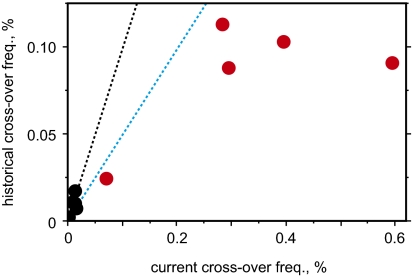
The historical activity of an LD hotspot estimated from population diversity data will reflect the combined population frequencies and activities of different PRDM9 alleles. The correspondence between historical and current frequencies was reasonable, particularly if, as is likely, these subtelomeric hotspots are more active in male than female meiosis (18, 19) (Fig. 6). As seen before (12), historical activities tended to be underestimated for the most active hotspots in Africans, presumably through factors such as saturation of LD breakdown and the possible existence of young activating PRDM9 variants that have failed to leave their full mark on haplotype diversity. Hotspots activated by a broad range of Ct variants, which together account for 34% of PRDM9 alleles in Africans, should leave a clear mark on LD, whereas hotspots triggered by rare variants are unlikely to be detectable by LD analysis unless they are intensely active (20). As predicted, all Ct-triggered hotspots analyzed were activated by one or both of the most common Ct variants C and L6. These hotspots include the most active yet described, with cross-over frequencies up to 4% per sperm, well in excess of the maximal 1% cross-over frequency so far seen at PRDM9 A-regulated hotspots (12). Including nonexchange conversions, this activity implies that some of these hotspots are being used in 10% or more of male meioses. Together, A and Ct alleles account for 85% of all PRDM9 alleles in both European and Africans and are thus responsible for the majority of recombination in both populations. Detecting hotspots triggered by other rare PRDM9 variants will be a major challenge.
Fig. 6.
Relationship between current and historical cross-over activity at five Ct-regulated hotspots, shown for Africans (red) and Europeans (black). The current cross-over frequency in a population was estimated as ∑2rifi, where ri is the mean cross-over frequency in sperm from men carrying the ith activating PRDM9 variant, and fi is the population frequency of the variant. We assumed that Ct homozygotes would show twice the activity of carriers (9). Historical activities were estimated by using LDhat (14) from HapMap genotype data for the populations shown in Fig. 1A (Table S1), and then averaged over all African populations. The dotted lines show the expected relationship if current and historical activities are identical, in black for hotspots equally active in male and female meiosis and in blue for male-specific hotspots. Note that current activity will be slightly underestimated at those hotspots where not all rare PRDM9 Ct variants could be tested (Fig. 2).
Our picture of PRDM9 Ct-triggered hotspots complements the Eurocentric view of hotspots regulated by the PRDM9 A variant. The properties of these Ct hotspots are strikingly similar to A-regulated hotspots, with a very similar 1.1–1.5 kb width (12), quasi-normal distribution of cross-over exchanges across hotspots (3, 12), and a steep gradient of nonexchange conversion activity focused at the center of the hotspot (17). Both classes of hotspots can show incidences of strongly biased gene conversion, affecting cross-overs and noncross-over events, that are triggered by SNP heterozygosity at the center of the hotspot. The strength of biased conversion and its effects on shifting reciprocal cross-over distributions are also very similar at A- and Ct-regulated hotspots (16, 21), suggesting similar quantitative effects of SNPs on initiation at both classes of hotspots.
It is notable that the suppressing A→G base substitution at hotspot 5A (Figs. 4 and 5) affects a putative PRDM9 C binding motif but surprisingly strengthens the motif rather than disrupting it. This base substitution is a recent mutation in the human lineage that is being subjected to meiotic drive through biased gene conversion sufficiently strong to ensure its eventual fixation in human populations (21). Similar drive in favor of derived-state recombination-suppressing variants has been seen at A-regulated hotspots (6, 16). It therefore appears that Ct as well as A hotspots are being subjected to deterministic attenuation/extinction by the meiotic drive of hotspot-suppressing mutations (6, 16, 21–23).
Ct-regulated hotspots show little if any activity in PRDM9 A/A men, who show cross-over frequencies of, at most, only 0.07% of maximum activity; this frequency corresponds to an activity of 0.1 cM/Mb, similar to previous estimates of background cross-over activity outside hotspots (3, 24). Similarly, PRDM9 A-regulated hotspots are suppressed to <0.4% of maximum activity in men carrying two Ct alleles, as judged from 1 to 5 such men tested over 10 different A-activated hotspots (9). It therefore follows that men homozygous for the PRDM9 A allele will use largely, if not completely, different sets of hotspots compared with men homozygous for Ct alleles. The extreme divergence in hotspot locations between humans and chimpanzees, as inferred from LD studies (25, 26), can therefore apply to individual humans in the same population.
Data from PRDM9 A and C variants strongly suggest that the putative C-terminal motif-binding region of the PRDM9 ZnF array plays a key role in hotspot activation (2, 5, 9) (Fig. 1B). The importance of this region is confirmed by variants A and L8 that activate completely different hotspots yet differ over only 4–6 ZnFs toward the C-terminus of the array (Fig. 1D). We have shown that subtle changes in the PRDM9 ZnF array can have a major impact on the activity of A-regulated hotspots (9). Further, not all A-activated hotspots contain an obvious A motif. A similar phenomenon is seen at Ct-activated hotspots (Fig. 2); again not all hotspots show an obvious C motif (Fig. 3), and each hotspot is activated by different sets of PRDM9 variants that should all recognize the same motif. Some hotspots (e.g., hotspot 12D) are broadly tuned to diverse variants although with considerable variation in ability to activate the hotspot, whereas other hotspots are more narrowly tuned, in particular hotspot 12B. Activating variants at one hotspot can be nonactivating at another, and vice versa (e.g., variants C, L6, and L14 at hotspots 12B and PAR2A; Fig. 2). Regions of the ZnF array distal to the motif-defining domain also appear to influence activity. For example, alleles L6 and L14 differ by insertion/deletion of a single ZnF upstream of the motif domain, and this change has a diversity of effects—hotspot 12D is not affected, hotspot 5A is shifted in location, and hotspots 12B and PAR2A can fail to be activated but by opposite variants. Likewise, the C-terminal repeat seems to influence activation, because its deletion in L15 appears to lead to nonactivation of hotspot 22A, although not of hotspots 5A and 12D.
This differential activation of hotspots by specific PRDM9 variants in a fashion that seems unpredictable and not obviously dependent on the presence of a binding motif is highly perplexing (9). One possible explanation is that the binding specificity and affinity of the zinc finger array is modified by the local chromatin environment specific to each hotspot and, perhaps, by additional interacting proteins, resulting in a motif specific for each hotspot and potentially divergent from the consensus motif defined by genome-wide comparisons of hotspots (2, 4). Clearly this issue can only be resolved by studies directly addressing PRDM9 interactions with targets in vivo.
Finally, we have previously shown that aspects of genome instability can be influenced by the PRDM9 status of an individual, with minisatellite instability and two genomic rearrangements arising preferentially only in individuals with the PRDM9 A variant (9). The existence of PRDM9 Ct variants strongly predicts minisatellites with instability driven by Ct, as well as Ct-dependent pathological genome rearrangements that should arise far more frequently in Africans than in Europeans. Whole-genome comparisons of copy number changes in Europeans and Africans, and the discovery of genomic disorders specific to Africans, could open the way to exploring PRDM9 Ct-dependent modes of genome instability.
Materials and Methods
DNA Diversity Analyses.
Semen samples were collected with approval from the Leicestershire Health Authority Research Ethics Committee and with informed consent. PRDM9 minisatellite alleles were sequenced as described (9) from 103 British semen donors of north European descent, 33 British Asian donors of Indian (primarily Gujarati) descent, and 74 African donors, primarily from Southern East Africa. PRDM9 ZnF binding motifs were predicted as described (5, 9). ZnF allele structures, predicted PRDM9 binding motifs, and allelic population frequencies are given in Fig. S1. LDMAP was used to create metric LD maps (27) across the subtelomeric regions of chromosomes 1q, 2p, 3p, 4p, 5p, 6p, 7p, 8p, 8q, 12p, 16p, 22q, and X/Y PAR2 (0.1–5 Mb scanned per subtelomeric region), using genotype data from the Phase III HapMap dataset (release 27) (http://www.hapmap.org). African-enhanced LD hotspots were identified as narrow (<5 kb) LDU steps of >0.5 averaged over four African populations and with a mean European/Indian step size of <30% of that seen in Africans. Historical recombination frequencies at these LD hotspots were estimated by coalescent analysis by using LDhat (14), assuming effective population sizes of 10,000.
Cross-Over Analysis.
All 74 African semen donors plus 103 Europeans and two Indians, including all those with atypical-length PRDM9 alleles, were genotyped for all SNPs across the six African-enhanced LD hotspots. Men for cross-over analysis were selected based on appropriate hotspot genotypes and PRDM9 status. Cross-overs at hotspots 2A, 5A, 12B, 12D, and 22A were detected by nested repulsion-phase allele-specific long PCR as described (9) using the allele-specific primers listed in Table S4. Cross-over mapping was conducted as described (3, 12) by using information on cross-over frequencies to optimize the recovery of typically 120 cross-over molecules in each orientation for each man tested (A-D and B-C cross-overs from a man carrying A-C and B-D haplotypes). Cross-overs plus nonexchange conversions at hotspot PAR2A and for two men at hotspot 5A were simultaneously detected and mapped by using half-cross over assays (17, 28) in which nested allele-specific PCR, on multiple pools of sperm DNA containing 20–60 amplifiable molecules, was directed to markers at one end of the test interval, resulting in amplification of one haplotype. Recombinants were detected by the presence of markers from the unselected haplotype in the amplified DNA. Cross-over and conversion frequencies were estimated by assuming a single DNA molecule PCR efficiency of 50% throughout (3, 12) and are listed for each man tested in Table S2. The frequencies and distributions of cross-overs detected in normal cross-over assays and half–cross-over assays performed on the same men were indistinguishable. A 1.5-kb interval spanning the center of each hotspot was resequenced in most mapped donors to maximize the number of SNP markers and to search for variants that might influence hotspot activity in cis.
Supplementary Material
Acknowledgments
We thank J. Blower and volunteers for providing semen samples; Celia May, colleagues, and reviewers for helpful discussions; and the Medical Research Council, the Wellcome Trust (Ref. 081227/Z/06/Z), the Boehringer Ingelheim Fonds, the Royal Society, and the Louis-Jeantet Foundation for funding support.
Footnotes
The authors declare no conflict of interest.
This article contains supporting information online at www.pnas.org/lookup/suppl/doi:10.1073/pnas.1109531108/-/DCSupplemental.
References
- 1.Myers S, Bottolo L, Freeman C, McVean G, Donnelly P. A fine-scale map of recombination rates and hotspots across the human genome. Science. 2005;310:321–324. doi: 10.1126/science.1117196. [DOI] [PubMed] [Google Scholar]
- 2.Kong A, et al. Fine-scale recombination rate differences between sexes, populations and individuals. Nature. 2010;467:1099–1103. doi: 10.1038/nature09525. [DOI] [PubMed] [Google Scholar]
- 3.Jeffreys AJ, Kauppi L, Neumann R. Intensely punctate meiotic recombination in the class II region of the major histocompatibility complex. Nat Genet. 2001;29:217–222. doi: 10.1038/ng1001-217. [DOI] [PubMed] [Google Scholar]
- 4.Myers S, Freeman C, Auton A, Donnelly P, McVean G. A common sequence motif associated with recombination hot spots and genome instability in humans. Nat Genet. 2008;40:1124–1129. doi: 10.1038/ng.213. [DOI] [PubMed] [Google Scholar]
- 5.Baudat F, et al. PRDM9 is a major determinant of meiotic recombination hotspots in humans and mice. Science. 2010;327:836–840. doi: 10.1126/science.1183439. [DOI] [PMC free article] [PubMed] [Google Scholar]
- 6.Myers S, et al. Drive against hotspot motifs in primates implicates the PRDM9 gene in meiotic recombination. Science. 2010;327:876–879. doi: 10.1126/science.1182363. [DOI] [PMC free article] [PubMed] [Google Scholar]
- 7.Parvanov ED, Petkov PM, Paigen K. Prdm9 controls activation of mammalian recombination hotspots. Science. 2010;327:835. doi: 10.1126/science.1181495. [DOI] [PMC free article] [PubMed] [Google Scholar]
- 8.Paigen K, Petkov P. Mammalian recombination hot spots: Properties, control and evolution. Nat Rev Genet. 2010;11:221–233. doi: 10.1038/nrg2712. [DOI] [PMC free article] [PubMed] [Google Scholar]
- 9.Berg IL, et al. PRDM9 variation strongly influences recombination hot-spot activity and meiotic instability in humans. Nat Genet. 2010;42:859–863. doi: 10.1038/ng.658. [DOI] [PMC free article] [PubMed] [Google Scholar]
- 10.International HapMap Consortium A haplotype map of the human genome. Nature. 2005;437:1299–1320. doi: 10.1038/nature04226. [DOI] [PMC free article] [PubMed] [Google Scholar]
- 11.Frazer KA, et al. International HapMap Consortium A second generation human haplotype map of over 3.1 million SNPs. Nature. 2007;449:851–861. doi: 10.1038/nature06258. [DOI] [PMC free article] [PubMed] [Google Scholar]
- 12.Webb AJ, Berg IL, Jeffreys A. Sperm cross-over activity in regions of the human genome showing extreme breakdown of marker association. Proc Natl Acad Sci USA. 2008;105:10471–10476. doi: 10.1073/pnas.0804933105. [DOI] [PMC free article] [PubMed] [Google Scholar]
- 13.Jeffreys AJ, Neumann R. The rise and fall of a human recombination hot spot. Nat Genet. 2009;41:625–629. doi: 10.1038/ng.346. [DOI] [PMC free article] [PubMed] [Google Scholar]
- 14.McVean GA, et al. The fine-scale structure of recombination rate variation in the human genome. Science. 2004;304:581–584. doi: 10.1126/science.1092500. [DOI] [PubMed] [Google Scholar]
- 15.Freije D, Helms C, Watson MS, Donis-Keller H. Identification of a second pseudoautosomal region near the Xq and Yq telomeres. Science. 1992;258:1784–1787. doi: 10.1126/science.1465614. [DOI] [PubMed] [Google Scholar]
- 16.Jeffreys AJ, Neumann R. Reciprocal crossover asymmetry and meiotic drive in a human recombination hot spot. Nat Genet. 2002;31:267–271. doi: 10.1038/ng910. [DOI] [PubMed] [Google Scholar]
- 17.Jeffreys AJ, May CA. Intense and highly localized gene conversion activity in human meiotic crossover hot spots. Nat Genet. 2004;36:151–156. doi: 10.1038/ng1287. [DOI] [PubMed] [Google Scholar]
- 18.Broman KW, Murray JC, Sheffield VC, White RL, Weber JL. Comprehensive human genetic maps: individual and sex-specific variation in recombination. Am J Hum Genet. 1998;63:861–869. doi: 10.1086/302011. [DOI] [PMC free article] [PubMed] [Google Scholar]
- 19.Kong A, et al. A high-resolution recombination map of the human genome. Nat Genet. 2002;31:241–247. doi: 10.1038/ng917. [DOI] [PubMed] [Google Scholar]
- 20.Jeffreys AJ, Neumann R, Panayi M, Myers S, Donnelly P. Human recombination hot spots hidden in regions of strong marker association. Nat Genet. 2005;37:601–606. doi: 10.1038/ng1565. [DOI] [PubMed] [Google Scholar]
- 21.Jeffreys AJ, Neumann R. Factors influencing recombination frequency and distribution in a human meiotic crossover hotspot. Hum Mol Genet. 2005;14:2277–2287. doi: 10.1093/hmg/ddi232. [DOI] [PubMed] [Google Scholar]
- 22.Boulton A, Myers RS, Redfield RJ. The hotspot conversion paradox and the evolution of meiotic recombination. Proc Natl Acad Sci USA. 1997;94:8058–8063. doi: 10.1073/pnas.94.15.8058. [DOI] [PMC free article] [PubMed] [Google Scholar]
- 23.Coop G, Myers SR. Live hot, die young: transmission distortion in recombination hotspots. PLoS Genet. 2007;3:e35. doi: 10.1371/journal.pgen.0030035. [DOI] [PMC free article] [PubMed] [Google Scholar]
- 24.Neumann R, Jeffreys AJ. Polymorphism in the activity of human crossover hotspots independent of local DNA sequence variation. Hum Mol Genet. 2006;15:1401–1411. doi: 10.1093/hmg/ddl063. [DOI] [PubMed] [Google Scholar]
- 25.Ptak SE, et al. Fine-scale recombination patterns differ between chimpanzees and humans. Nat Genet. 2005;37:429–434. doi: 10.1038/ng1529. [DOI] [PubMed] [Google Scholar]
- 26.Winckler W, et al. Comparison of fine-scale recombination rates in humans and chimpanzees. Science. 2005;308:107–111. doi: 10.1126/science.1105322. [DOI] [PubMed] [Google Scholar]
- 27.Maniatis N, et al. The first linkage disequilibrium (LD) maps: delineation of hot and cold blocks by diplotype analysis. Proc Natl Acad Sci USA. 2002;99:2228–2233. doi: 10.1073/pnas.042680999. [DOI] [PMC free article] [PubMed] [Google Scholar]
- 28.Kauppi L, May CA, Jeffreys AJ. Analysis of meiotic recombination products from human sperm. Methods Mol Biol. 2009;557:323–355. doi: 10.1007/978-1-59745-527-5_20. [DOI] [PubMed] [Google Scholar]
Associated Data
This section collects any data citations, data availability statements, or supplementary materials included in this article.


