Abstract
The cannabinoid CB1 receptor is a Class A G-protein coupled receptor (GPCR) that is the most widely expressed GPCR in the brain. Many GPCRs contain allosteric binding sites for endogenous and/or synthetic ligands, which are topographically distinct from the agonist-binding site, which is known as the orthosteric site. While both endogenous and synthetic ligands that act at the CB1 orthosteric site have been known for some time, compounds that act at a CB1 allosteric site have only recently been discovered. The most studied of these is 5-Chloro-3-ethyl-1H-indole-2-carboxylic acid [2-(4-piperidin-1-ylphenyl)ethyl]amide (Org27569). Because allosteric ligands are thought to act through conformational changes in the receptor that are transmitted from the allosteric to the orthosteric site, computational studies of the structural and dynamic interactions of Org27569 with the CB1 receptor are crucial to achieve a molecular level understanding of the basis of action of this important new class of compounds. To date, such computational studies have not been possible due to the lack of a complete set of molecular mechanics force field parameters for Org27569. Here we present the development of missing CHARMM force field parameters for Org27569 using previously published methods and the validation and application of these new parameters using normal mode analysis and molecular dynamics simulations combined with experimental IR measurements.
Keywords: CHARMM, parameter, cannabinoid, allosteric modulator, G protein-coupled receptor
Introduction
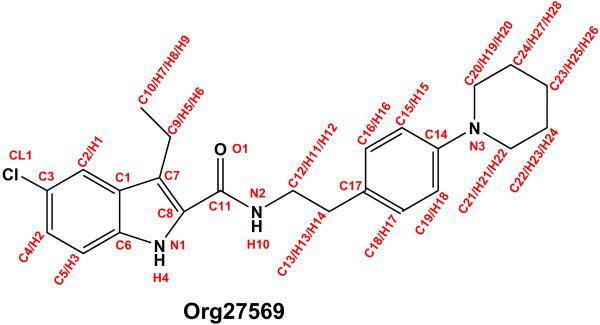
The CB1 receptor is a Class A G-protein coupled receptor (GPCR) that is the most widely expressed GPCR in the brain. CB1 is found at central and peripheral nerve terminals where it contributes to the modulation of transmitter release.1 A wide range of therapeutic uses have been associated with CB1 agonists, including appetite stimulation, analgesia, anti-emesis, antidiarrhea, antispasmodic, anti-proliferation and anti-glaucoma. The major therapeutic use associated with CB1 antagonists is appetite supression.2 Many GPCRs contain allosteric binding sites for endogenous and/or synthetic ligands, which are topographically distinct from the agonist-binding site, which is known as the orthosteric site.3 While both endogenous and synthetic ligands that act at the CB1 orthosteric site have been known for some time, compounds that act at a CB1 allosteric site have only recently been discovered.4–6 The most studied of these is 5-Chloro-3-ethyl-1H-indole-2-carboxylic acid [2-(4-piperidin-1-ylphenyl)ethyl]amide (Org27569; Figure 1). ORG27569 has a ligand dependent effect in that it enhances the binding of the CB1 agonist, CP55,940 but inhibits the binding of the CB1 antagonist SR141716A.4 While Org27569 increases the binding of the agonist CP55,940, it inhibits its signalling efficacy.4, Because inhibition of CB1 signalling produces appetite supression, one potential therapeutic use for ORG27569 and similar compounds is for the treatment of obesity.6
Figure 1.
The structure of Org27569 is illustrated here along with the atomic numbering convention used in this work. Atom labels were assigned based upon atom types from the CGenFF library. Atom names were changed from six characters to three to be compatible with CHARMM27.
In contrast to the direct effects on receptor function that are mediated by orthosteric ligands, allosteric ligands are thought to act through conformational changes in the receptor that are transmitted from the allosteric to the orthosteric site and/or to effector coupling sites.3 Computational studies of the structural and dynamic interactions of Org27569 with the CB1 receptor are crucial to achieve a molecular level understanding of the basis of action of this important new class of compounds. To date, it has not been possible to study this dynamic behavior via molecular dynamics (MD) using the CHARMM force field7,8, for example, due to the lack of a complete set of corresponding force field parameters for ORG27569. Here we present the development and validation of missing CHARMM force field parameters for the CB1 allosteric modulator, Org27569. A well established parameterization method for developing CHARMM force field parameters which uses QM data for comparison was applied to this system.7,8 The recently published CHARMM General Force Field (CGenFF) database was used as a starting point here as it includes more organic compounds than present in the previously generated topology and parameter files for CHARMM.9 We report here the infrared (IR) spectrum of ORG27569, which was used for comparison to a calculated MM IR spectrum of ORG27569 during parameter refinement. To verify the development of accurate parameters, a normal mode analysis (NMA) was conducted to compare calculated QM and MM frequencies.
Methods
The potential energy function applied by CHARMM is given in equation (1) below.
| (1) |
where Kb, Kθ, KUB, Kφ, Kψ are respectively the bond, angle, Urey-Bradley, dihedral, and improper dihedral force constants; b, θ, s, φ, ψ are respectively the bond length, bond angle, Urey-Bradley distance, dihedral angle, and improper dihedral angle, where the subscript zero represents the equilibrium value of each. The dihedral value also incorporates n, the periodicity, and δ, the phase. In the CHARMM force field nonbonded interactions, including attractive van der Waals dispersion as well as short range repulsion, are included via the Lennard Jones 6–12 potential, while electrostatic interactions are included using the Coulombic potential. In equation 1, Rmin is the distance between atoms at the Lennard-Jones minimum and ε is the well depth. The partial atomic charges, q, and the effective dielectric constant, ε1, are both included in the Coulombic contribution. Lastly, rij is the distance between atoms i and j.7
Force field parameters for Org27569 were calculated by comparison to quantum mechanical (QM) calculated data. The structure of Org27569 is displayed in Figure 1 along with the atomic naming convention used in this work. Atom types in Org27569 were assigned according to those used in the CGenFF database9 and are listed in Table 1 for each atom number which is labeled in Figure 1. The CGenFF types,9 which the current Org27569 parameters were derived from, are listed in Table 2.
Table 1.
Listing of Atom Names, Types, and Partial Charges for Org27569 (see Figure 1 for atom numbering system).
| Atom | Type | Partial Chargea | Atom | Type | Partial Chargea |
|---|---|---|---|---|---|
| C1 | CL1 | −0.13 | H7/H8/H9 | HG3 | 0.09 |
| C1 | CC0 | 0.11 | C11 | CO1 | 0.51 |
| C2 | C61 | −0.15 | O1 | OD1 | −0.51 |
| H1 | H62 | 0.13 | N2 | NG1 | −0.47 |
| C3 | C61 | 0.03 | H10 | HP1 | 0.47 |
| C4 | C61 | −0.15 | C12/C13 | C21 | −0.18 |
| H2 | H62 | 0.13 | H11/H12/H13/H14 | HG2 | 0.09 |
| C5 | C61 | −0.27 | C17 | C61 | 0.0 |
| H3 | H61 | 0.16 | C15/C16/C18/C19 | C61 | −0.115 |
| C6 | CC0 | 0.24 | H15/H16/H17/H18 | H61 | 0.115 |
| C7 | C51 | −0.03 | C14 | C61 | 0.14 |
| C8 | C51 | 0.07 | N3 | N31 | −0.50 |
| N1 | N51 | −0.51 | C20/C21 | C21 | 0.0 |
| H4 | HP1 | 0.37 | C22/C23/C24 | C21 | −0.18 |
| C9 | C21 | −0.18 | H19/H22 | HG2 | 0.09 |
| H5/H6 | HG2 | 0.09 | H23–H28 | HG2 | 0.09 |
| C10 | C31 | −0.27 |
Partial Charges are taken from the CGenFF database9 except for C14, N3, C20, C21, H21, H22, H23, and H24
Table 2.
CGenFF Atom Types Initially Assigned to Org27569
| Org27569 Atom Type | CGenFF Atom Type | Org27569 Atom Type | CGenFF Atom Type |
|---|---|---|---|
| C61 | CG2R61 | H62 | HGR62 |
| CCO | CG2RC0 | H61 | HGR61 |
| C21 | CG321 | HP1 | HGP1 |
| C31 | CG331 | HG2 | HGA2 |
| CO1 | CG2O1 | HG3 | HGA3 |
| C51 | CG2R51 | N31 | NG301 |
| CL1 | CLGR1 | NG1 | NG2S1 |
| OD1 | OG2D1 | N51 | NG2R51 |
Model Compounds
In order to conserve computational time, model compounds were used to represent portions of Org27569 during the parameterization of charges and torsion angles. These model compounds were chosen so that as many of the atom types present in Org27569 were unchanged and the developed torsion parameters would be as applicable to Org27569 as possible. Figure 2A–D shows the model compounds used for charge (2A) and torsion parameter (2B–D) development.
Figure 2.
This figure shows the structures of model compounds used to develop charge and torsion parameters. (A) Model Compound A represents the benzene to piperidine ring linkage in Org27569 and was used for development of charge parameters for the nitrogen (N3) and its surrounding atoms (C14, C20 (H19/H20) and C21 (H21/H22)). (B) Model Compound B represents the indole to amide linkage in which a pyrrole ring replaces the larger indole moiety. This model compound was used in torsion parameter development. (C) Model Compound C represents the benzene to piperidine ring linkage where the two methyls were restrained to the position that they would occupy in a piperidine ring. This model compound was used in torsion parameter development. (D) Model Compound D represents the ethyl linker between the amide group and benzene ring. This model compound was used in torsion parameter development.
Non-bonded Parameters
Partial charges for Org27569 atoms were taken from chemically similar atoms present in the CGenFF database.9 The calculation of missing charge parameters was based on QM data for Org27569 and charge fitting was done according to the established CHARMM procedure which calculates the QM and MM interaction energy profiles between a water molecule and the model compound and compares them.7–9
Initial charges for each missing atom were calculated using the RESP calculator in NWChem 5.1.1.10 The water O-H distance was frozen at 0.957Å and the H-O-H angle were fixed at 104.6 degrees respectively. A CHARMM script, available via the CHARMM parameterization tutorial, was modified and used to place waters in positions appropriate for interaction with relevant atoms with missing charges (see http://dogmans.umaryland.edu/~kenno/tutorial/). The internal coordinates of each model compound were taken from the geometry optimized structure using NWChem 5.1.1 at the MP2/6–31G* level of theory. Jaguar11 was then used to perform a rigid coordinate scan which held the water and model compound complex in a constant position except for the distance between the water molecule and the selected atom of the model compound which was varied from 1.8–4.6 Å. By calculating the energy of the complex and subtracting the respective single-point energies of the water and the model compound (calculated at the HF/6–31G* level), an interaction energy profile was determined. The QM distances were first shifted (by 0.2Å) to shorter values and compared to the CHARMM distances. This shifting is performed in order to account for deficiencies in the Hartree-Fock model. In addition, the QM interaction energies were scaled by 1.16 to account for the polarization effects in the condensed phase.7,12 The same CHARMM script that places the waters initially also calculates the MM interaction energies using the same principle as the Jaguar QM calculations. Upon comparison, the MM force field charges were manually adjusted and the interaction energies were recalculated until the MM and scaled QM interaction energy minima were within 0.2 kcal/mol, the interaction distance was within 0.2 Å, and the MM dipole moment was about 22% larger than the Hartree-Fock calculated QM dipole moment. The remaining non-bonded parameters, e.g. the Lennard-Jones terms were taken directly from the CGenFF data,9 but are reproduced for completeness in Table S5 of the supplementary information.
Internal Parameters
Many of the bond and angle parameters needed for Org27569 were already present in the CGenFF database.9 If a parameter for a bond or angle was missing, force constants, equilibrium bond lengths and bond angles listed for similar atom type interactions were used as a substitute. Moreover, similar to the Lennard-Jones parameters, the Urey-Bradley terms were also taken directly from the CGenFF database9 and are reproduced in Table S3 of the supplementary information. Because of the larger implication of the torsional force constants on the overall conformation of the molecule, only a few dihedrals were substituted in this way. Several angle and torsion parameters were substituted from a paper published on the calculation of CHARMM force field parameters for the organic compound netropsin.13 These parameters were transferred because netropsin shares similar functional groups with Org27569 and the parameters were calculated according to a similar method as applied here for the CHARMM force field. The remaining missing dihedral parameters were calculated according to the published CHARMM parameterization procedure.14 This process compares the QM potential energy surface with the CHARMM calculated surface for each dihedral and using a Monte Carlo simulated annealing approach provides parameters that optimize the fit of the molecular mechanics dihedral surface to the quantum mechanical one.
The energy surfaces of each model compound were determined by rotating a subject torsion angle 360 degrees in increments of 10 degrees (or 180 degrees when the model compound was symmetric), thus creating 36 separate conformers (or 18) of the compound. Each of these conformers was optimized using HF/6–31G* in NWChem 5.1.1 with the rotated torsion held constant. A single-point energy calculation using MP2/6–31G* was then performed on each conformer. These energies were used to create a potential energy surface for each missing torsion angle. For model compounds with more than one torsion angle missing, a separate potential energy surface was calculated for each dihedral.
In order to create an MM potential energy surface, each conformer was minimized using CHARMM with the missing torsion held constant. The potential energy surface created by CHARMM must reproduce the QM calculated surface for each torsion angle of interest. By using Guvench and MacKerell's Monte Carlo simulated annealing method14 and their provided script (fit_dihedral.tar.gz and is available for downloading at http://mackerell.umaryland.edu/CHARMM_ff_params.html) the QM and MM potential energies were compared and the dihedral parameters were optimized. By testing different periodicity values, torsion parameters that generate a potential energy surface equivalent to the QM values were produced.
In some cases, multiple dihedrals that involved different rotatable bonds were missing in a model compound. For these compounds, the torsion parameter closest to the least flexible part of the molecule was varied and determined first (e.g. the torsion closest to a benzene ring), then the next closest dihedral was varied and determined. An iterative process was used to return to the first dihedral tested after determining values for the second dihedral until agreement of all missing dihedrals' potential energy surfaces were as accurate as possible. Torsion parameters transferred from the parameterization of netropsin13 were tested with the same procedure used to calculate new torsion parameters in order to assure their applicability to Org27569.
A conformational search using HF/6–31G* was performed on Org27569 using Spartan to identify possible minimum energy structures. Two resulting energy minima structures were used in order to test the developed parameters' accuracy in reproduction of these conformers. Parameters that resulted in inaccurate dihedral conformations were adjusted manually until the bond, angle, and dihedral measurements were accurately reproduced in both energy minima conformers within 0.3Å, 3°, or 8° respectively of their QM values.
Infrared Spectrum of ORG27569
5-Chloro-3-ethyl-1H-indole-2-carboxylic acid [2-(4-piperidin-1-ylphenyl)ethyl]amide (ORG27569) was obtained from Sigma-Aldrich (Product #O8014) as a solid with ≥ 98% purity. The IR spectrum of Org27569 (as a solid) was obtained using a Perkin Elmer Spectrum 65 FT-IR Spectrometer (0.5 cm−1 resolution). An in vacuo MD simulation of Org27569 using the currently developed CHARMM parameters was performed in order to calculate an infrared spectrum. The molecule was first heated to 300K, then a 100ps equilibration run at 300K was performed, followed by 150ps of MD in vacuum at 300K. The IR spectrum was calculated from the final 50ps of the MD simulation using the IR Spectral Density Calculator Plugin for VMD Version 1.8.7. This was repeated three times and the spectra were averaged. To account for inhomogeneous line broadening in the solid state, the averaged spectrum was convoluted with a Gaussian of width 5cm−115 Force constants were adjusted as needed to produce agreement with the experimental spectrum. Finally, a quantum mechanical normal mode analysis (NMA) was performed at the HF(6–31G*) level using Jaguar, and compared to the frequencies obtained via NMA using these final CHARMM parameters for Org27569.
Results and Discussion
In this section, we present the optimized CHARMM force field parameters for use with the CGenFF database.9 Table 1 lists all the atom names and types for Org27569. Table 2 provides a list of CGenFF atom types that were used as starting points for the development of the Org27569 CHARMM parameters.
Charge parameters
Charge calculations were necessary for N3 and its adjacent carbons and hydrogens, C14, C20, C21, H19, H20, H21, and H22 in the piperidine ring and adjacent benzene ring of Org27569 (see Figure 1). The model compound used for these calculations is shown in Figure 2A with labeled atom numbers. The CGenFF database applies a charge of −0.115q to all aromatic carbons not bonded to heteroatoms and an equal and opposite charge to their hydrogen atoms. It also applies a charge of 0.09q to all aliphatic hydrogen atoms and an opposite charge that is the sum of all hydrogen atoms bonded to an aliphatic carbon if that carbon atom is not bonded to a heteroatom. In the model compound, all atoms that fell under these guidelines were restricted to those charges. The rest were allowed to vary, but note that C21 and C22 were constrained to be equal due to of the symmetry in the piperidine ring.
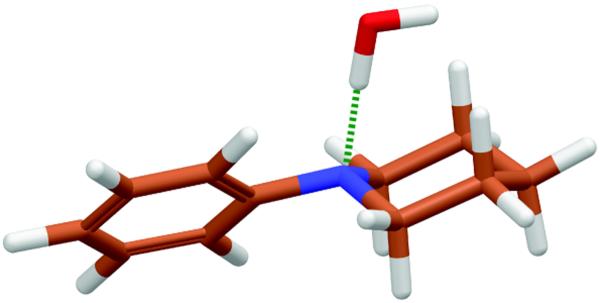
Interaction energies were not calculated for C20, H19, and H20 because they are equivalent to C21, H21, and H22. The interaction energies for N3 were found to vary the most with respect to charge changes. The interaction energy minima for H21 and H22 were not affected even by major changes in the charges for surrounding atoms. Therefore, the final charge parameters were developed to optimize the minimum in the interaction energy between a water molecule and the N3 of model compound A. This complex is shown in Figure 3. The MM minimum and the adjusted QM minimum for the complex between a water molecule and the N3 of compound A as well as the dipole moment produced by each method are presented in Table 3. The CHARMM interaction energy is within 0.25 kcal/mol of the QM value and the minimum distance is within 0.1 Å. The dipole moment calculated by CHARMM is 36% larger than the QM dipole moment. The final charges for all the atoms are reported in Table 1.
Figure 3.
This figure shows the water/Model Compound A complex used for the interaction energy calculation between water and N3.
Table 3.
Final Interaction Energy, Distance and Dipole Moment for Model Compound 2A.
| Jaguar QM | CHARMM | |
|---|---|---|
| Interaction Energy | −5.958 kcal/mol | −6.199 kcal/mol |
| Interaction Distance | 2.1 Å | 2.0 Å |
| Dipole Moment | 0.957 D | 1.298 D |
Internal Parameters
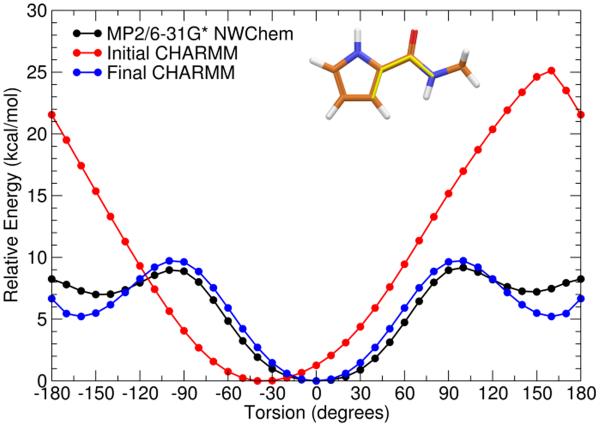
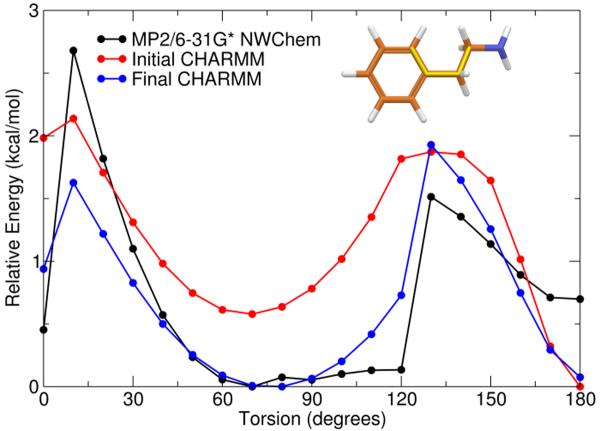
The bond and angle parameters were initially assigned by substituting with other, already existing, parameters from the CGenFF database9 or the recently published values for netropsin.13 A full listing of all bond and angle parameters is provided in Tables S1 and S2 of the supplementary information. Many of the missing bond, angle and torsion parameters involved the flexible regions of ORG27569 that connect the rings. Torsion parameters are of primary importance because they have a direct effect on the energy minima that the molecule will occupy. While compound A in Figure 2 was used exclusively for the development of missing charges, model compounds B–D in Figure 2 were used to develop missing dihedral parameters for Org27569. The model compound and particular torsion studied are shown above their respective potential energy surface (see Figures 4–7).
Figure 4.
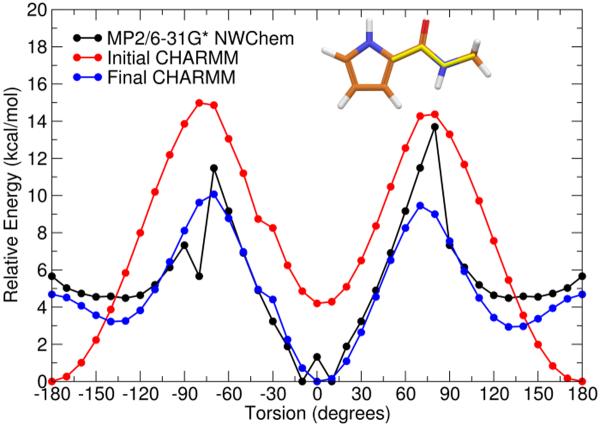
Potential energy surface of first rotatable bond (C8–C11) of Model Compound B showing the QM surface calculated at the MP2/6–31 G* level (black), the initial MM surface (red), and the final MM surface (blue) after development of parameters for both rotatable bonds of Model Compound B. Inset: Structure of Model Compound B is illustrated with bond rotated in this study highlighted in yellow.
Figure 7.
Potential energy surface of C17-C13 rotatable bond for Model Compound D showing the QM surface calculated at the MP2/6–31 G* level (black), the initial MM surface (red), and the final MM surface (blue) after development of parameters involved in the C17-C13 rotatable bond. Inset: Structure of Model Compound D is illustrated with bond rotated in this study highlighted in yellow.
The first missing section of torsion angles was the C7–C8–C11-N2 and C8–C11-N2-C12 region of the indole/amide connection. Several torsion parameters for this region were found in the CHARMM force field parameters for netropsin. Using the model compound shown in Figure 2B, the two torsions mentioned previously and six other missing torsions involving the same rotatable bonds were tested. A pyrrole was used in place of the indole in order to reduce calculation time because the rigidity of the pyrrole was expected to emulate the torsional restraints that would be found in an indole ring. By calculating these eight new parameters and also checking the parameters developed for netropsin, the molecular mechanics surfaces shown in Figures 4 and 5 resulted.
Figure 5.
Potential energy surface of second rotatable bond (C11-N2) of Model Compound B showing the QM surface calculated calculated at the MP2/6–31 G* level (black), the initial MM surface (red), and the final MM surface (blue) after development of parameters for both rotatable bonds of Model Compound B. Inset: Structure of Model Compound B is illustrated with bond rotated in this study highlighted in yellow.
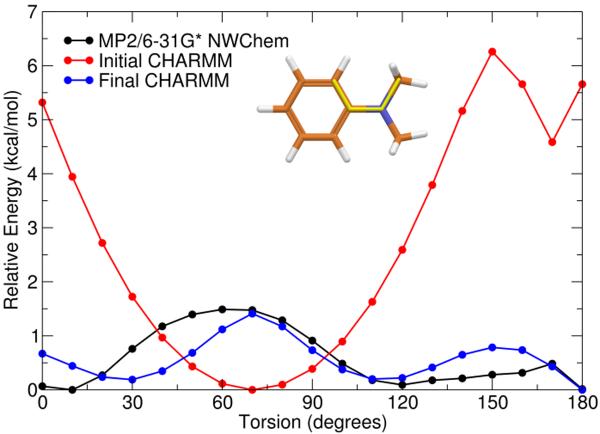
The model compound shown in Figure 2C was used to model the benzene-piperidine connection (C14-N3). Both methyl groups in the dimethylamine were restrained to the geometry that would be found in a piperidine ring while the torsion angle between the benzene carbon atom connected to the nitrogen atom of the N-methyl amine was rotated and optimized. The QM and initial and final MM potential energy surfaces are shown in Figure 6.
Figure 6.
Potential energy surface of C14-N3 rotatable bond for Model Compound C showing the QM surface calculated at the MP2/6–31 G* level (black), the initial MM surface (red), and the final MM surface (blue) after development of parameters involved in the C14-N3 rotatable bond. Inset: Structure of Model Compound C is illustrated with bond rotated in this study highlighted in yellow.
Torsions involved in the C16–C17-C13-C12 linkage between the ethyl chain and the benzene ring were also missing. The model compound shown in Figure 2D was used to develop those parameters. Although this model compound has two rotatable bonds involving the ethyl chain, only the torsions involving two carbons from the benzene were missing parameters. The QM and initial and final MM potential energy surfaces are shown in Figure 7. The dihedral parameters developed in this work are presented in Table 6, and a full listing of all dihedral parameters necessary for a complete description of Org27569 is given in table S4 of the supplementary information.
Table 6.
Dihedral Parameters Developed for Org27569 Parameters altered during the conformational analysis test are listed in bold.
| Type | Type | Type | Type | Ka | na | δ a | Sourceb |
|---|---|---|---|---|---|---|---|
| C51 | C51 | C21 | C31 | 0.400 | 1 | 0 | CGenFF |
| 0.270 | 2 | 0 | CGenFF | ||||
| 0.000 | 3 | 0 | CGenFF | ||||
| C61 | C61 | C61 | N31 | 0.000 | 2 | 0 | CGenFF |
| C21 | C21 | NG1 | CO1 | 0.500 | 1 | 180 | CGenFF |
| HG2 | C21 | N31 | C61 | 0.000 | 3 | 0 | CGenFF |
| CC0 | N51 | C51 | CO1 | 6.700 | 1 | −10.00 | Netropsina |
| C51 | CO1 | NG1 | HP1 | 0.600 | 1 | 0 | Netropsin |
| CC0 | C51 | C51 | CO1 | 3.000 | 1 | 0 | Netropsin |
| HP1 | N51 | C51 | CO1 | 0.500 | 1 | 180 | Netropsin |
| C21 | C51 | C51 | CO1 | 6.700 | 1 | −175 | Netropsin |
| NG1 | C61 | C61 | H61 | 2.700 | 2 | 180 | Calculated |
| C61 | C61 | C21 | C21 | 0.150 | 6 | 0 | Calculated |
| C61 | C61 | C21 | HG2 | 0.210 | 3 | 180 | Calculated |
| NG1 | C21 | C21 | HG2 | 0.210 | 2 | 0 | Calculated |
| 0.200 | 3 | 180 | Calculated | ||||
| HG2 | C21 | NG1 | HP1 | 0.000 | 3 | 0 | Calculated |
| C21 | C21 | NG1 | HP1 | 0.200 | 3 | 0 | Calculated |
| 0.200 | 4 | 180 | Calculated | ||||
| C51 | CO1 | NG1 | C21 | 3.000 | 1 | 0 | Calculated |
| 3.000 | 3 | 0 | Calculated | ||||
| C61 | C61 | N31 | C21 | 1.500 | 2 | 180 | Calculated |
| N51 | C51 | CO1 | NG1 | 1.500 | 1 | 0 | Calculated |
| 0.200 | 2 | 180 | Calculated | ||||
| N51 | C51 | CO1 | OD1 | 0.600 | 2 | 0 | Calculated |
| C51 | C51 | CO1 | OD1 | 1.200 | 2 | 180 | Calculated |
| C51 | C51 | CO1 | NG1 | 0.800 | 2 | 180 | Calculated |
| 0.200 | 3 | 180 | Calculated | ||||
| 0.600 | 4 | 0 | Calculated | ||||
| C61 | C21 | C21 | NG1 | 0.090 | 1 | 180 | Calculated |
| 2.800 | 2 | 0 | Calculated | ||||
| 1.600 | 3 | 0 | Calculated | ||||
| N31 | C61 | C61 | H61 | 2.400 | 2 | 180 | Calculated |
Parameters altered during the conformational analysis test are listed in bold.
Parameters labeled Netropsin are substituted from the development of parameters for the small molecule netropsin.17
Refinement
In order to verify the accuracy of the developed charge and torsion parameters, the lowest energy conformers of Org27569 were used as input structures in a CHARMM minimization to test the ability of the present CHARMM force field to reproduce the structure of Org27569. A conformational search was performed on Org27569 resulting in the two lowest energy conformations shown in Figure 8 which have been geometry optimized at the Hartree Fock 6–31G* level.. The bent conformer (shown in magenta) is the global minimum energy conformer, while the elongated conformer (shown in yellow) represents a local minimum energy conformation. The energy separation between these two minima was found to be 0.757 kcal/mol. Based on the changes to bonds, angles, or torsions that resulted when the QM lowest energy structures were minimized with CHARMM, the developed parameters relevant to the changes were then adjusted manually until optimal structures resulted for both of these conformers. Because changing one parameter results in a change in the minimizations of both minimum energy conformers, it was necessary to iteratively alter the parameters by testing each change with both conformers to ensure that one conformer was not negatively affected by a change that helped the other conformer. The bond, bending, and torsion parameters which were adjusted in this refinement process are summarized in Tables 4–6.
Figure 8.
The two lowest energy conformers of Org27569 elucidated during a conformational search at the Hartree-Fock level of theory using the 6–31G* basis set using Spartan. The bent conformer (shown in magenta) is the global minimum energy conformer, while the elongated conformer (shown in yellow) represents the local minimum energy conformation. These two conformers were used to increase the accuracy of the parameters under development here.
Table 4.
Bond parameters developed for Org27569
| Type | Type | Kba | bob | Type | Type | Kba | bob |
|---|---|---|---|---|---|---|---|
| C61 | H61 | 310.0 | 1.0800 | N51 | HP1 | 408.0 | 1.0100 |
| NG1 | HP1 | 418.0 | 0.9970 | C21 | N31 | 263.0 | 1.4450 |
| CO1 | NG1 | 350.0 | 1.3450 | C51 | C51 | 390.0 | 1.3600 |
| CO1 | OD1 | 385.0 | 1.2300 | C61 | HG2 | 310.0 | 1.0800 |
| C31 | HG3 | 312.0 | 1.1110 | C21 | HG2 | 284.0 | 1.1110 |
Bold force constants were altered during the fit to the experimental IR spectrum.
Bold equilibrium values were altered during the conformational analysis.
Force Constant Refinements
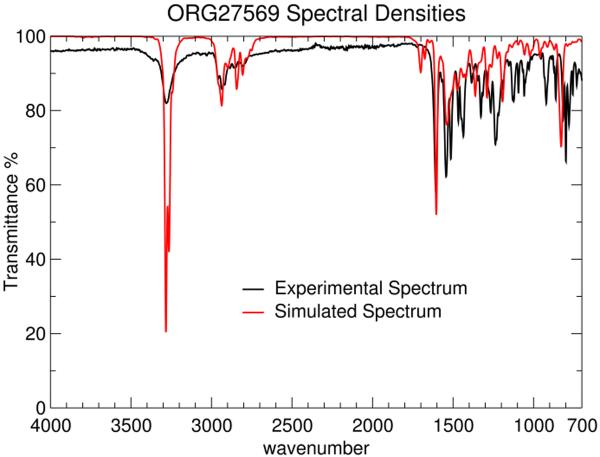
Figure 9 shows the experimental solid state IR spectrum for ORG27569 in black. The ORG27569 IR spectrum calculated from an in vacuo molecular dynamics simulation of Org27569 is shown in red in Figure 9 as well. To achieve agreement between these two spectra, several bond and angle bending force constants (Kb and Kθ) were adjusted. Given the difficulty with the use of a fixed charge model for representing the infrared intensities16, the resulting MM spectrum matches the experimental IR with good agreement. These alterations are given in Tables 4 and 5.
Figure 9.
A comparison of the MM (red) and experimental (black) infrared spectra for Org27569 is presented here. The calculated IR spectrum (using the CHARMM parameters developed here) shows good correlation with the experimental IR spectrum.
Table 5.
Bond Angle Parameters Developed for Org27569
| Type | Type | Type | Kθa | θ 0 b | Type | Type | Type | Kθa | θ 0 b |
|---|---|---|---|---|---|---|---|---|---|
| C61 | C61 | C21 | 45.8 | 125.0 | C21 | NG1 | HP1 | 45.0 | 117.0 |
| CO1 | NG1 | C21 | 50.0 | 115.0 | NG1 | CO1 | OD1 | 99.0 | 122.5 |
| C61 | C21 | C21 | 51.8 | 113.5 | HG2 | C21 | HG2 | 38.0 | 109.0 |
| C51 | CO1 | OD1 | 72.0 | 115.5 | CO1 | NG1 | HP1 | 44.0 | 123.0 |
| N51 | C51 | CO1 | 45.0 | 124.2 | C51 | C51 | CO1 | 45.0 | 147.0 |
Bold force constants were altered during the fit to the experimental IR spectrum.
Bold equilibrium values were altered during the conformational analysis.
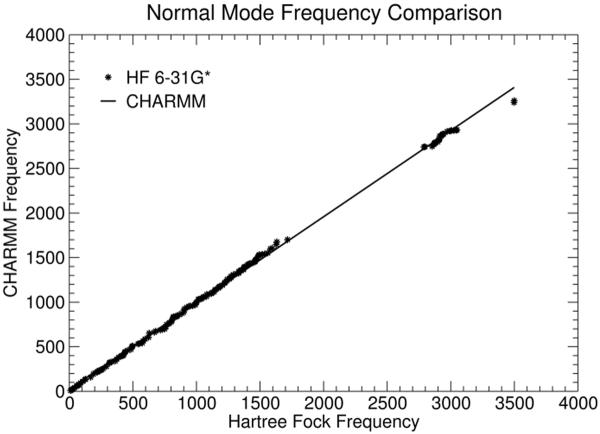
In order to test the validity of the developed parameters, we compared the normal mode frequencies obtained from a Hartree Fock 6–31G* calculation (using Jaguar) with those obtained using the presently determined CHARMM parameters. This analysis was performed using the lowest energy conformer of Org27569. The comparison between these two analyses is shown in Figure 10. The linearity of the graph shows the direct correspondence between the number and frequency of the normal modes found by the QM and MM experiments. The only significant difference between the quantum mechanical and CHARMM frequencies are the 2 N-H stretches near 3500cm−1. This results from the shifting of the NH force constants in the CHARMM force field to match the experimental spectrum, while the Hartree Fock N-H frequencies are approximately 200cm−1 too high relative to experiment. This most likely results from the negelect of anharmonic effects in the quantum mechanical normal mode analysis (NMA) and/or the shift in frequencies experienced upon going from the gas to solid state. Otherwise, overall the agreement between the quantum mechanical frequencies and CHARMM frequencies is quite good, with a correlation coefficient of 0.968.
Figure 10.
A comparison of the QM (black dots) and MM (black line) normal mode analyses is presented here. The linearity of the line (m = 0.968; correlation coefficient = 0.999) shows that there is good correlation between the frequency of the normal modes calculated by the QM and MM methods. The only significant difference between the quantum mechanical and CHARMM frequencies are the 2 N-H stretches near 3500cm−1. This results from the shifting of the NH force constants in the CHARMM force field to match the experimental spectrum, while the Hartree Fock N-H frequencies are approximately 200cm−1 too high relative to experiment
Conclusions
The development of parameters for Org27569 using the previously published methods for parameter development for the CHARMM force field was successful and yielded a full set of parameters. Use of the recently published CGenFF library was appropriate and applicable because of the inclusion of many organic compounds in the database. The use of three model compounds (one of which involving two varied bonds) allowed for the accurate calculation of the missing dihedral parameters. Performing a conformational search of Org27569 and then calculating the minima using CHARMM, helped refine the less accurately predicted parameters by manual correction. This, together with force constant adjustments based upon the experimental ORG27569 IR spectrum, resulted in a full set of non-bonded and internal bonding parameters. Testing these parameters using a QM and MM normal mode analysis comparison along with the good correspondence between the experimental and calculated IR spectrum of ORG27569 gives evidence that the final parameters result in a molecular mechanical reproduction of the structure and dynamics of Org27569. These parameters will be used in future MD studies of the allosteric effects of ORG27569 when in complex with the CB1 receptor.
Supplementary Material
Acknowledgements
This work was supported by NIH/NIDA grants RO1 DA003934 and KO5 DA021358 to PHR.
References
- 1.Pertwee RG, Ross RA. Prostaglandins Leukot Essent Fatty Acids. 2002;66(2–3):101–121. doi: 10.1054/plef.2001.0341. [DOI] [PubMed] [Google Scholar]
- 2.Reggio PH. Curr Pharm Des. 2003;9(20):1607–1633. doi: 10.2174/1381612033454577. [DOI] [PubMed] [Google Scholar]
- 3.Christopoulos A, Kenakin T. Pharmacol Rev. 2002;54(2):323–374. doi: 10.1124/pr.54.2.323. [DOI] [PubMed] [Google Scholar]
- 4.Price MR, Baillie GL, Thomas A, Stevenson LA, Easson M, Goodwin R, McLean A, McIntosh L, Goodwin G, Walker G, Westwood P, Marrs J, Thomson F, Cowley P, Christopoulos A, Pertwee RG, Ross RA. Mol Pharmacol. 2005;68(5):1484–1495. doi: 10.1124/mol.105.016162. [DOI] [PubMed] [Google Scholar]
- 5.Ross RA. Trends Pharmacol Sci. 2007;28(11):567–572. doi: 10.1016/j.tips.2007.10.006. [DOI] [PubMed] [Google Scholar]
- 6.Horswill JG, Bali U, Shaaban S, Keily JF, Jeevaratnam P, Babbs AJ, Reynet C, Wong Kai In P. Br J Pharmacol. 2007 doi: 10.1038/sj.bjp.0707347. [DOI] [PMC free article] [PubMed] [Google Scholar]
- 7.MacKerell AD, Jr., Bashford D, Bellot M, Dunbrack RL, Jr., Evanseck JD, Field MJ, Fischer S, Gao J, Guo H, Ha S, Joseph-McCarthy D, Kuchnir L, Kuczera K, Lau FTK, Mattos C, Michnick S, Ngo T, Nguyen DT, Prodhom B, Reiher WE, III, Roux B, Schlenkrich M, Smith JC, Stote R, Straub J, Watanabe M, Wiorkiewicz-Kuczera J, Yin D, Karplus M. J Phys Chem B. 1998;102:3586–3616. doi: 10.1021/jp973084f. [DOI] [PubMed] [Google Scholar]
- 8.MacKerell AD., Jr. In: Computational Biochemistry and Biophysics. Becker OM, MacKerell AD Jr., Roux B, Watanabe M, editors. Marcel Dekker; New York: 2001. pp. 7–38. [Google Scholar]
- 9.Vanommeslaeghe K, Hatcher E, Acharya C, Kundu S, Zhong S, Shim J, Darian E, Guvench O, Lopes P, Vorobyov I, Mackerell AD., Jr. J Comput Chem. 2009;31(4):671–690. doi: 10.1002/jcc.21367. [DOI] [PMC free article] [PubMed] [Google Scholar]
- 10.Valiev M, Bylaska EJ, Govind N, Kowalski K, Straatsma TP, van Dam HJJ, Wang D, Nieplocha J, Apra E, Windus TL, de Jong WA. Comput Phys Commun. 2010;181:1477. [Google Scholar]
- 11.Schrodinger I. Portland, OR, USA: 97201. [Google Scholar]
- 12.MacKerell ADJ, Karplus MJ. J Phys Chem B. 1991;95(26):10559–10560. [Google Scholar]
- 13.Bren U, Hodoscek M, Koller J. J Chem Inf Model. 2005;45(6):1546–1552. doi: 10.1021/ci050151r. [DOI] [PubMed] [Google Scholar]
- 14.Guvench O, MacKerell AD., Jr. Journal of molecular modeling. 2008;14(8):667–679. doi: 10.1007/s00894-008-0305-0. [DOI] [PMC free article] [PubMed] [Google Scholar]
- 15.Baer M, Mathias G, Kuo I-FW, Tobias DJ, J. MC, Marx D. ChemPhysChem. 2008;9:2703–2707. doi: 10.1002/cphc.200800473. [DOI] [PubMed] [Google Scholar]
- 16.Mantoo PK, Keyes T. J Chem Phys. 2006;124:204503. doi: 10.1063/1.2200692. [DOI] [PubMed] [Google Scholar]
- 17.Bren U, Hodoscek M, Koller J. J Chem Inf Model. 2005;45:1546–1552. doi: 10.1021/ci050151r. [DOI] [PubMed] [Google Scholar]
Associated Data
This section collects any data citations, data availability statements, or supplementary materials included in this article.


