

Abstract
Objectives
Model age of necrotizing enterocolitis (NEC) onset applying Sartwell’s model of incubation periods, and examine its relationship to gestational age (GA).
Study design
Retrospective chart review of St. Louis Children’s Hospital neonates diagnosed with NEC (≥ Bell’s stage II) from 2004 to 2008, inclusive.
Results
The relationship between age of NEC (N=84 cases) onset and GA best fits a non-linear model, with infants ≤ 28 weeks having a disproportionately longer time to onset than older GA groups and explained 50.3% of the variability in age of NEC onset. Additional clinical variables provided no improvement in explaining age of NEC onset. Application of Sartwell’s model to age of NEC onset proved a good fit, when birth is used as the common exposure episode, and age is the equivalent of the incubation period.
Conclusion
The relationship between day of NEC diagnosis and GA is non-linear, with lower GA infants having disproportionately longer time to onset. Despite these GA differences, the fit to Sartwell’s model for incubation periods model is consistent with NEC being a consequence of an event that occurs at or soon after birth.
Keywords: premature morbidity, intestinal injury, newborn
Introduction
Necrotizing enterocolitis (NEC) is a serious necro-inflammatory injury of the distal small bowel and proximal colon that predominantly affects premature infants. The highest frequency of NEC is in very low birth weight (VLBW) infants, i.e., those born weighing less than or equal to 1500 grams, ranging from 5 to 12% in most studies (1–3). Overall NEC mortality remains at 15%, and approaches 30% (1, 4) for VLBW (5, 6) infants.
Many environmental and host factors have been implicated in the pathogenesis of NEC. However, the processes leading to NEC remains unknown. It remains unclear whether NEC results for a singular inciting “event”, or from sequential post-natal exposures. In the 1950s, Sartwell reported that incubation periods for infections, in which victims had single known exposures, followed log normal distributions, while those caused by sequential exposures did not (7, 8). This model has since been applied to a variety of infectious diseases, as well as to complex and genetic disorders (9–16). Diseases with well defined exposures or clearly defined genetic etiologies fit log normal distributions in terms of time to onset (following exposure or birth), while those with ill defined etiologies or caused by sequential environmental influences do not (9–12). In this study, we asked if the age of diagnosis for NEC fits a model consistent with a common time window of exposure, or one more strongly influenced by varied postnatal environmental factors.
Methods
Washington University Human Resources Protection Office approved this retrospective study. We analyzed the charts of all infants diagnosed with NEC (International Classification of Diseases, 9th Revision, Clinical Modification code 777.5) at St. Louis Children’s Hospital, who were discharged between January 2004 and January 2008. The day of NEC diagnosis was defined as the first day of clinical findings consistent with Bell’s staging, confirmed by radiologic evidence of NEC. Only patients who fulfilled the Modified Bell’s Stage II (17) clinical and radiological findings (pneumatosis intestinalis, portal vein gas) or III (stage II plus presence of pneumoperitoneum) were included. We excluded patients with Bell’s stage I, as well as patients with spontaneous intestinal perforation (SIP) using guidelines from Gordon (18), patients transferred to St. Louis Children’s Hospital with a pre-existing diagnosis of NEC for whom radiographs and clinical data were unavailable, and patients with severe congenital or chromosomal abnormalities. We extracted gestational age at birth, gender, race, birth weight, parity, route of delivery, Apgar scores, Bell’s Staging, surgical intervention for NEC (laparotomy and abdominal drainage), and hospitalization outcome (died from any cause, or discharged alive) from the medical record.
We tested the distribution for age of NEC diagnosis for normality, and strongly rejected this distribution pattern (Shapiro-Wilk test p< 0.0001). Therefore, we used the nonparametric Kruskal-Wallis and Mann-Whitney tests to test differences between median day of onset among gestational age groups. Scatter plots and measures of correlation (Pearson’s correlation for linear correlation) were used to portray the relationship between gestational age and day of NEC diagnosis. Day of NEC onset was log transformed and did not strongly reject normality testing (p>0.02). Sartwell’s model was applied to NEC using the log transformed time interval from birth to day of NEC onset as the “incubation period”. The frequencies for the age of NEC diagnosis were grouped in time intervals (days) and the cumulative frequencies and corresponding percentages determined. Data were plotted as cumulative percentages against log time (7). The “estimated median” is the point of 50% cumulative frequency when plotting log time against cumulative frequency. The “dispersion factor” is a coefficient which, when multiplied or divided by the estimated median incubation period, provides the endpoints of an incubation interval containing an estimated 68% of the observations (7). It provides an estimate of dispersion independent of the length of incubation, allowing comparison between diseases, or in this study, gestational age groups. All analyses were performed using SPSS version 17.0 (SPSS Inc., Chicago, Illinois).
Results
During the four-year study period, 180 infants at our institution had an ICD-9 diagnosis of NEC (code 777.5), corresponding to 5.1% of NICU admissions in this interval. Ninety-six were excluded from our study because they had a major congenital anomaly (N=32), lack of confirmatory radiographic/clinical data prior to transfer (N=42), or Bell’s Stage I or SIP (N=22), leaving 84 infants for analysis (Figure 1). Characteristics of groups by gestational age are provided in Table 1. Among these 84 infants with NEC, no gender imbalance was seen, and frequencies of multiple gestation and delivery route reflected those of our NICU population. African – American infants with NEC were over-represented in all gestational age categories except infants 25 to 26 weeks gestation compared to our NICU population (45% African - American) in all gestational age groups (Table 1).
Figure 1. Distribution of patients included and excluded from analysis for this study.
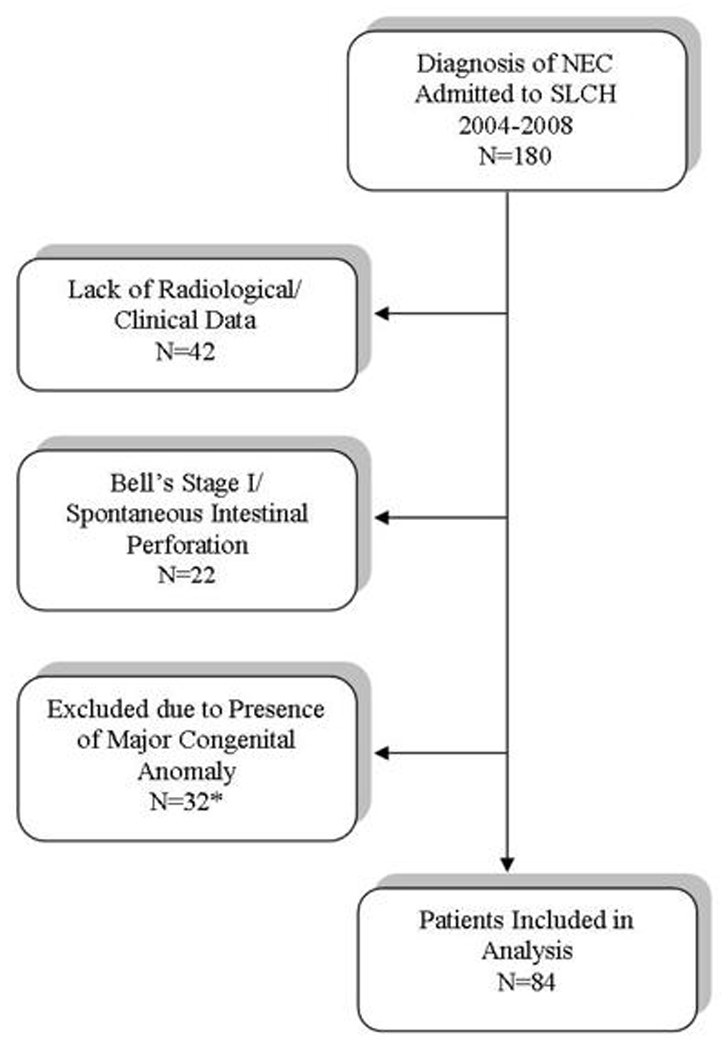
*Gastrointestinal malformations: gastroschisis (N=11), microcolon (N=1), Hirshsprung’s Disease (N=1) intestinal atresia with perforation (N=2); cardiac anomalies: dextrocardia (N=1), hypoplastic right or left ventricle (N=5), transposition of great vessels (N=4), truncus arteriosus (N=1), tetralogy of Fallot (N=1), aortic coarctation (N=2), total anomalous venous return (N=1); renal anomalies: renal agenesis (N=1); chromosomal anomalies: Down syndrome (N=1).
Table 1.
Demographic Varibales by Gestational Age
| Gestational Age (weeks) | ||||||
|---|---|---|---|---|---|---|
| <25 | 25–26 | 27–28 | 29–30 | 31–32 | 33–40 | |
| N | 8 | 17 | 10 | 10 | 14 | 25 |
| Race | ||||||
| % White | 37.5 | 64.7 | 30 | 40 | 42.9 | 36 |
| % African -American | 62.5 | 29.4 | 50 | 60 | 50 | 64 |
| %other | 0 | 5.9 | 20 | 0 | 7.1 | 0 |
| Gender (% male) | 37.5 | 47.1 | 50 | 40 | 64.3 | 56 |
| Delivery (% cesarean) | 62.5 | 58.8 | 50 | 60 | 42.9 | 44 |
| Multiple Gestation (%) | 0 | 47.1 | 20 | 10 | 28.6 | 4 |
| Median Apgar Score (5 min) | 7 | 6 | 8 | 8 | 9 | 9 |
| Bell's Staging (% Stage III) | 50 | 35.3 | 20 | 21.4 | 21.4 | 16 |
| Surgery (%) | 75 | 52.9 | 70 | 60 | 35.1 | 28 |
| Surgical Mortality (%) | 50 | 41.1 | 40 | 100 | NA | NA |
| Total Mortality (%) | 62.5 | 52.9 | 40 | 20 | 0 | 0 |
Across the entire study population, there was a substantial negative linear correlation between age of NEC onset and gestational age at birth (r=−0.647, Figure 2). In the linear model gestational age accounts for 41.8% of the variability in age of NEC onset (r2=0.418). Fit was diminished when birth weight rather than gestational age was used (r=−0.539, p <0.001, data not shown), accounting for 29.1% of the variability in age of NEC onset. Fit improved using a nonlinear model of 1/(gestational age), increasing the proportion of variance explained to 46.4%. When both 1/(gestational age) and gestational age are included in the model the proportion of variance explained rose to 50.3% providing a significant improvement in fit (p=0.0134). The addition of birth weight, gender, race, multiple gestations and delivery route and 5 minute Apgar score did not substantively add to the explanation of age of NEC onset variance. The improvement using the factor 1/ (gestational age) reflects the disproportionately greater delay in onset in infants with earlier gestational ages. This non-linear relationship between gestational age and age of NEC onset is evident in Figure 3. The median day of diagnosis was significantly later for the group consisting of infants with <29 weeks of gestation at birth (14 – 27.5 days), compared to older infants (6 – 8 days), (Figure 3 for significance testing). Additionally, the interval change in the days to diagnosis of NEC between gestational age categories did not change linearly with gestational age. For each 2 week increase in GA, the interval decrease from the previous gestational age category for age of diagnosis varied between 9 days at the lowest GA group to 0 days at the highest GA group (Figure 3).
Figure 2. Inverse relationships between gestational ages and ages of diagnosis of NEC.
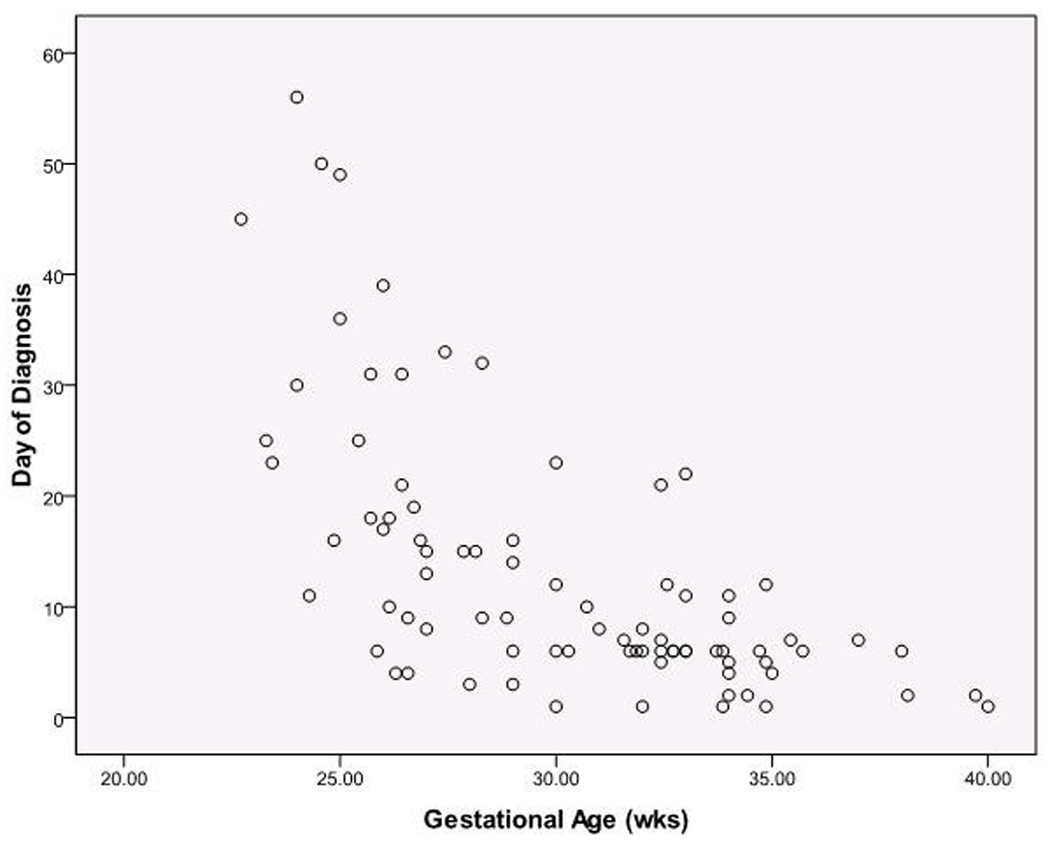
Scatter plot for all subjects. N= 84. The regression model including GA and 1/(GA) explains 50.3% of variation in day of diagnosis and significantly improved fit (p=0.0134).
Figure 3. Median age of diagnosis of NEC according to gestational age group.
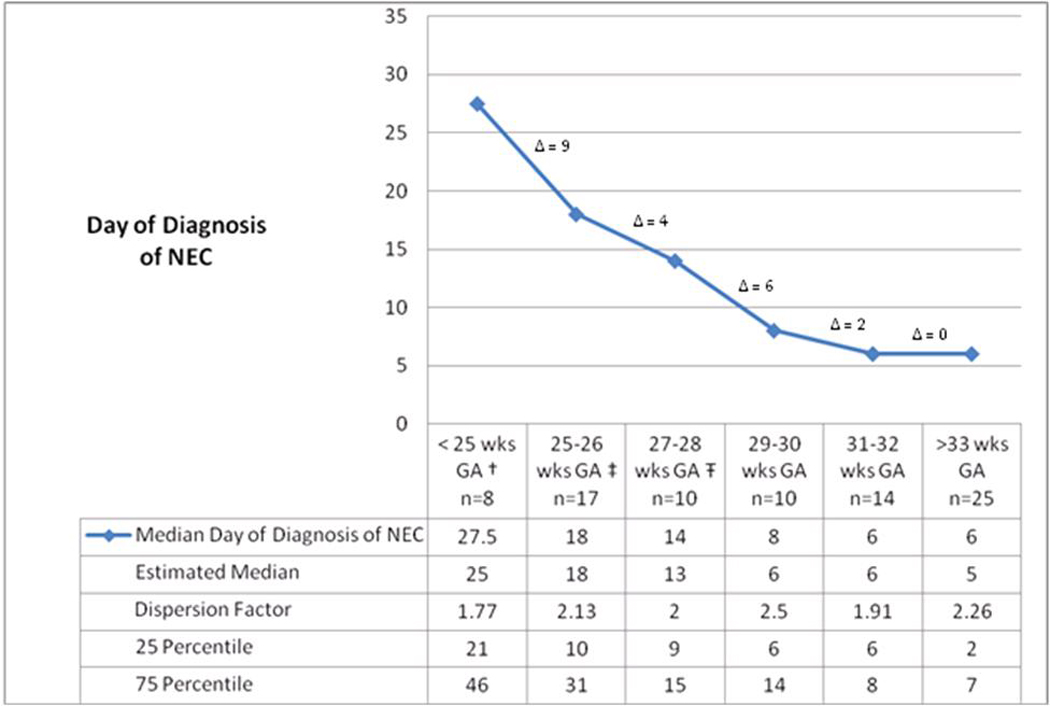
† Median day of diagnosis of NEC for group < 25 weeks GA is significantly different from each group ≥ 27 weeks GA (p < 0.05 for all)
‡ Median day of diagnosis of NEC for 25–26 weeks GA is significantly different from each group ≥ 29 weeks GA, (p < 0.05 for all)
Ŧ Median day of diagnosis of NEC for 27–28 weeks GA group significantly different from < 25 weeks GA and each group ≥ 31 weeks GA (p < 0.05 for all)
Δ= difference in median age of diagnosis of NEC between gestational age groups.
Because testing of the distribution for age of NEC diagnosis rejected the hypothesis of a normal distribution, times were log transformed. The resulting data better fit a log normal distribution, and Sartwell’s model was applied to NEC using age of NEC diagnosis as the candidate “incubation period.” A plot of the cumulative distributions for log normal days to NEC onset (Figure 4) illustrates the overall good fit of Sartwell’s model, comparable to the fit of examples in his seminal paper (7). This visual assessment is supported by formal statistical goodness-of-fit tests (e.g. Shapiro-Wilk test p > 0.05). Further, Sartwell’s “estimated medians” closely matched the actual sample gestational category medians. The dispersion factor, a measure of variation independent of the magnitude of the incubation time (see Methods), was 2.62 for the entire cohort (Table 1), indicating that the range of days of diagnosis of NEC encompassing 68% of cases on either side of the estimated median is from 3.0 to 20.8 days. For infants ≤ 28 weeks this range expanded to 9 to 37 days. Although the model fit the data well, Figure 4 demonstrates non-random deviation from the model prediction. Specifically, the cumulative percentages for earlier onset (lower log normal days of diagnosis) were consistently less than predicted for the entire cohort as well as within gestational age categories (data not shown).
Figure 4. Application of Sartwell’s log normal model: Cumulative distribution for log normal distribution of age of NEC diagnosis10.
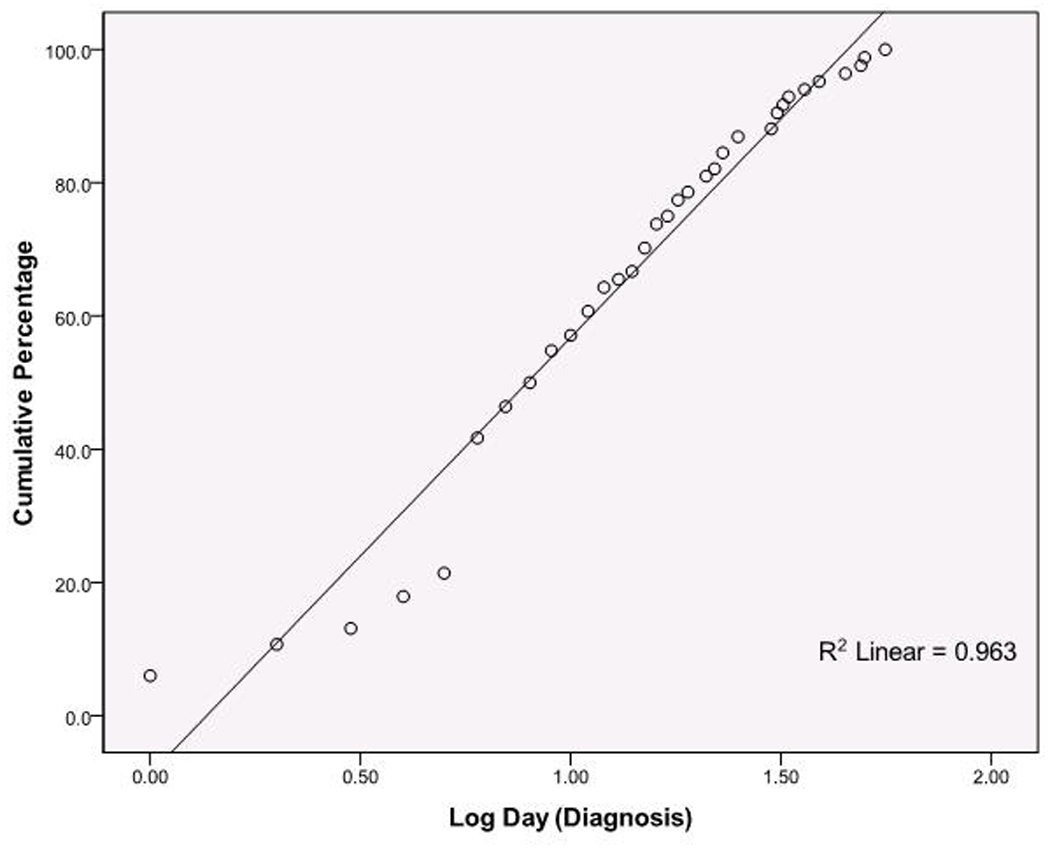
The y axis represents cumulative percentages of cases; the x axis represents the time scale, expressed as log10 values. Each point represents all the NEC cases presenting at the given time point. These are plotted by the cumulative percentage they represent (y axis). N=84, Shapiro-Wilk test p > 0.05 indicating significant fit to predicted log normal distribution.
Overall, 51.2% of the patients included in the analysis underwent NEC-related surgical intervention. Mortality across all gestational ages was 23.8%, ranging from zero in infants >30 weeks GA to >60% in infants <25 weeks GA (Table 1). Mortality in infants undergoing surgical intervention across gestational ages was ≥40%.
Discussion
This is the first study to apply Sartwell’s modeling for incubation periods to NEC. We demonstrate that the age of NEC onset fits Sartwell’s log normal model of incubation periods. Incubation periods fitting Sartwell’s model imply a single identifiable factor or point exposure that initiates a chain of events leading to illness (7, 19). For NEC, the incubation period is age of NEC onset, with birth as the point of exposure.
Such a good fit suggests that an event at or soon after birth could be necessary, though perhaps not sufficient, for the development of this devastating disorder. Birth as an important event in NEC development is not a new concept, given its absence in utero, but the log normal occurrence of age of NEC diagnosis does suggest that the day of diagnosis of NEC is less affected by exposure to environmental factors within the NICU than the process of parturition and introduction to extra-uterine life. These distributions, while not negating the roles of other precipitating co-factors, do compel us to scrutinize biologic processes that begin in the immediate neonatal period as the controlling driver of NEC.
What could be such an early postnatal precipitant of NEC? Recent hypotheses implicate bacterial colonization (18, 20–22) in the development of NEC. The fetal intestine is sterile in utero (23, 24) with colonization beginning only after birth. If bacterial colonization at or soon after following birth is analogous to exposure to infectious agents that cause various illnesses in Sartwell’s model, then a log normal model regardless of gestational age would result, as we demonstrate. However, we also must account for what appears to be non-random deviation from the model prediction. Whether lower than predicted rates of occurrence in early days of life are related to temporary protection from initial antibiotic exposures, or other yet-to-be discerned variables, is not now clear. It is plausible that varying degrees of intestinal tract development, related to in utero development, could account for some of the differences for time to NEC development between gestational age categories. This again highlights the likely interaction between events that begin in parturition, and that continue post-natally.
This also is the first study of NEC to model the effect of gestation on age of onset. While an inverse relationship between gestational age and day of NEC diagnosis has been previously reported (25–28), ours is the first description and quantification of its non-linear nature. (Figures 2 and 3). By including the disproportionately longer age to onset for infants at very early gestational ages (1/gestational age) we were able to account for 50% of the variability in age of NEC onset. This degree of contribution from a single factor is somewhat unusual within complicated biologic systems, particularly the complex preterm infant. Gestational age has typically accounted for 30% or less of variation evident in other common preterm morbidities, including neurodevelopmental outcomes (29, 30). The importance of gestation age to timing of onset again points to an interaction between events related to birth, and stage of intestinal development.
The NEC rate reported in this study (5.1%) resembles recent studies (2, 3, 31). Also, the mortality rates of 23.8% for all children with NEC, and ≥ 40% for patients ≤28 weeks of gestational age, are similar to previous series (6, 27, 32–34), and confirm the described inverse relationship between NEC mortality and gestational age (3, 31, 35). These high mortality rates highlight the lack of progress made over this time interval in treating this devastating disease.
We wish to note several limitations of this study. First, we used day of NEC diagnosis as the end of the incubation period, but it is possible that the radiographic manifestations required for inclusion in the study represent a pathologic process that began earlier, so our estimates of age of onset are therefore inaccurate. However, in the absence of an identifiable herald sign of NEC that more precisely represents its onset, we and others are necessarily obligated to use the date of the radiographic abnormality as the most defensible and definable point of NEC onset. Second its retrospective nature limits our ability to account for potential variables that could have impacted age of onset, beyond gestational age.
In conclusion, Sartwell’s model, when applied to NEC, demonstrates log normality across all gestational age groups. The adherence of age of NEC onset to this model of incubation periods further supports a theory of NEC causation that is strongly influenced by a point exposure, in this case birth. The incubation period appears to start at or soon after birth, quite likely from a point source acquisition of sensitizing microbes. Gestational age differences in response to birth are evident as indicated by the continued correlation between GA and age of diagnosis of NEC. But birth, regardless of gestational age, and not subsequently occurring events, appear to be most critical event in terms of starting the clock that leads to NEC.
Acknowledgements
Ms. González-Rivera was supported by the Doris Duke Clinical Research Foundation. Dr Warner received support from the Children’s Discovery Institute MD II-2009-201. Drs. Tarr and Warner were partially supported by UH2 AI083265 and DDRCC grant 5P30 DK052574 to Washington University Digestive Diseases Research Core Center. Drs. Warner and Hamvas received support from the Washington University Institute for Clinical and Translational Studies (UL1 RR024992). Its contents are solely the responsibility of the authors and do not necessarily represent the official view of NCRR or NIH. Dr. Culverhouse is partially supported by the National Institute of General Medical Sciences (K25 GM69590).
We wish to thank the late Dr. David Alling for his insight and wisdom regarding incubation period distributions, and Beth Wolf, Gina Meyers, Amy Distler, and Christine Musser for assistance with manuscript preparation.
Abbreviations
- NICU
neonatal intensive care unit
- NEC
necrotizing enterocolitis
- GA
gestational age
- VLBW
very low birth weight
- SLCH
St. Louis Children’s Hospital
- SIP
spontaneous intestinal perforation
Footnotes
Financial Disclosure: No financial relationships relevant to this article to disclose
Conflict of Interest
The authors declare no conflict of interest.
References
- 1.Holman RC, Stoll BJ, Curns AT, Yorita KL, Steiner CA, Schonberger LB. Necrotising enterocolitis hospitalisations among neonates in the United States. Paediatr Perinat Epidemiol. 2006 Nov;20(6):498–506. doi: 10.1111/j.1365-3016.2006.00756.x. [DOI] [PubMed] [Google Scholar]
- 2.Horbar JD, Badger GJ, Carpenter JH, Fanaroff AA, Kilpatrick S, LaCorte M, et al. Trends in mortality and morbidity for very low birth weight infants, 1991–1999. Pediatrics. 2002 Jul;110(1 Pt 1):143–151. doi: 10.1542/peds.110.1.143. [DOI] [PubMed] [Google Scholar]
- 3.Sankaran K, Puckett B, Lee DS, Seshia M, Boulton J, Qiu Z, et al. Variations in incidence of necrotizing enterocolitis in Canadian neonatal intensive care units. J Pediatr Gastroenterol Nutr. 2004 Oct;39(4):366–372. doi: 10.1097/00005176-200410000-00012. [DOI] [PubMed] [Google Scholar]
- 4.Lin PW, Stoll BJ. Necrotising enterocolitis. Lancet. 2006 Oct 7;368(9543):1271–1283. [Google Scholar]
- 5.Luig M, Lui K. Epidemiology of necrotizing enterocolitis--Part II: Risks and susceptibility of premature infants during the surfactant era: a regional study. J Paediatr Child Health. 2005 Apr;41(4):174–179. doi: 10.1111/j.1440-1754.2005.00583.x. [DOI] [PubMed] [Google Scholar]
- 6.Blakely ML, Lally KP, McDonald S, Brown RL, Barnhart DC, Ricketts RR, et al. Postoperative outcomes of extremely low birth-weight infants with necrotizing enterocolitis or isolated intestinal perforation: a prospective cohort study by the NICHD Neonatal Research Network. Ann Surg. 2005 Jun;241(6):984–989. doi: 10.1097/01.sla.0000164181.67862.7f. discussion 9–94. [DOI] [PMC free article] [PubMed] [Google Scholar]
- 7.Sartwell PE. The distribution of incubation periods of infectious disease. Am J Hyg. 1950 May;51(3):310–318. doi: 10.1093/oxfordjournals.aje.a119397. [DOI] [PubMed] [Google Scholar]
- 8.Sartwell PE. The incubation period of poliomyelitis. Am J Public Health Nations Health. 1952 Nov;42(11):1403–1408. doi: 10.2105/ajph.42.11.1403. [DOI] [PMC free article] [PubMed] [Google Scholar]
- 9.Armenian HK, Lilienfeld AM. The distribution of incubation periods of neoplastic diseases. Am J Epidemiol. 1974 Feb;99(2):92–100. doi: 10.1093/oxfordjournals.aje.a121599. [DOI] [PubMed] [Google Scholar]
- 10.Armenian HK, Khoury MJ. Age at onset of genetic diseases: an application for Sartwell's model of the distribution of incubation periods. Am J Epidemiol. 1981 May;113(5):596–605. doi: 10.1093/oxfordjournals.aje.a113137. [DOI] [PubMed] [Google Scholar]
- 11.Armenian HK, Lilienfeld AM. Incubation period of disease. Epidemiol Rev. 1983;5:1–15. doi: 10.1093/oxfordjournals.epirev.a036254. [DOI] [PubMed] [Google Scholar]
- 12.Armenian HK. Incubation periods of cancer: old and new. J Chronic Dis. 1987;40(Suppl 2):9S–15S. doi: 10.1016/s0021-9681(87)80004-8. [DOI] [PubMed] [Google Scholar]
- 13.Philippe P. Competing stochastic models of the incubation period: an investigation of age-at-diagnosis of familial and sporadic retinoblastoma. Am J Med Genet. 1993 Apr 15;46(2):113–122. doi: 10.1002/ajmg.1320460202. [DOI] [PubMed] [Google Scholar]
- 14.Alcabes P, Munoz A, Vlahov D, Friedland GH. Incubation period of human immunodeficiency virus. Epidemiol Rev. 1993;15(2):303–318. doi: 10.1093/oxfordjournals.epirev.a036122. [DOI] [PubMed] [Google Scholar]
- 15.Wilkening DA. Modeling the incubation period of inhalational anthrax. Med Decis Making. 2008 Jul-Aug;28(4):593–605. doi: 10.1177/0272989X08315245. [DOI] [PubMed] [Google Scholar]
- 16.Sartwell PE. The distribution of incubation periods of infectious disease. 1949. Am J Epidemiol. 1995 Mar 1;141(5):386–394. doi: 10.1093/oxfordjournals.aje.a117440. discussion 5. [DOI] [PubMed] [Google Scholar]
- 17.Walsh MC, Kliegman RM. Necrotizing enterocolitis: treatment based on staging criteria. Pediatr Clin North Am. 1986 Feb;33(1):179–201. doi: 10.1016/S0031-3955(16)34975-6. [DOI] [PMC free article] [PubMed] [Google Scholar]
- 18.Gordon PV, Swanson JR, Attridge JT, Clark R. Emerging trends in acquired neonatal intestinal disease: is it time to abandon Bell's criteria? J Perinatol. 2007 Nov;27(11):661–671. doi: 10.1038/sj.jp.7211782. [DOI] [PubMed] [Google Scholar]
- 19.Sartwell PE. The incubation period and the dynamics of infectious disease. Am J Epidemiol. 1966 Mar;83(2):204–206. doi: 10.1093/oxfordjournals.aje.a120576. [DOI] [PubMed] [Google Scholar]
- 20.Claud EC, Walker WA. Bacterial colonization, probiotics, and necrotizing enterocolitis. J Clin Gastroenterol. 2008 Jul;42(Suppl 2):S46–S52. doi: 10.1097/MCG.0b013e31815a57a8. [DOI] [PubMed] [Google Scholar]
- 21.Claud EC, Walker WA. Hypothesis: inappropriate colonization of the premature intestine can cause neonatal necrotizing enterocolitis. FASEB J. 2001 Jun;15(8):1398–1403. doi: 10.1096/fj.00-0833hyp. [DOI] [PubMed] [Google Scholar]
- 22.Lin PW, Nasr TR, Stoll BJ. Necrotizing enterocolitis: recent scientific advances in pathophysiology and prevention. Semin Perinatol. 2008 Apr;32(2):70–82. doi: 10.1053/j.semperi.2008.01.004. [DOI] [PubMed] [Google Scholar]
- 23.Mackie RI, Sghir A, Gaskins HR. Developmental microbial ecology of the neonatal gastrointestinal tract. Am J Clin Nutr. 1999 May;69(5):1035S–1045S. doi: 10.1093/ajcn/69.5.1035s. [DOI] [PubMed] [Google Scholar]
- 24.Fanaro S, Chierici R, Guerrini P, Vigi V. Intestinal microflora in early infancy: composition and development. Acta Paediatr Suppl. 2003 Sep;91(441):48–55. doi: 10.1111/j.1651-2227.2003.tb00646.x. [DOI] [PubMed] [Google Scholar]
- 25.Ostlie DJ, Spilde TL, St Peter SD, Sexton N, Miller KA, Sharp RJ, et al. Necrotizing enterocolitis in full-term infants. J Pediatr Surg. 2003 Jul;38(7):1039–1042. doi: 10.1016/s0022-3468(03)00187-8. [DOI] [PubMed] [Google Scholar]
- 26.Beeby PJ, Jeffery H. Risk factors for necrotising enterocolitis: the influence of gestational age. Arch Dis Child. 1992 Apr;67(4 Spec No):432–435. doi: 10.1136/adc.67.4_spec_no.432. [DOI] [PMC free article] [PubMed] [Google Scholar]
- 27.Sharma R, Hudak ML, Tepas JJ, 3rd, Wludyka PS, Marvin WJ, Bradshaw JA, et al. Impact of gestational age on the clinical presentation and surgical outcome of necrotizing enterocolitis. J Perinatol. 2006 Jun;26(6):342–347. doi: 10.1038/sj.jp.7211510. [DOI] [PubMed] [Google Scholar]
- 28.Yaseen H, Kamaledin K, Al Umran K, Al Arfaj A, Darwich M, Awary B. Epidemiology and outcome of "early-onset" vs "late-onset" necrotizing enterocolitis. Indian J Pediatr. 2002 Jun;69(6):481–484. doi: 10.1007/BF02722648. [DOI] [PubMed] [Google Scholar]
- 29.Scheiner AP, Sexton ME. Prediction of developmental outcome using a perinatal risk inventory. Pediatrics. 1991 Dec;88(6):1135–1143. [PubMed] [Google Scholar]
- 30.Zaramella P, Freato F, Milan A, Grisafi D, Vianello A, Chiandetti L. Comparison between the perinatal risk inventory and the nursery neurobiological risk score for predicting development in high-risk newborn infants. Early human development. 2008 May;84(5):311–317. doi: 10.1016/j.earlhumdev.2007.08.003. [DOI] [PubMed] [Google Scholar]
- 31.Guillet R, Stoll BJ, Cotten CM, Gantz M, McDonald S, Poole WK, et al. Association of H2-blocker therapy and higher incidence of necrotizing enterocolitis in very low birth weight infants. Pediatrics. 2006 Feb;117(2):e137–e142. doi: 10.1542/peds.2005-1543. [DOI] [PubMed] [Google Scholar]
- 32.Guthrie SO, Gordon PV, Thomas V, Thorp JA, Peabody J, Clark RH. Necrotizing enterocolitis among neonates in the United States. J Perinatol. 2003 Jun;23(4):278–285. doi: 10.1038/sj.jp.7210892. [DOI] [PubMed] [Google Scholar]
- 33.Moss RL, Dimmitt RA, Barnhart DC, Sylvester KG, Brown RL, Powell DM, et al. Laparotomy versus peritoneal drainage for necrotizing enterocolitis and perforation. N Engl J Med. 2006 May 25;354(21):2225–2234. doi: 10.1056/NEJMoa054605. [DOI] [PubMed] [Google Scholar]
- 34.Stoll BJ. Epidemiology of necrotizing enterocolitis. Clin Perinatol. 1994 Jun;21(2):205–218. doi: 10.1016/S0095-5108(18)30341-5. [DOI] [PMC free article] [PubMed] [Google Scholar]
- 35.Llanos AR, Moss ME, Pinzon MC, Dye T, Sinkin RA, Kendig JW. Epidemiology of neonatal necrotising enterocolitis: a population-based study. Paediatr Perinat Epidemiol. 2002 Oct;16(4):342–349. doi: 10.1046/j.1365-3016.2002.00445.x. [DOI] [PubMed] [Google Scholar]