

Non-technical summary
Brain function is critically dependent on the regulation of cerebral blood flow (CBF) by cerebral blood vessels. We show that a mechanical blood vessel property called compliance plays an important role in determining the way cerebral blood vessels respond to changes in blood pressure. These results enhance our knowledge of how cerebral blood vessels regulate CBF, which is critical to understanding the causes and effects of cerebrovascular diseases such as stroke and dementia.
Abstract
Abstract
The fundamental determinants of human dynamic cerebral autoregulation are poorly understood, particularly the role of vascular compliance and the myogenic response. We sought to 1) determine whether capacitive blood flow associated with vascular compliance and driven by the rate of change in mean arterial blood pressure (dMAP/dt) is an important determinant of middle cerebral artery velocity (MCAv) dynamics and 2) characterise the impact of myogenic blockade on these cerebral pressure–flow velocity relations in humans. We measured MCAv and mean arterial pressure (MAP) during oscillatory lower body negative pressure (n = 8) at 0.10 and 0.05 Hz before and after cerebral Ca2+ channel blockade (nimodipine). Pressure–flow velocity relationships were characterised using transfer function analysis and a regression-based Windkessel analysis that incorporates MAP and dMAP/dt as predictors of MCAv dynamics. Results show that incorporation of dMAP/dt accounted for more MCAv variance (R2 0.80–0.99) than if only MAP was considered (R2 0.05–0.90). The capacitive gain relating dMAP/dt and MCAv was strongly correlated to transfer function gain (0.05 Hz, r = 0.93, P < 0.01; 0.10 Hz, r = 0.91, P < 0.01), but not to phase or coherence. Ca2+ channel blockade increased the conductive gain relation between MAP and MCAv (P < 0.05), and reduced phase at 0.05 Hz (P < 0.01). Capacitive and transfer function gain were unaltered. The findings suggest capacitive blood flow is an important determinant of cerebral haemodynamics that bears strong relations to some metrics of dynamic cerebral autoregulation derived from transfer function analysis, and that Ca2+ channel blockade enhances pressure-driven resistive blood flow but does not alter capacitive blood flow.
Introduction
Dynamic cerebral autoregulation (dCA) refers to cerebral blood flow control during dynamic changes in blood pressure, such as those experienced during orthostasis (Sorond et al. 2009). Although the underlying mechanisms are not fully established, it is frequently assumed that dCA results from active adjustments in cerebral vascular resistance (or conductance) and that such changes are the primary determinants of dynamic cerebral pressure–flow relations (Aaslid et al. 1989; Hamner et al. 2010).
However, intracranial arteries are distensible (Monson et al. 2008) and one recent computer simulation of a Windkessel model of the cerebral circulation has implicated vascular compliance as an important determinant of dynamic cerebral pressure–flow relationships characterized in the frequency domain (Zhang et al. 2009). This notion introduces added complexity to the study of dCA physiology because dCA metrics derived from transfer function analysis (TFA) are commonly ascribed to active vascular control mechanisms such as the myogenic response, without recognizing that mechanical properties of the cerebral vasculature may also be influential. Indeed, if vascular compliance were deterministic, the characterisation of cerebral haemodynamics and the interpretation of transfer function parameters would necessitate consideration of the rate of pressure change that drives the volume expansion in compliant vessels (i.e. capacitive blood flow) in addition to the instantaneous blood pressure that drives blood flow directly through small resistive vessels (Chan et al. 2011). However, to date no studies have attempted to fit empirical data to a cerebral Windkessel model to quantify the compliance contribution to cerebral blood flow dynamics and no studies have examined the relationship between the data-derived Windkessel parameters and cerebral transfer function metrics (gain, phase and coherence). Furthermore, whilst the myogenic vascular response is frequently cited as a key determinant of cerebral haemodynamics (Zhang et al. 2009; Hamner et al. 2010), there are limited experimental descriptions of pressure–flow relations following vascular Ca2+ channel blockade. Given there is growing acceptance that dCA impairment is an adverse clinical indicator especially in conditions associated with hypertension and elevated blood pressure variability (Ko et al. 2010), understanding the determinants of cerebral pressure–flow relationships is critical to establishing the mechanisms and impact of diseases that affect the cerebral circulation.
In this study we implemented a regression analysis approach based on the Windkessel model to quantitatively evaluate the importance of vascular conductance and compliance properties in the dynamic pressure–flow relationships of the human cerebral circulation. The approach allowed us to quantify the extent steady state vascular resistance and compliance determined dynamic cerebral-pressure flow velocity relations on an individual basis, which is not possible via model simulation (Zhang et al. 2009). Our first objective was to test the hypothesis that mean middle cerebral artery velocity (MCAvmean) fluctuations reflect not only pressure driven resistive blood flow, but also capacitive blood flow driven by the rate of change in blood pressure. Our second objective was to examine the relationship between established metrics of dCA derived using standard TFA (Zhang et al. 1998) and the parameters derived from the Windkessel model. Finally, given that Ca2+ channel blockade can potentially increase vascular compliance and conductance (Glasser et al. 1998), we also sought to characterise the changes in human cerebral pressure–flow velocity relations following Ca2+ channel blockade. To ensure the results were not confounded by the barrier properties of the cerebral arterial vasculature (Ge et al. 2005) or changes in systemic blood pressure, which can alter cerebral pressure–flow velocity relationships independent of dCA (Kolb et al. 2007; Zhang et al. 2009), we administered nimodipine, which readily crosses the blood–brain barrier and has high specificity for the cerebrovasculature (Haws & Heistad, 1984b).
Methods
Eight healthy subjects (one female) were recruited in this study, which was approved by the New Zealand Central Regional Ethics Committee and conformed to the standards set by the Declaration of Helsinki. The subjects’ mean age was 25 ± 5 years and all had abstained from caffeine-containing beverages for at least 12 h prior to the study. The subjects were advised to have a light breakfast at least 2 h prior to the study, which was conducted between 09.00 and 12.00 h.
Measurements
We recorded the electrocardiogram, non-invasive beat-to-beat blood pressure via finger photoplethysmography (Finometer MIDI, MLE1054-V, Finapres Medical Systems, Amsterdam, The Netherlands), right middle cerebral artery blood flow velocity (MCAv; 2 MHz pulsed Doppler ultrasound, DWL Doppler, Sterling, VA, USA), and end tidal CO2 sampled from a face mask (gas analyser model ML206, ADInstruments, Colorado Springs, CO, USA). Data were acquired continuously at 1 kHz per channel via an analog-to-digital converter (PowerLab/16SP ML795; ADInstruments) interfaced with a computer, and stored for off-line analysis. From the recorded electrocardiogram, blood pressure and MCAv waveforms, we determined the time of each R wave and beat-to-beat values for MCAv MCAvmean and mean arterial pressure (MAP) calibrated against periodic brachial-cuff pressure recordings. Data were processed and analysed with custom written software in LabView 8.2 (National Instruments, Austin, TX, USA).
Experimental protocol
All subjects were studied in the supine position in a temperature-controlled laboratory (22–23°C) with their lower body sealed in a tank connected to a vacuum source. The study began with an initial 10 min stabilisation period to allow subjects to acclimatise to the instrumentation and laboratory environment. We then recorded 6 min of resting data before commencing oscillatory lower body negative pressure (OLBNP) between 0 and −120 mmHg applied sequentially at 0.05 and 0.10 Hz to generate large oscillations in blood pressure. These oscillatory frequencies lie within the predefined very low (VLF; 0.02–0.07 Hz) and low frequency (LF; 0.07–0.2 Hz) bands where dCA is thought to be most active (Hamner et al. 2004, 2010). Moreover, they were selected based on the consideration that transfer function characteristics are different at these two frequencies (Hamner et al. 2004). A minimum of 10–12 cycles was completed at each frequency, which was well tolerated as all subjects were allowed to accustom to the OLBNP procedure following instrumentation. Following completion of OLBNP, all subjects ingested 60 mg of the dihydropyradine Ca2+ antagonist nimodipine before repeating the protocol ∼50–60 min post-ingestion to coincide with peak pharmacodynamic activity on the cerebrovasculature (Buggy et al. 2000). Recalibration of the finger blood pressure device was always performed before the OLBNP trial to ensure accuracy of measurement and verified against manual brachial artery blood pressure measures.
Resistive vs. capacitive flow quantification
Whereas TFA considers only the relations between MAP and MCAvmean, we applied a regression-based analysis method that incorporates MAP as well as the rate of change in MAP (dMAP/dt) as independent predictors of MCAvmean dynamics. This analysis method is based on a Windkessel model of the cerebral arterial compartment, as described in detail previously (Chan et al. 2011) and outlined briefly in the Appendix. The main implication of this Windkessel analysis is that both MAP driven flow through resistance vessels and dMAP/dt driven volume changes in compliant vessels (i.e. capacitive blood flow) are accounted for. Parameter estimation is achieved through the identification of average MCAvmean and MAP waveform patterns as a function of the OLBNP cycle using a validated extraction algorithm (Gilad et al. 2005; Tzeng et al. 2007; Tzeng et al. 2009; Sin et al. 2010). Briefly, beat-to-beat MAP and MCAvmean time series were resampled to 4 Hz and passed through a 0.20 Hz zero-phase lowpass filter (8th order Butterworth) to exclude high frequency fluctuations unrelated to the OLBNP stimuli at 0.05 and 0.10 Hz (such as respiration). To remove very low frequency baseline changes unrelated to the induced pressure oscillations, both MCAvmean and MAP were also detrended using a Hanning-windowed moving average (20 s window for 0.10 Hz OLBNP; 40 s window for 0.05 Hz OLBNP). The resultant MCAvmean, MAP and dMAP/dt (obtained by 3-point derivative of MAP) were subdivided into 10–12 consecutive segments of length equal to the OLBNP stimulus period as determined from the tank pressure signal. All data segments were then superimposed and ensemble averaged to generate the final average MCAvmean, MAP and dMAP/dt pattern waveforms (Fig. 1C). To account for delayed compliance (Porciuncula et al. 1964; Mandeville et al. 1999), the lag corresponding to the maximum positive correlation between dMAP/dt and detrended MCAvmean was determined and the dMAP/dt shifted to incorporate this delay (Chan et al. 2011). Finally, parameter estimates were obtained using forward stepwise multiple linear regression with the low pass filtered MCAvmean as the dependent variable, and MAP and dMAP/dt as independent predictors. The percentage of MCAvmean variation explained by MAP and dMAP/dt was quantified as the coefficient of determination (R2). The conductive gain relating MAP and MCAvmean and the capacitive gain relating dMAP/dt and MCAvmean were quantified as the unstandardised β-coefficient from the model. Standardised β-coefficients were ranked to determine the relative contributions of each input variable in explaining MCAvmean variance. For the identification of the single conductance model, linear least squares regression was performed with MCAvmean and MAP as the dependent and predictor variables, respectively. Given blood flow velocity cannot provide a measure of absolute flow, analyses were also performed using normalised low pass filtered MCAvmean as previously described (Kolb et al. 2007; Panerai, 2008).
Figure 1. Representative data for one subject.

A, MAP (dark line), MCAvmean (grey line), and tank pressure during 0.05 Hz OLBNP. B, corresponding power spectra with distinct peaks at 0.05 Hz. C, averaged dMAP/dt, MAP and MCAvmean waveforms as functions of the OLBNP cycle.
Transfer function analysis
Beat-to-beat MAP and MCAvmean signals were spline interpolated and re-sampled at 4 Hz for spectral and transfer function analyses based on the Welch algorithm. Each recording was first subdivided into successive overlapping windows of 60 s duration for data collected under the 0.10 Hz OLBNP condition, and 120 s duration for the 0.05 Hz condition, with 75% overlap between consecutive windows. Data within each window were linearly detrended, passed through a Hanning window, and subjected to fast Fourier transform analysis. The peaks of the corresponding MAP and MCAvmean power spectra were taken as indices of spectral power density under each OLBNP condition. For transfer function analysis of the cerebral circulation, the cross-spectrum between MAP and MCAvmean was determined and divided by the MAP auto-spectrum to derive the transfer function gain, phase and coherence indices at 0.10 and 0.05 Hz. Transfer function gain was also assessed using normalized units defined as beat-to-beat values divided by the mean value relative to changes in beat-to-beat blood pressure (Panerai, 2008).
Statistical analysis
Parity with a normal distribution was assessed for all parameters using the Shapiro–Wilk test and log transformed if necessary prior to analysis. Two-way repeated measures ANOVA (OLBNP frequency × blockade) was used to test for within subject differences between the study conditions (Greenhouse–Geisser corrected). A priori defined comparisons assessing the impact of Ca2+ channel blockade on spectral power and transfer function gain, phase and coherence were performed using Student's paired t test. Relationships between variables were described with Pearson's product moment correlation coefficients. All data were analysed using SPSS 17 (SPSS, Chicago, IL, USA) and Prism 4 (Graphpad Software, La Jolla, CA, USA). Statistical significance was set a priori at P < 0.05. All values are given as means ± SD unless otherwise stated.
Results
Baseline parameters
Table 1 presents baseline cardiovascular, respiratory and cerebrovascular variables before and after Ca2+ channel blockade. The blockade did not alter baseline R-R interval, breathing rate, blood pressure or end tidal CO2 (Table 1). However, MCAvmean was reduced from 71 ± 9 cm s−1 under the control condition to 61 ± 9 cm s−1 post-Ca2+ channel blockade (P < 0.01).
Table 1.
Effect of nimodipine on baseline cardiorespiratory parameters
| Variable | Control | Blockade |
|---|---|---|
| R-R interval (s) | 1.1 ± 0.17 | 1.02 ± 0.21 |
| Breathing rate (breaths min−1) | 15 ± 3.8 | 14 ± 5.0 |
| End tidal CO2 (mmHg) | 40 ± 3.2 | 39 ± 3.8 |
| Systolic blood pressure (mmHg) | 109 ± 8.0 | 110 ± 8.3 |
| Diastolic blood pressure (mmHg) | 65 ± 5.8 | 63 ± 7.6 |
| Mean arterial pressure (mmHg) | 71 ± 9.7 | 75 ± 5.7 |
| MCAvmean (cm s−1) | 71 ± 9.2 | 61 ± 9.4* |
R-R interval, cardiac period; MCAvmean, mean middle cerebral artery flow velocity.
P < 0.01 vs. control.
OLBNP: Windkessel analysis
Representative recordings showing pressure–flow velocity oscillations, corresponding MAP and MCAvmean power spectra, and dMAP/dt, MAP, and MCAvmean patterns are presented in Fig. 1, illustrating the highly coherent and well-controlled fluctuations typical of recordings in this study. Pattern analysis (Fig. 2) showed that dMAP/dt led changes in MCAvmean (with a delay of 1.3 ± 0.42 s at 0.05 Hz and 1.3 ± 0.85 s at 0.10 Hz) as well as MAP. Summary of parameter estimates from the Windkessel analysis are shown in Table 2. Of the eight subjects, the dMAP/dt compliance term was the dominant predictor of MCAvmean reaching statistical significance in all subjects under all conditions. In contrast, under the control condition, the MAP conductance term reached significance in only 5/8 subjects during 0.05 Hz OLBNP, and in 4/8 subjects during 0.10 Hz OLBNP. Post-Ca2+ blockade, the MAP term was significant in 5/8 and 6/8 subjects during 0.05 and 0.1 Hz OLBNP, respectively.
Figure 2. dMAP/dt, MAP and MCAvmean pattern waveforms for two subjects (A and B, shown in the upper and lower panels) before and after Ca2+ channel blockade during 0.05 and 0.10 Hz OLBNP.

These examples highlight the phase lead of dMAP/dt on MCAvmean and MAP, and the differences in pattern morphologies between 0.05 and 0.10 Hz OLBNP
Table 2.
Parameter estimates between control and Ca2+ channel blockade condition during 0.05 and 0.10 Hz OLBNP
| 0.10 Hz | 0.05 Hz | 2 × 2 RMANOVA | |||||
|---|---|---|---|---|---|---|---|
| Control | Blockade | Control | Blockade | Freq | Con | Freq × Con | |
| Windkessel model | |||||||
| Capacitive gain (cm mmHg−1) | 1.7 ± 0.30 | 1.8 ± 0.58 | 1.6 ± 0.87 | 1.4 ± 0.60 | 0.23 | 0.94 | 0.40 |
| Conductive gain (cm s−1 mmHg−1) | 0.022 ± 0.077 | 1.8 ± 0.58 | −0.008 ± 0.21 | 0.20 ± 0.35 | 0.60 | <0.05 | 0.28 |
| R2 | 0.99 ± 0.016 | 0.99 ± 0.0097 | 0.91 ± 0.065 | 0.89 ± 0.068 | — | — | — |
| Normalised Windkessel model | |||||||
| Capacitive gain (% s−1 mmHg−1) | 2.3 ± 0.45 | 2.9 ± 0.87 | 2.4 ± 1.2 | 2.3 ± 0.93 | 0.38 | 0.58 | 0.22 |
| Conductive gain (% mmHg−1) | 0.11 ± 0.36 | 0.13 ± 0.10 | −0.038 ± 0.32 | 0.27 ± 0.51 | 0.96 | <0.05 | 0.26 |
| R2 | 0.97 ± 0.03 | 0.99 ± 0.0044 | 0.91 ± 0.069 | 0.89 ± 0.067 | — | — | — |
| Conductance model | |||||||
| Conductive gain (cm s−1 mmHg−1) | 0.82 ± 0.32 | 0.96 ± 0.35 | 0.21 ± 0.32 | 0.48 ± 0.40 | <0.05 | <0.05 | 0.17 |
| R2 | 0.53 ± 0.23 | 0.64 ± 0.22 | 0.34 ± 0.31 | 0.42 ± 0.33 | — | — | — |
| Normalised conductance model | |||||||
| Conductive gain (% mmHg−1) | 1.1 ± 0.35 | 1.5 ± 0.49 | 0.31 ± 0.47 | 0.71 ± 0.52 | <0.05 | <0.05 | 0.91 |
| R2 | 0.97 ± 0.031 | 0.89 ± 0.068 | 0.91 ± 0.069 | 0.99 ± 0.005 | — | — | — |
Freq, frequency; Con, drug condition; Freq × Con, interaction.
Across all subjects the Windkessel model explained a substantial portion (>80%) of MCAvmean variance during both OLBNP frequencies, as indexed in higher adjusted R2 compared to the single conductance model (Table 2). The main effect for conductive gain was significant across condition (P < 0.05), suggesting an important contribution of resistive blood flow post blockade. Ranking of the standardised β-coefficients showed that the compliance term was always ranked higher than the conductance term under both control and Ca2+ channel blockade conditions. Representative model analyses are shown for two subjects in Fig. 3. The Windkessel analysis obtained excellent fits under all conditions (R2 range 0.80–0.99). In contrast, the conductance model had lower overall explanatory power (R2 range 0.05–0.90), which varied across conditions and individuals. For example, the conductance model performed poorly for subject A of Fig. 3 at 0.05 Hz under both control and blockade conditions. In contrast, the conductance model fit improved substantially post-blockade in subject B of Fig. 3. Similar results were obtained using normalized MCAvmean.
Figure 3. Representative model analyses for the same subjects shown in figure 2.

Recorded MCAvmean (bold line) and modelled MCAvmean waveforms (WK, Windkessel model; C, conductance model) illustrate the better fit achieved with the Windkessel model compared with the single conductance model.
OLBNP: power spectral and transfer function analysis
Ca2+ channel blockade did not alter peak power spectral densities of MAP or MCAvmean (Fig. 4). Transfer function coherence under the control condition was >0.78 during both OLBNP frequencies and the transfer function phase lead of MCAvmean on MAP was seen in all subjects (Fig. 5, control conditions). Figure 5 also shows that Ca2+channel blockade did not alter coherence or gain at 0.05 Hz, but lowered phase. In contrast, the blockade increased coherence at 0.10 Hz but did not alter the phase or gain. Ca2+ channel blockade did not alter normalised gain at 0.05 Hz (0.89 ± 0. 34 vs. 1.1 ± 0.35% mmHg−1, P = 0.20) or 0.10 Hz (1.6 ± 0. 29 vs. 1.9 ± 0.56% mmHg−1p = value: P = 0.22).
Figure 4. Effect of nimodipine on MAP (left panels) and MCAvmean (right panels) peak power spectral densities during 0.01 and 0.05 Hz OLBNP.
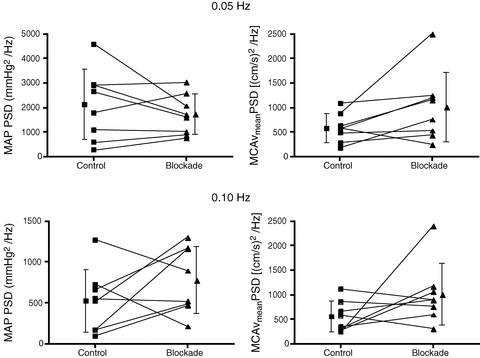
Ca2+ channel blockade did not alter peak power spectral densities of MAP (0.05 Hz, P = 0.35; 0.10 Hz, P = 0.21) or MCAvmean (0.05 Hz, P = 0.08; 0.10 Hz, P = 0.15).
Figure 5. Effect of nimodipine on transfer function coherence, phase and gain at 0.01 and 0.05 Hz OLBNP.

Ca2+ channel blockade was associated with lower transfer function phase during 0.05 Hz OLBNP, and increase in coherence during 0.10 Hz OLBNP.
Relationship between Windkessel and transfer function parameters
Table 3 summarises the relationships between Windkessel and TFA parameters. Capacitive gain was correlated to transfer function gain during both 0.10 Hz and 0.05 Hz OLBNP. Capacitive gain did not relate to transfer function phase during 0.10 Hz or 0.05 Hz OLBNP, nor did it relate to transfer function coherence during 0.10 Hz or 0.05 Hz. Conductive gain did not relate to transfer function gain but was correlated to phase and coherence during 0.05 Hz OLBNP. In contrast, conductive gain did not relate to transfer function gain, phase or coherence during 0.10 Hz OLBNP.
Table 3.
Correlation coefficients between transfer function and Windkessel parameters
| Coherence | Phase | Gain | |
|---|---|---|---|
| 0.10 Hz transfer function | |||
| Capacitive gain (cm mmHg−1) | 0.18 | −0.28 | 0.91* |
| Conductive gain (cm s−1 mmHg−1) | −0.28 | 0.23 | 0.65 |
| 0.05 Hz transfer function | |||
| Capacitive gain (cm mmHg−1) | 0.29 | −0.52 | 0.93* |
| Conductive gain (cm s−1 mmHg−1) | 0.90* | −0.90* | 0.33 |
P < 0.01.
Discussion
Our analytic approach incorporating both MAP and dMAP/dt accounted for a substantial proportion (>80%) of MCAvmean variance under the conditions of this study. In keeping with our hypothesis, these results indicate the observed fluctuations in MCAvmean reflect not only pressure driven resistive flow, but also capacitive flow determined by the rate of change in blood pressure and cerebrovascular compliance. Our study also identified strong correlations between commonly used TFA-based dCA metrics and the mechanical properties of cerebral vasculature derived from the Windkessel model, which has not been demonstrated previously based on analysis of empirical pressure and flow velocity data. Given that capacitive gain was positively related to TFA gain and the conductive gain was negatively related with TFA phase, our findings provide new evidence that TFA metrics may reflect not only active control of vascular tone by dCA, but also steady state vascular resistance and compliance. Furthermore, this study is the first to show that Ca2+ channel blockade enhances conductive gain and reduces TFA phase at 0.05 Hz. Given nimodipine-induced cerebral vasodilatation is well documented (Towart & Kazda, 1979; Kazda & Towart, 1982; Towart et al. 1982; Haws et al. 1983; Haws & Heistad, 1984a,b; Scriabine & van den Kerckhoff, 1988), the changes most likely reflect the accentuation of forward travelling resistive flow through the cerebral circulation. Before elaborating on the physiological implications of our findings, several methodological considerations warrant discussion.
Methodological considerations
First, blood flow velocity is an adequate surrogate of absolute flow only if the insonated vessel maintains constant vessel diameter across time and experimental conditions. We found that MCAvmean was lowered following Ca2+ channel blockade, indicating that our clinical dose of nimodipine effected changes in the cerebrovasculature. However, assuming constant MCA calibre, this would imply CBF was reduced following blockade, which is inconsistent with the well-documented vasodilatory action of nimodipine that underpins its clinical use in the treatment of cerebral vasospasm (Biondi et al. 2004). Available data indicates nimodipine crosses the blood–brain barrier, exhibits higher selectivity for cerebral over systemic blood vessels, dilates cerebral arterioles under direct visual examination, and increases CBF as determined using a range of CBF quantification techniques (Towart & Kazda, 1979; Kazda & Towart, 1982; Towart et al. 1982; Haws et al. 1983; Haws & Heistad, 1984a,b; Scriabine & van den Kerckhoff, 1988). Therefore, nimodipine is likely to have altered MCA tone such that the overall MCAvmean reduction reflects an increase in MCA calibre that is not fully offset by increases in CBF secondary to cerebral arteriolar dilatation. These changes illustrate the inherent limitations of using MCAvmean as a surrogate of absolute CBF. However, given results obtained with normalized MCAvmean support those calculated using absolute values, such changes do not alter our principal conclusions. Second, we applied a relatively high level of OLBNP in recognition that blood pressure fluctuations associated with physical activity and orthostasis are considerably larger than those at rest, and that capacitive blood flow is driven by dMAP/dt. While our experimental approach can be generalised to situations where blood pressure is actively augmented, it may not apply to conditions where blood pressure fluctuations are smaller/slower (e.g. under spontaneous conditions without perturbations) or under different experimental settings such as in the presence of altered end-tidal  levels. Third, linearity is an inherent assumption of both TFA and our regression-based analysis approach. Although previous work suggests that such assumptions of linearity in pressure–flow velocity relations may not hold especially under spontaneous conditions (Zhang et al. 1998), our application may be justified given TFA coherence at both 0.05 and 0.10 Hz were high across all conditions. This is consistent with prior work showing active blood pressure augmentation can dramatically increase the linearity between MAP and MCAvmean fluctuations (Claassen et al. 2009). Fourth, our findings document the impact of nimodipine at clinical dosages used for cerebral vasospasm treatment (Rinkel et al. 2005). Although a clear treatment effect was seen, we caution the extrapolation of our data to higher levels of blockade.
Windkessel analysis and its implications
Zhang et al. (2009), based on computer simulations of a Windkessel model, have reported that increases in steady state cerebrovascular resistance and or decreases in compliance could alter dynamic pressure–flow velocity relations within the cerebral circulation. Although we did not alter steady state resistance and or compliance via systemic blood pressure manipulation, our findings that the inclusion of dMAP/dt captured the majority of MCAvmean variance (Table 2) and that dMAP/dt led changes in both MAP and MCAvmean provide new quantitative evidence to support the concept that vascular compliance modulates dynamic pressure–flow relationships (Zhang et al. 2009). In contrast to prior analysis based on computer simulations of a Windkessl model (Zhang et al. 2009), we have adopted a data driven approach that directly fits pressure and flow velocity data to the Windkessel model. Therefore, our unique approach quantifies the contribution of vascular resistance and compliance properties in the MCAvmean response to mechanically induced pressure oscillations, which allows interpretable parameters (capacitive and conductive gains) to be derived for individualised characterisation of human cerebral haemodynamics not obtainable using model simulations. Furthermore, our data provide empirical evidence to justify the importance of their contribution by documenting the high explanatory power of the Windkessel model.
Another important finding was that dMAP/dt led both MAP and MCAvmean. This observation may explain the phase lead of MCAvmean relative to MAP commonly reported with TFA (Fig. 4). It has previously been suggested that this peculiar relation whereby the output variable (MCAvmean) appears to lead rather than lag behind the input variable (MAP) is due to a temporal mismatch between autonomic control of cerebrovascular vs. peripheral vascular resistance (Cencetti et al. 1999). Another explanation is that the phase lead is merely a mathematical ‘artifact’ of the relation between the physiological responses of cerebrovascular resistance to changes in blood pressure (Hughson et al. 2001). Although both are plausible mechanisms, it is important to recognise that neither accounts for the distensible nature of intracranial vessels (Monson et al. 2008). Consequently, both explanations ignore compliance and inertial factors that are likely to be influential under non-steady state conditions in which blood flow is accelerating or decelerating (Kontos, 1989). As our findings suggest, the presence of capacitive flow attributable to dMAP/dt and cerebrovascular compliance warrants consideration as an alternative explanation for why MCAvmean leads MAP (Zhang et al. 2009).
We observed a strong positive correlation between TFA gain and capacitive gain, and a strong negative correlation between TFA phase and conductive gain. While not disassociating cause from effect, these results suggest that the conditions of this study TFA gain may largely reflect dMAP/dt driven capacitive flow, whereas TFA phase reflects MAP driven resistive blood flow. Therefore, metrics of dCA commonly used in clinical and basic science studies, including cerebral TFA, may reflect cerebrovascular compliance, steady-state resistance as well as active dynamic adjustments in cerebral vascular resistance. Future work should attempt to clarify the relative contributions of these factors under differing physiological conditions, which is an important consideration given the physiological interpretation of TFA metrics remains debatable (Subudhi et al. 2009).
Effect of Ca2+ channel blockade
In this study Ca2+ channel blockade was associated with an increase in conductive gain. Taken in context of the negative correlation between conductive gain and TFA phase under the control condition, we speculate that the conductive gain increase and TFA phase reduction at 0.05 Hz reflects an augmentation of resistive flow fluctuations. Whilst a reduction in vascular compliance could account for these changes, we consider cerebral vasodilatation as the more likely explanation given nimodipine is a potent cerebral vasodilator and would be expected to increase rather than decrease vascular compliance. The absence of any further phase reduction at 0.10 Hz post-blockade may reflect the fact that conductive gain, and by implication resistive flow, was already greater at 0.10 Hz compared to the 0.05 Hz condition, consistent with the high pass filter characteristics of the cerebral circulation (Hamner et al. 2004).
We found no changes in capacitive gain or TFA gain during both 0.05 and 0.10 Hz OLBNP. This observation was surprising as myogenic blockade would be expected to enhance the amplitudinal relations between pressure and flow through blunting of active dCA. Although we have no clear explanation for this lack of response, factors such as the level of blockade, frequency/level of OLBNP, and potential differential effects of nimodipine on proximal vs. downstream cerebrovascular vasodilatation may be influential and warrant further study. We found that TFA coherence increased at 0.10 Hz following blockade, consistent with further linearisation of cerebral pressure–flow velocity relations that cannot be explained by changes in MAP input power, which was unchanged. However, blockade did not alter coherence at 0.05 Hz, possibly because coherence was already high due to blood pressure augmentation with OLBNP.
Comparison to previous studies
The effects of Ca2+ channel blockade on the frequency response characteristics of CBF regulation has previously been examined in rats using pressure and volumetric flow recordings taken at the level of the common carotid artery during periodic abdominal aorta occlusion (0.008–0.5 Hz) (Kolb et al. 2007). It was shown that blockade (nifedipine) did not alter transfer function coherence as we have found, but increased gain and reduced phase in the VLF range (<0.10 Hz for the rat). These findings suggest that vascular myogenic mechanisms are a major determinant of VLF cerebral pressure–flow relationships. Although our findings in humans do not fully recapitulate those of the rat, the phase reductions at 0.05 Hz, which lie within the VLF range for humans, are comparable. However, a direct comparison against our data needs to be done with caution in view of major differences including species, the use of anaesthesia, and the significant hypotension associated with the use of nifedipine (Kolb et al. 2007), which may have elicited cerebrovascular dilatation and promoted greater resistive flow independent of dCA changes. Therefore, we consider the use of nimodipine an important strength of the present study, as we were able to target the cerebrovasculature without introducing potential confounds related to changes in systemic blood pressure (Kolb et al. 2007; Zhang et al. 2009).
Influence of a cerebral ‘vascular waterfall’
Both human and animal data indicate that a vascular waterfall or Starling resistor mechanism operates within the arterial compartment (including the cerebral circulation) such that it is the pressure gradient between MAP and critical closing pressure (as opposed to downstream venous pressure) that drives flow (Aaslid et al. 2003). Since cerebral perfusion pressure is given as MAP –Pc in our analysis (with Pc denoting the capillary pressure, as illustrated in the Appendix), critical closing pressure was accounted for by Pc, which was assumed to be constant under each condition. The excellent fits obtained in our analysis suggested that this assumption was justified. Given MAP-related variation could explain most of the MCAvmean variance during OLBNP, the contribution from changes in Pc, if any, appears to be relatively small. Further, human cerebral critical closing pressure obtained during long diastoles following induced ventricular fibrillation are estimated to be ∼33 mmHg (Aaslid et al. 2003). In the presence of a Starling resistor mechanism, oscillatory venous pressure fluctuations would not compromise our results unless downstream venous pressures exceeded the critical closing pressure (i.e. the waterfall itself). Although we did not measure central venous pressure (CVP), OLBNP at frequencies comparable to those induced in this study have been shown to reduce mean CVP and generated only relatively small (∼4 mmHg) CVP oscillations (Levenhagen et al. 1994). Therefore, we consider it unlikely that CVP readily exceeded critical closing pressure during OLBNP in this study.
Implications
The current study suggests that MCAvmean responses during OLBNP appear to be dominated by capacitive blood flow both before and after Ca2+ channel blockade. These findings raise the possibility that compliant cerebral vessels may act as a mechanical buffer against dynamic pressure fluctuations and that this compliance effect may act in concert with active dCA. The major implications are that metrics of dCA such as cerebral TFA may reflect cerebrovascular compliance properties as well as active adjustment in resistance. Moreover, the observation that resistive flow variation increases following Ca2+ channel blockade suggests that this class of drug may augment the proportion of non-buffered resistive blood flow fluctuation, rendering the cerebral microcirculation more vulnerable to systemic blood pressure fluctuations. This might help explain why nimodipine appears to have detrimental effects post ischaemic stroke (Whalgren et al. 1994).
Conclusion
In summary, we found that MCAvmean responses during OLBNP appear to be dominated by dMAP/dt both before and after Ca2+ channel blockade. These findings raise the possibility that dMAP/dt driven capacitive blood flow through compliance vessels may reflect the mechanical buffering of flow against pressure fluctuations that complements active dCA mediated by myogenic and or neurogenic mechanisms. Furthermore, we have characterised human cerebral pressure–flow velocity relations in the presence of cerebrovascular Ca2+ channel blockade. The increase in conductive gain post-blockade is likely to reflect accentuated resistive blood flow fluctuations.
Acknowledgments
This work was supported by a New Zealand National Heart Foundation grant (no. 1284) awarded to Y.C.T. The authors thank the Department of Physiology, University of Otago for loan of equipment, and Peter W. Y. Sin, Aaron Wong and Sam Lucas for technical assistance.
Glossary
Abbreviations
- CVP
central venous pressure
- dCA
dynamic cerebral autoregulation
- dMAP/dt
rate of change in mean arterial pressure
- HF
high frequency
- LF
low frequency
- MAP
mean arterial pressure
- MCAvmean
mean middle cerebral artery velocity
- OLBNP
oscillatory lower body negative pressure
- TFA
transfer function analysis
- VLF
very low frequency
Appendix
The Windkessel analysis provides an aggregate measure of vascular properties downstream of the insonation site (i.e. MCA). We defined net MCA blood flow (Qin) as the sum of forward moving blood flow (Qout) through resistance vessels, and capacitive flow (QC) representing volume expansion and discharge in compliant vessels.
| (A1) |
Considering Fig. 6 as a representation of a resistance vessel, resistive flow Qout (equivalent to Qin in the absence of compliance) is calculated as the product of arterial conductance and the perfusion pressure gradient at the level of the MCA, given as
| (A2) |
where GAI is the lumped cerebral arterial conductance derived as the inverse of resistance ( ), PA is systemic arterial pressure, and PC the capillary pressure. The difference PA–PC is the perfusion pressure gradient. It is assumed that resistance derives mainly from resistive vessels such as the small pial arteries and arterioles, but there may also be some contribution from the larger size intracranial arteries (Kontos et al. 1978; Faraci & Heistad, 1990).
Figure 6. A conceptual representation of a blood vessel segment downstream of the middle cerebral artery (MCA).

PA is the upstream arterial pressure and PC is the downstream capillary pressure. Qin is inflow and Qout is outflow; PIC is the intracranial pressure and V is blood volume in the vessel.
Considering Fig. 6 as a representation of a compliance vessel, its haemodynamics can be described by the following equation:
| (A3) |
where QC is the capacitive flow, CAI is the lumped cerebral arterial compliance, and PIC is the intracranial pressure (governed by the combined influences of brain tissue volume, cerebrospinal fluid volume, and intracranial venous blood volume). The difference PA–PIC provides the distending pressure in the compliant vessel. It is assumed that compliance downstream of the MCA is dominated by the larger and relatively more distensible intracranial arteries, which may include the anterior/posterior parietal arteries as detailed previously (Monson et al. 2008).
Combining eqns (A2) and (A3) gives the total MCA flow:
| (A4) |
In this study PA was estimated from the finger MAP. PIC and PC were assumed to be significantly lower than PA and constant. GAI and CAI represent the basal (constant) cerebrovascular conductance and compliance of the vessel segment, hence any time varying change in resistance and compliance during the intervention would contribute to the residual term of unexplained variance. Using mean MCAv as a validated surrogate of MCA volumetric flow, the final Windkessel model is given as:
| (A5) |
where Cgainis the capacitive gain to the first derivative of MAP (dMAP/dt), Ggain is the conductive gain to MAP, and k is the constant.
Author contributions
Y.C.T. contributed to the study design, conducted the experiments, performed data analysis, interpreted results and drafted the manuscript. G.S.H.C. performed data analysis, interpreted results and critically reviewed the manuscript. C.K.W. conducted the experiments, interpreted results, and critically reviewed the manuscript. P.N.A., contributed to the study design, interpreted the results, and critically reviewed the manuscript. All authors have approved the final version of this article. The study was conducted in the Cardiovascular Systems Laboratory, Department of Surgery and Anaesthesia, University of Otago, Wellington, New Zealand.
References
- Aaslid R, Lash SR, Bardy GH, Gild WH, Newell DW. Dynamic pressure–flow velocity relationships in the human cerebral circulation. Stroke. 2003;34:1645–1649. doi: 10.1161/01.STR.0000077927.63758.B6. [DOI] [PubMed] [Google Scholar]
- Aaslid R, Lindegaard KF, Sorteberg W, Nornes H. Cerebral autoregulation dynamics in humans. Stroke. 1989;20:45–52. doi: 10.1161/01.str.20.1.45. [DOI] [PubMed] [Google Scholar]
- Biondi A, Ricciardi GK, Puybasset L, Abdennour L, Longo M, Chiras J, Van Effenterre R. Intra-arterial nimodipine for the treatment of symptomatic cerebral vasospasm after aneurysmal subarachnoid hemorrhage: preliminary results. AJNR Am J Neuroradiol. 2004;25:1067–1076. [PMC free article] [PubMed] [Google Scholar]
- Buggy DJ, Asher MJ, Lambert DG. Nimodipine premedication and induction dose of propofol. Anesth Analg. 2000;90:445–449. doi: 10.1097/00000539-200002000-00038. [DOI] [PubMed] [Google Scholar]
- Cencetti S, Lagi A, Cipriani M, Fattorini L, Bandinelli G, Bernardi L. Autonomic control of the cerebral circulation during normal and impaired peripheral circulatory control. Heart. 1999;82:365–372. doi: 10.1136/hrt.82.3.365. [DOI] [PMC free article] [PubMed] [Google Scholar]
- Chan GSH, Ainslie P, Willie CK, Taylor CE, Atkinson G, Jones H, Lovell N, Tzeng YC. Contribution of arterial windkessel in low frequency cerebral hemodynmaics during transient changes in blood pressure. J Appl Physiol. 2011 doi: 10.1152/japplphysiol.01407.2010. (in press) [DOI] [PubMed] [Google Scholar]
- Claassen JA, Levine BD, Zhang R. Dynamic cerebral autoregulation during repeated squat-stand maneuvers. J Appl Physiol. 2009;106:153–160. doi: 10.1152/japplphysiol.90822.2008. [DOI] [PMC free article] [PubMed] [Google Scholar]
- Faraci FM, Heistad DD. Regulation of large cerebral arteries and cerebral microvascular pressure. Circ Res. 1990;66:8–17. doi: 10.1161/01.res.66.1.8. [DOI] [PubMed] [Google Scholar]
- Ge S, Song L, Pachter JS. Where is the blood-brain barrier … really? J Neurosci Res. 2005;79:421–427. doi: 10.1002/jnr.20313. [DOI] [PubMed] [Google Scholar]
- Gilad O, Swenne CA, Davrath LR, Akselrod S. Phase-averaged characterization of respiratory sinus arrhythmia pattern. Am J Physiol Heart Circ Physiol. 2005;288:H504–510. doi: 10.1152/ajpheart.00366.2004. [DOI] [PubMed] [Google Scholar]
- Glasser SP, Arnett DK, McVeigh GE, Finkelstein SM, Bank AK, Morgan DJ, Cohn JN. The importance of arterial compliance in cardiovascular drug therapy. J Clin Pharmacol. 1998;38:202–212. doi: 10.1002/j.1552-4604.1998.tb04417.x. [DOI] [PubMed] [Google Scholar]
- Hamner JW, Cohen MA, Mukai S, Lipsitz LA, Taylor JA. Spectral indices of human cerebral blood flow control: responses to augmented blood pressure oscillations. J Physiol. 2004;559:965–973. doi: 10.1113/jphysiol.2004.066969. [DOI] [PMC free article] [PubMed] [Google Scholar]
- Hamner JW, Tan CO, Lee K, Cohen MA, Taylor JA. Sympathetic control of the cerebral vasculature in humans. Stroke. 2010;41:102–109. doi: 10.1161/STROKEAHA.109.557132. [DOI] [PMC free article] [PubMed] [Google Scholar]
- Haws CW, Gourley JK, Heistad DD. Effects of nimodipine on cerebral blood flow. J Pharmacol Exp Ther. 1983;225:24–28. [PubMed] [Google Scholar]
- Haws CW, Heistad DD. Cerebral vasodilator effects of nimodipine. Bibl Cardiol. 1984a:123–127. [PubMed] [Google Scholar]
- Haws CW, Heistad DD. Effects of nimodipine on cerebral vasoconstrictor responses. Am J Physiol Heart Circ Physiol. 1984b;247:H170–176. doi: 10.1152/ajpheart.1984.247.2.H170. [DOI] [PubMed] [Google Scholar]
- Hughson RL, Edwards MR, O'Leary DD, Shoemaker JK. Critical analysis of cerebrovascular autoregulation during repeated head-up tilt. Stroke. 2001;32:2403–2408. doi: 10.1161/hs1001.097225. [DOI] [PubMed] [Google Scholar]
- Kazda S, Towart R. Nimodipine: a new calcium antagonistic drug with a preferential cerebrovascular action. Acta Neurochir (Wien) 1982;63:259–265. doi: 10.1007/BF01728880. [DOI] [PubMed] [Google Scholar]
- Ko Y, Park JH, Yang MH, Ko SB, Han MK, Oh CW, Lee J, Bae HJ. The significance of blood pressure variability for the development of hemorrhagic transformation in acute ischemic stroke. Stroke. 2010;41:2512–2518. doi: 10.1161/STROKEAHA.110.595561. [DOI] [PubMed] [Google Scholar]
- Kolb B, Rotella DL, Stauss HM. Frequency response characteristics of cerebral blood flow autoregulation in rats. Am J Physiol Heart Circ Physiol. 2007;292:H432–438. doi: 10.1152/ajpheart.00794.2006. [DOI] [PubMed] [Google Scholar]
- Kontos HA. Validity of cerebral arterial blood flow calculations from velocity measurements. Stroke. 1989;20:1–3. doi: 10.1161/01.str.20.1.1. [DOI] [PubMed] [Google Scholar]
- Kontos HA, Wei EP, Navari RM, Levasseur JE, Rosenblum WI, Patterson JL., Jr Responses of cerebral arteries and arterioles to acute hypotension and hypertension. Am J Physiol Heart Circ Physiol. 1978;234:H371–383. doi: 10.1152/ajpheart.1978.234.4.H371. [DOI] [PubMed] [Google Scholar]
- Levenhagen DK, Evans JM, Wang M, Knapp CF. Cardiovascular regulation in humans in response to oscillatory lower body negative pressure. Am J Physiol Heart Circ Physiol. 1994;267:H593–604. doi: 10.1152/ajpheart.1994.267.2.H593. [DOI] [PubMed] [Google Scholar]
- Mandeville JB, Marota JJ, Ayata C, Zaharchuk G, Moskowitz MA, Rosen BR, Weisskoff RM. Evidence of a cerebrovascular postarteriole windkessel with delayed compliance. J Cereb Blood Flow Meta. 1999;19:679–689. doi: 10.1097/00004647-199906000-00012. [DOI] [PubMed] [Google Scholar]
- Monson KL, Barbaro NM, Manley GT. Biaxial response of passive human cerebral arteries. Ann Biomed Eng. 2008;36:2028–2041. doi: 10.1007/s10439-008-9578-9. [DOI] [PMC free article] [PubMed] [Google Scholar]
- Panerai RB. Cerebral autoregulation: from models to clinical applications. Cardiovasc Eng. 2008;8:42–59. doi: 10.1007/s10558-007-9044-6. [DOI] [PubMed] [Google Scholar]
- Porciuncula CI, Armstrong GG, Jr, Guyton AC, Stone HL. Delayed compliance in external jugular vein of the dog. Am J Physiol. 1964;207:728–732. doi: 10.1152/ajplegacy.1964.207.3.728. [DOI] [PubMed] [Google Scholar]
- Rinkel GJ, Feigin VL, Algra A, Van Den Bergh WM, Vermeulen M, van Gijn J. Calcium antagonists for aneurysmal subarachnoid haemorrhage. Cochrane Database Syst Rev. 2005:CD000277. doi: 10.1002/14651858.CD000277.pub2. [DOI] [PubMed] [Google Scholar]
- Scriabine A, Van Den Kerckhoff W. Pharmacology of nimodipine. A review. Ann N Y Acad Sci. 1988;522:698–706. doi: 10.1111/j.1749-6632.1988.tb33415.x. [DOI] [PubMed] [Google Scholar]
- Sin PY, Galletly DC, Tzeng YC. Influence of breathing frequency on the pattern of respiratory sinus arrhythmia and blood pressure: old questions revisited. Am J Physiol Heart Circ Physiol. 2010;298:H1588–1599. doi: 10.1152/ajpheart.00036.2010. [DOI] [PubMed] [Google Scholar]
- Sorond FA, Serrador JM, Jones RN, Shaffer ML, Lipsitz LA. The sit-to-stand technique for the measurement of dynamic cerebral autoregulation. Ultrasound Med Biol. 2009;35:21–29. doi: 10.1016/j.ultrasmedbio.2008.08.001. [DOI] [PMC free article] [PubMed] [Google Scholar]
- Subudhi AW, Panerai RB, Roach RC. Acute hypoxia impairs dynamic cerebral autoregulation: results from two independent techniques. J Appl Physiol. 2009;107:1165–1171. doi: 10.1152/japplphysiol.00498.2009. [DOI] [PMC free article] [PubMed] [Google Scholar]
- Towart R, Kazda S. The cellular mechanism of action of nimodipine (BAY e 9736), a new calcium antagonist [proceedings] Br J Pharmacol. 1979;67:409P–410P. doi: 10.1111/j.1476-5381.1979.tb08695.x. [DOI] [PMC free article] [PubMed] [Google Scholar]
- Towart R, Wehinger E, Meyer H, Kazda S. The effects of nimodipine, its optical isomers and metabolites on isolated vascular smooth muscle. Arzneimittelforschung. 1982;32:338–346. [PubMed] [Google Scholar]
- Tzeng YC, Larsen PD, Galletly DC. Effects of hypercapnia and hypoxemia on respiratory sinus arrhythmia in conscious humans during spontaneous respiration. Am J Physiol Heart Circ Physiol. 2007;292:H2397–2407. doi: 10.1152/ajpheart.00817.2006. [DOI] [PubMed] [Google Scholar]
- Tzeng YC, Sin PY, Galletly DC. Human sinus arrhythmia: inconsistencies of a teleological hypothesis. Am J Physiol Heart Circ Physiol. 2009;296:H65–70. doi: 10.1152/ajpheart.00716.2008. [DOI] [PubMed] [Google Scholar]
- Wahlgren NG, MacMahon DG, Keyser JD, Indredavik B, Ryman T. Intravenous nimodipine west european stroke trial (INWEST) of nimodipine in the treatment of acute ischaemic stroke. Cerebrovasc Dis. 1994;4:204–210. [Google Scholar]
- Zhang R, Behbehani K, Levine BD. Dynamic pressure-flow relationship of the cerebral circulation during acute increase in arterial pressure. J Physiol. 2009;587:2567–2577. doi: 10.1113/jphysiol.2008.168302. [DOI] [PMC free article] [PubMed] [Google Scholar]
- Zhang R, Zuckerman JH, Giller CA, Levine BD. Transfer function analysis of dynamic cerebral autoregulation in humans. Am J Physiol Heart Circ Physiol. 1998;274:H233–241. doi: 10.1152/ajpheart.1998.274.1.h233. [DOI] [PubMed] [Google Scholar]