

Abstract
Objectives
To determine oral health literacy (OHL) levels and explore potential racial differences in a low-income population.
Methods
This was a cross-sectional study of caregiver/child dyads who completed a structured 30-minute, in-person interview conducted by two trained interviewers in seven counties in North Carolina. Socio-demographic, OHL, and dental health related data were collected. OHL was measured with a dental word recognition test (REALD-30). Descriptive, bivariate and multivariate methods were used to examine the distribution of OHL and explore racial differences.
Results
Of 1,658 eligible subjects, 1,405 (85%) participated and completed the interviews. The analytic sample (N=1,280) had mean age 26.5 (SD=6.9) years with 60% having a high school degree or less. OHL varied between racial groups as follows: Whites—mean score=17.4 (SE=0.2); African American (AA)—mean score=15.3 (SE=0.2); American Indian (AI)—mean score=13.7 (SE=0.3). Multiple linear regression revealed that after controlling for education, county of residence, age and Hispanic ethnicity, Whites had 2.0 points (95%CI=1.4, 2.6) higher adjusted REALD-30 score versus AA and AI.
Conclusions
Differences in OHL levels between racial groups persisted after adjusting for education and socio-demographic characteristics.
Keywords: oral health literacy, WIC, racial differences
According to the most recent National Assessment of Adult Literacy Survey, nearly half (43%) of adults in the United States (U.S.) are at risk for low literacy. Adults with low literacy are unable to accurately and consistently use available print materials for everyday activities such as those related to health (1).
A number of studies have linked low health literacy to poor health (2–7), so there is strong evidence in medicine that individuals with lower health literacy also have poorer knowledge about disease prevention, management, and treatment (8). There is also evidence that low health literacy may threaten quality of care and contribute to unnecessary hospital costs (9,10). For example, a recent study of Medicaid participants revealed that those who read at the lowest grade levels (grades 0–3) had average annual health care costs of $10,688 compared with $2,891 for those with better literacy skills (≥4th grade reading level)(11).
While evidence from research in medicine highlights the importance of health literacy for patient knowledge and positive health behaviors and outcomes, health literacy has received little attention in dentistry. Oral health literacy (OHL) is defined by the NIDCR/HHS Working Group on Functional Health Literacy as “the degree to which individuals have the capacity to obtain, process, and understand basic oral health information and services needed to make appropriate health decisions.”(12) This definition encompasses comprehension of health information as well as the ability to use that information in making appropriate decisions related to oral health.
Dental literacy studies in the U.S. have been limited to those that assess the reading level of patient educational materials and postoperative instructions (13,14). The major reason why there has been limited research aimed at examining the role of oral health literacy and oral care outcomes is because of the lack of appropriate instruments to assess oral health literacy. The recent development of oral health literacy instruments (15–19) provides the necessary assessment tools to further investigate oral health literacy and health related outcomes.
Over the past 25 years the oral health status of the population in the U.S. has improved dramatically with the declining prevalence of dental disease. However, during this same time frame the prevalence of dental disease in certain sub-populations has not fallen significantly (20,21). Blacks, Hispanics and American Indian/Alaska Natives have the poorest oral health among all ethnic groups (22); coincidently, 77% of Hispanics and 75% of Blacks versus 39% of Whites are estimated to have marginal or inadequate health literacy (1). No single factor can explain the disparities in oral health status. In this respect, a major motivation in health literacy research has been to investigate its hypothesized contribution to the existing health disparities (23). This goal of eliminating health disparities is well articulated in the “Health People 2010”, but the link between health disparities and health literacy has not been firmly established yet. An examination of literacy in the oral health context and disparities has been even less developed. Atchison et al. (19) have recently reported a racial difference in OHL, contrasting Whites versus non-Whites, using a small sample of dental care-seeking participants. Our study aims to add to the knowledge basis of OHL using a large sample of low-income community-based female caregivers participating in WIC, and report on racial differences while benefitting from the sizeable proportions of African American (n=522) and American Indian (n=254) subjects. Understanding differences in OHL may provide insights into why some ethnic groups have better oral health than others, leading to a better understanding of factors that affect oral health.
The Carolina Oral Health Literacy (COHL) commenced in August of 2008 with the main goal of examining oral health literacy in juxtaposition to health behaviors and health outcomes among caregivers, infants, and children enrolled in the Women, Infants and Children’s (WIC) Supplemental Food Program in North Carolina (NC), a socially and economically disadvantaged and medically underserved population that is likely to have a low level of OHL that may adversely affect their access to needed dental health services. The findings presented in this paper are focused on the assessment of OHL level in the low-income WIC population and differences in OHL among racial groups.
METHODS
Although the COHL is a prospective cohort study, baseline cross-sectional data were used to determine OHL levels in a population attending WIC clinics. To qualify for the WIC program, caregivers and children must have an income below 185% of the federal poverty level and exhibit one of several health and nutritional risk factors. Non random WIC sites were selected in sites selected using the following criteria 1) geographic region, 2) rural/urban makeup, 3) population demographics, 4) very active WIC clinics and 5) established working relationship with investigators. The study was approved by the Biomedical Institutional Review Board at the University of North Carolina at Chapel Hill.
To be eligible for the study, the infant/child had to be healthy (ASA I or II) and less than 60 months of age (five years or younger) and accompanied by the primary caregiver to a WIC appointment. Children had to be eligible for or enrolled in the Medicaid program to allow for follow-up using Medicaid claims data for subsequent investigations. All caregivers had to be 18 or older to participate. Because the instrument used to measure OHL has been validated only in English, all caregivers were English-speaking.
A written consent was obtained prior to the interview. To ensure that each participant, regardless of his/her literacy level, understood and was willing to participate in the study, the consent form was read to all participants and written consent was obtained at the time of the questionnaire interview. Finally, for eligible dyads, the caretakers who agreed to participate completed an in-person survey that was administered orally by a trained research assistant.
All structured interviews were conducted by two trained interviewers. These interviewers underwent two trainings sessions using a recorded message from one dentist experienced at using the REALD-30. Following training session #1, 5 pilot subjects were interviewed using REALD-30 and discussed at training sessions #2.
Interviewers were deployed in designated sites in the WIC clinic and actively invited patients to participate as follows: Consecutive WIC caregivers were approached in the waiting area and asked if they would answer eight questions from the COHL eligibility screening form. If it was determined that the caregiver was eligible and agreed to participate, the caregiver was accompanied to a private area to complete the 30-minute interview.
Data were collected in 5 domains: socio-demographic information, dental health and behavior, oral health impact profile, self-efficacy, and oral health literacy. Following the interview, the participating caregivers were given a gift certificate of $20 value for their participation in the study.
Demographic information included gender, age, race, ethnicity, educational attainment, marital status, and number of children. Age was measured in years and was coded as a quintile categorical variable. Race was coded according to five categories: White, African American (AA), American Indian or Alaskan Native (AI), Asian, and unknown. Ethnicity was measured as Hispanic/Latino, non-Hispanic/non-Latino, and unknown. Education was coded as a four level categorical variable: “1: did not finish high school,” “2: high school or GED,” “3: some technical education or some college,” and “4: college or higher education.” Dental use was self-reported as time since the last dental visit, and was coded as a four-level categorical variable where 1:<1 year, 2:12–23 months, 3:2–5 years, 4:>5 years or never. We also collected information on the participants’ general health status and oral health status using self completed questions taken from the National Health and Nutrition Examination Survey.
We measured oral health literacy using a newly developed instrument, the Rapid Estimate of Adult Literacy in Dentistry, called REALD-30 (16). This previously validated word recognition test has demonstrated good psychometric properties (16). It includes 30 dentally-related words arranged in order of increasing difficulty. Using the REALD-30, the words were read aloud by the adult to the interviewers. To score REALD-30 one point is given to each word pronounced correctly and then summed to get an overall score. The score has a possible range of 0 (lowest literacy) to 30 (highest literacy).
All analyses were conducted using Stata 11.1 (StataCorp LP, College Station, TX). Descriptive statistics and graphics were used to explore the distribution of participants’ demographic characteristics and OHL using REALD-30 scores. The normality assumption for OHL score was tested by a combined skewness and kurtosis evaluation test (24) using the p<0.05 criterion. The linearity assumption for covariates was evaluated graphically by plotting the corresponding mean REALD-30 score for covariate categories and confirmed with formal tests of linearity (Wald X2; α=0.05).
A Pearson’s correlation coefficient (ρ) was obtained to determine the association between OHL scores and education level. Tabular and graphical methods were employed to investigate the patterns of association between OHL, education and race, by stratification. To evaluate homogeneity of OHL across strata of covariates, we performed Wald X2 tests and obtained corresponding P-values of stratum-specific coefficient equality. Based on multiple linear regression analysis, multivariate modeling was used to test whether racial differences persisted in the studied population, after adjustment for confounders, using α=0.05. Covariates included in the modeling were age, county of residence, and education level. Inclusion of additional confounders (Hispanic ethnicity, marital status, number of children, and dental use) in the final model was determined by likelihood ratio tests, comparing nested (reduced) models with the referent (full) model, using the p<0.1 criterion.
RESULTS
Of the 1,658 subjects eligible, 1,405 (85%) participated and completed the interviews. For the purposes of the present analysis we excluded participants whose primary language was not English (N=79 or 6% of the total sample), male caregivers (N=49 or 3%) and those of Asian race (N=12 or 1% of the total sample). Due to small numbers in other racial groups, Hispanic ethnicity is reported for Whites only (n=40, 3.1% of total). The demographic characteristics of our analysis sample (N=1,280) are presented in Table 1 with the corresponding REALD-30 distribution characteristics. The distribution of OHL (REALD-30) scores did not depart substantially from normality (χ2=1.55, DF=2, p>0.05) and had mean of 15.8 (SD=5.3), median of 16, and a range of 0–30 (Figure 1). The mean OHL scores of Whites, AA, and AI are 17.4 (SE=0.2), 15.3 (SE=0.2), and 13.7 (SE=0.3), respectively, revealing significant differences. Among Whites, Hispanic ethnicity showed no important association with OHL, with the mean OHL scores of Hispanic Whites and non-Hispanic Whites being 17.8 (SE=0.9) and 17.4 (SE=0.2), respectively. The relationship between OHL and education level did not violate the linearity assumption (χ2=1.52, DF=2, p>0.05) and, as expected, the two measures were positively correlated (ρ=0.42). Figure 2 illustrates the distribution of REALD-30 mean scores for combined strata of race and education where these patterns of association persisted. Moreover, participants in the lowest age quintile had more than 2 points lower OHL scores compared to the three highest quintiles. The final model to obtain adjusted mean OHL differences and 95% confidence intervals (CI) for racial groups included terms for age, education, county of residence, and Hispanic ethnicity. Model coefficients are presented in Table 2. While adjusting for all covariates, Whites had a significantly higher adjusted OHL score with a mean difference of 2.0 (95% CI=1.4, 2.6). American Indians had virtually identical OHL scores with African Americans.
Table 1.
Distribution of REALD-30 scores by demographic characteristics of the COHL study participants.
| N | (%) | REALD-30 | |||
|---|---|---|---|---|---|
| Mean (SD) | Median | Range | |||
| County of residence | |||||
| Brunswick | 31 | 2.4 | 17.4(5.9) | 17 | 3–28 |
| Buncombe | 119 | 9.4 | 16.9(4.8) | 17 | 4–27 |
| Burke | 110 | 8.7 | 17.0(4.4) | 17 | 4–27 |
| New Hanover | 263 | 20.8 | 16.7(5.3) | 17 | 1–28 |
| Orange | 115 | 9.1 | 15.8(4.7) | 15 | 4–28 |
| Robeson | 361 | 28.6 | 14.1(5.5) | 14 | 0–30 |
| Wake | 264 | 20.9 | 16.0(5.0) | 16 | 3–28 |
| Race | |||||
| White | 504 | 39.4 | 17.4(4.9) | 17 | 1–30 |
| African American | 522 | 40.8 | 15.3(5.1) | 15 | 2–30 |
| American Indian | 254 | 19.8 | 13.7(5.3) | 14 | 0–29 |
| Hispanic ethnicity (among whites) | |||||
| Yes | 40 | 8.0 | 17.8(5.5) | 17 | 5–28 |
| No | 463 | 92.0 | 17.4(4.8) | 17 | 1–30 |
| Education | |||||
| Did not finish high school | 306 | 23.9 | 13.0(4.8) | 13 | 1–26 |
| High school diploma of GED | 480 | 37.5 | 15.0(4.9) | 15 | 0–30 |
| Some technical or college training | 429 | 33.5 | 18.0(4.7) | 18 | 4–30 |
| College degree or higher | 65 | 5.1 | 20.1(4.8) | 21 | 11–29 |
| Marital status | |||||
| Single | 859 | 67.4 | 15.2(5.1) | 15 | 0–30 |
| Married | 294 | 23.1 | 17.3(5.3) | 17 | 1–29 |
| Separated/Divorced | 122 | 9.6 | 16.8(5.6) | 16 | 3–28 |
| Number of children | |||||
| 1 | 461 | 39.8 | 15.9(5.3) | 16 | 0–30 |
| 2 | 371 | 32.0 | 15.9(5.1) | 16 | 1–28 |
| 3 | 192 | 16.6 | 15.7(5.5) | 16 | 2–29 |
| 4+ | 135 | 11.6 | 15.0(5.7) | 15 | 3–29 |
| Dental attendance (last dental visit) | |||||
| <12months | 728 | 57.2 | 15.8(5.2) | 16 | 0–29 |
| 12–23months | 217 | 17.0 | 16.1(5.6) | 16 | 1–30 |
| 2–5years | 177 | 13.9 | 15.8(5.6) | 16 | 3–30 |
| 5+ years | 151 | 12.9 | 15.4(4.7) | 15 | 2–27 |
| Mean(SD) | |||||
| Age (years) range: 17.2, 65.6 | 1280 | 26.5(6.9) | |||
| Q1 range: 17.2, 20.9 | 255 | 19.5(0.8) | 14.2(4.8) | 15 | 1–30 |
| Q2 range: 20.9, 23.4 | 256 | 22.1(0.7) | 15.5(5.2) | 15 | 1–28 |
| Q3 range: 23.4, 26.5 | 256 | 24.8(0.9) | 16.5(4.9) | 16 | 2–30 |
| Q4 range: 26.5, 30.9 | 259 | 28.6(1.3) | 16.3(5.0) | 16 | 0–29 |
| Q5 range: 30.9, 65.6 | 254 | 37.7(6.0) | 16.6(6.0) | 17 | 2–29 |
Row totals may not add to total due to missing values
Figure 1.

Figure 2.
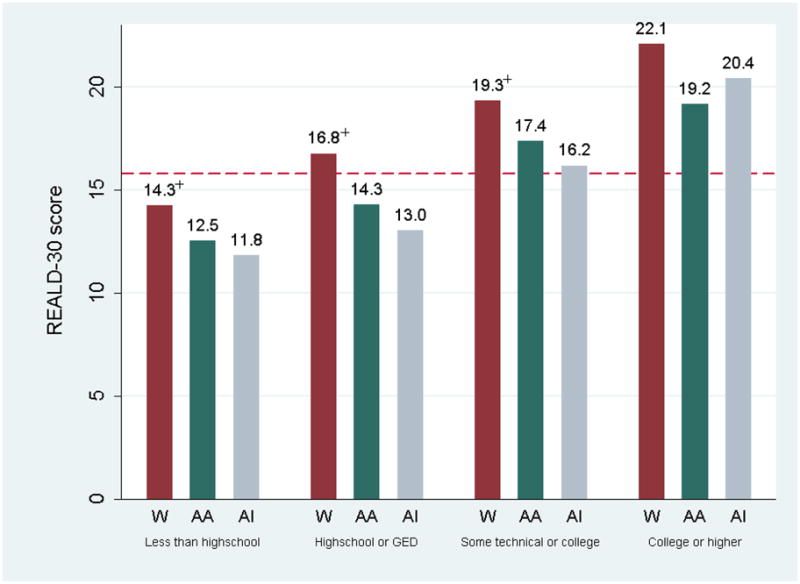
Table 2.
Multiple linear regression model (no intercept) coefficients of OHL (REALD-30) score on socio-demographic variables.
| Model coefficient | 95% CI | P-value† | |
|---|---|---|---|
| Race | <0.05 | ||
| Whites | 22.5* | 20.6, 24.5 | |
| African Americans | 20.5* | 18.5, 22.6 | |
| American Indian | 20.3* | 18.2, 22.5 | |
| Education | <0.05 | ||
| College degree or higher | Referent | . | |
| Some technical or college training | −2.4 | −3.6, −1.2 | |
| High school diploma of GED | −5.2 | −6.5, −4.0 | |
| Did not finish high school | −7.1 | −8.4, −5.8 | |
| Hispanic ethnicity | 0.06 | ||
| No | Referent | . | |
| Yes | 1.2 | −0.1, 2.4 | |
| Age (quintiles) | 0.52 | ||
| Q1 | −0.2 | −1.1, 0.6 | |
| Q2 | 0.1 | −0.7, 0.9 | |
| Q3 | 0.5 | −0.3, 1.3 | |
| Q4 | 0.2 | −0.6, 1.0 | |
| Q5 | Referent | . | |
| County of residence | 0.16 | ||
| Brunswick | Referent | . | |
| Buncombe | −1.0 | −2.8, 0.8 | |
| Burke | −1.0 | −2.8, 0.8 | |
| New Hanover | −0.6 | −2.4, 1.1 | |
| Orange | −1.3 | −3.2, 0.5 | |
| Robeson | −1.9 | −3.7, −0.1 | |
| Wake | −1.0 | −2.8, 0.7 |
denotes that the model intercept (constant) has been incorporated in the race-specific model coefficient.
P-values correspond to global Wald X2 tests of equality of coefficients within strata of the five socio-demographic covariates.
DISCUSSION
This investigation is the first to report large non care seeking based estimates for OHL. Maintaining good oral health requires an individual to understand and act on health information, whether communicated verbally or in written form. Although little research has been undertaken to examine oral health literacy (OHL) levels, ample justification exists for pursuing research in this area. We found that that the average OHL in our study to be a mean of 15.8 (SD=5.3). Although no cut-off points have yet been established for the REALD-30 to determine what score would indicate inadequate OHL, this estimate is lower than what has been previously reported in other investigations using the same instrument. Using REALD-30, Jones and colleagues (25) examined the OHL literacy levels among patients in a private dental office and reported a mean 23.9 (SD=1.3). Lee and colleagues (16) investigated OHL levels among in patients an outpatient medical clinic using the same instrument, finding a mean score of 19.8 (SD=6.4). Recently, Miller and colleagues (26) reported a mean score of 20.7 (SD=5.5) among a sample seeking dental care in a university setting (Figure 1).
There are several potential explanations for these reported differences. First, unlike the present investigations, the three aforementioned ones relied upon patient data obtained from dental and medical clinics. It is possible that these patients were higher users of health care, and being able to navigate the health system and access care had higher OHL. These patients may be different from those who have not sought medical/dental care previously and thus may be more informed about oral health. Second, our sample was taken from a low-income population who are eligible for Medicaid and WIC. Evidence has shown that lower SES populations tend to have lower literacy scores.
Our descriptive and analytical results point out that there are significant differences in OHL levels among racial groups. We found significant racial differences in OHL scores. In our multivariate model, Whites had a substantially higher adjusted OHL score: mean difference (95% CI): 2.0 (1.4, 2.6). AIs had a slightly lower OHL, but not significantly different scores versus African Americans (AA) with a mean difference (95% CI) of −0.2 (−1.1, 0.7). These results are consistent with published findings in the medical health literacy literature. Both education level and AA have been associated with higher rates of inadequate health literacy (27). AAs were more likely to have lower literacy scores in the NALS (28) and in studies of health literacy among Medicare enrollees (29–31).
It should be noted that the meaning of race in health research has been challenged (32) and some question the appropriateness of examining racial differences in health. They argue that race is an arbitrary system of visual classification without biological merit, and that demarcations by race largely reflect racism in our society. Though racial classification is imprecise and often based on self-identification, there is some utility in describing racial differences in health care outcomes. This allows targeting of health improvement programs toward populations most in need (32). While racial differences in health literacy have been reported in the medical context (23,29,33,34), this investigation is the first to report racial differences in OHL levels.
The results should be considered in light of the study’s limitations. The data were collected from a non-probability convenience sample of clients from the NC-WIC clinics. Our sample characteristics prevent generalization of results beyond female caregivers enrolled in WIC and attending the specific clinics in NC during the time of this study. Future work should draw from a population-based probability sample. At the same time, our results add to the knowledge base of health literacy and provide insights into in the dimension of OHL in relation to race, education, and socio-demographic characteristics. Despite being non-modifiable, these characteristics can provide data for studying health-related knowledge, behaviors and practices, as well as for targeting interventions to those being at risk for low OHL.
REALD-30 has been validated in English only, so our recruitment was limited to English-speaking patients. Also, our measurement of OHL is based on a word recognition test. While word recognition instruments measure only selected aspects of literacy skills and are not comprehensive, comparable word recognition instruments have been used with success in medicine and they are strongly correlated with reading fluency. Our initial investigations tested the REALD-30 against a dental functional health literacy test and found a high correlation between the two (15). Because the reading comprehension test takes 22 minutes to complete, we choose the word recognition test because it takes on two minutes to complete which makes it easier to complete and take less of the interviewees’ time. Mispronunciation may be considered an inherent limitation of a word recognition instrument such as the REALD-30. Although, we did not look into the mispronunciation patterns as part of this current investigation, we have conducted item response theory analytical techniques and other psychometric analysis and found that there were no differences by race indicating that our results showed that the REALD-30 may actually reflect other sociobehavioral factors that the instrument was not sensitive enough to detect on its own. More research is needed to understand these sociobehavioral factors to better understand the pathway in which oral health literacy is related to oral health outcomes.
To date, at least five instruments have been developed to measure oral health literacy (OHL): 1) Rapid Estimate of Adult Literacy in Dentistry-30 (16), 2) Rapid Estimate of Adult Literacy in Dentistry-99 (17), 3) Test of Functional Health Literacy in Dentistry (15), 4) Oral Health Literacy Instrument (18) and 5) Rapid Estimate of Adult Literacy in Medicine and Dentistry (19). One additional instrument measures oral health knowledge in the context of dental health literacy (35). Although all of the instruments have promising characteristics, none have been able to set thresholds for what level of oral health literacy is needed to adequately maneuver the dental health care system. Clinical relevance of score differences has yet to be determined with all the current instruments and it is therefore, unknown what level of OHL would be required to effectively navigate through the health care system. With our data we aspire to provide the foundation for the development of such thresholds. We also acknowledge that “minimally clinically important” differences in scores are limited in their ability to convey all the information (36). It is likely that a six-point difference on the upper end of the scale (24 versus 30) is “less important” than a three point difference in the middle-low range (17 versus 14). We anticipate reporting on the aspect of thresholds and “clinically significant differences” with further work on this area.
Although our subjects were recruited from a non-probability (convenience) sample of NC-WIC caregivers and thus may have limited generalizability to other populations, we feel that this population is a very important one to examine. WIC was established by the Food and Nutrition Services of the Department of Agriculture (USDA) to target low-income women, infants, and children who are at risk nutritionally. WIC has a huge reach, serving over 8.7 million individuals annually (37) and over a third of all infants born in the U.S. today. WIC is often the first contact with the healthcare system for many poor women and children. The goal of the WIC program is to improve the health outcomes of its participants by providing nutritious foods, nutritional education, counseling, and medical and dental referrals as adjuncts to good health care during pregnancy, the postpartum period, infancy, and early childhood. Because of its repeated contact with vulnerable populations, WIC is uniquely positioned to identify families with low OHL.
The identification of patients with low oral health literacy can alert health care providers to the possibility that these families may have difficulty with printed educational materials. Patients who score very poorly on a health literacy test may also have trouble with oral provider-patient communication, so special efforts can be taken to develop culturally sensitive educational multimedia, involve lay health educators in the communication with low dental health literacy patients, and improve providers’ communication abilities.
To date, research in OHL has been based on a small number of studies of subjects seeking care. Our investigation is the first to report OHL in a community based sample. Millions of Americans suffer from oral disease, with the minority and the poor being disproportionately affected. Future research should explore the relationship of OHL on health behavior and health outcomes. Our findings establish the need for addressing OHL in the WIC population and set the stage for potential oral health literacy interventions. Additional, future studies should examine effective social cognitive approaches to tailor messages during counseling sessions that can assist this population to overcome barriers in health literacy.
Acknowledgments
Research supported by grant from the National Institute of Dental and Craniofacial Research NIDCR Grant # # RO1DE018045.
Footnotes
Disclosures: None of the authors has any financial interest related to the article.
Disclaimers: The views expressed in the article are those of the authors and do not necessarily reflect the views of the National Institute of Dental and Craniofacial Research or the University of North Carolina at Chapel Hill
References
- 1.Kutner M, Greenburg E, Jin Y, Paulsen C. The health literacy of America’s adults: Results from the 2003 national assessment of adult literacy (NCES 2006–483) U.S. Department of Education; Washington, DC: National Center for Education; 2006. [Google Scholar]
- 2.Baker DW, Parker RM, Williams MV, Clark WS, Nurss J. The relationship of patient reading ability to self-reported health and use of health services. Am J Public Health. 1997;87(6):1027–30. doi: 10.2105/ajph.87.6.1027. [DOI] [PMC free article] [PubMed] [Google Scholar]
- 3.Baker DW, Parker RM, Williams MV, Clark WS. Health literacy and the risk of hospital admission. J Gen Intern Med. 1998;13(12):791–8. doi: 10.1046/j.1525-1497.1998.00242.x. [DOI] [PMC free article] [PubMed] [Google Scholar]
- 4.Williams MV, Baker DW, Parker RM, Nurss JR. Relationship of functional health literacy to patients’ knowledge of their chronic disease. A study of patients with hypertension and diabetes. Arch Intern Med. 1998;158(2):166–72. doi: 10.1001/archinte.158.2.166. [DOI] [PubMed] [Google Scholar]
- 5.Parker RM, Baker DW, Williams MV, Nurss JR. The test of functional health literacy in adults: a new instrument for measuring patients’ literacy skills. J Gen Intern Med. 1995;10(10):537–41. doi: 10.1007/BF02640361. [DOI] [PubMed] [Google Scholar]
- 6.Williams MV, Parker RM, Baker DW, Parikh NS, Pitkin K, Coates WC, et al. Inadequate functional health literacy among patients at two public hospitals. Jama. 1995;274(21):1677–82. [PubMed] [Google Scholar]
- 7.Parker RM, Williams MV, Baker DW, Nurss JR. Literacy and contraception: exploring the link. Obstet Gynecol. 1996;88(3 Suppl):72S–77S. doi: 10.1016/0029-7844(96)00250-5. [DOI] [PubMed] [Google Scholar]
- 8.Dewalt DA, Berkman ND, Sheridan S, Lohr KN, Pignone MP. Literacy and health outcomes: a systematic review of the literature. J Gen Intern Med. 2004 Dec;19(12):1228–39. doi: 10.1111/j.1525-1497.2004.40153.x. [DOI] [PMC free article] [PubMed] [Google Scholar]
- 9.Roter DL, Rudd RE, Comings J. Patient literacy. A barrier to quality of care. J Gen Intern Med. 1998;13(12):850–1. doi: 10.1046/j.1525-1497.1998.00250.x. [DOI] [PMC free article] [PubMed] [Google Scholar]
- 10.Baker DW, Gazmararian JA, Williams MV, Scott T, Parker RM, Green D, et al. Functional health literacy and the risk of hospital admission among Medicare managed care enrollees. Am J Public Health. 2002;92(8):1278–83. doi: 10.2105/ajph.92.8.1278. [DOI] [PMC free article] [PubMed] [Google Scholar]
- 11.Weiss BD, Palmer R. Relationship between health care costs and very low literacy skills in a medically needy and indigent Medicaid population. J Am Board Fam Pract. 2004 Jan–Feb;17(1):44–7. doi: 10.3122/jabfm.17.1.44. [DOI] [PubMed] [Google Scholar]
- 12.National Institute of Dental and Craniofacial Research, National Institute of Health, U.S. Public Health Service, Department of Health and Human Services. The invisible barrier: Literacy and its relationship with oral health. A report of a workgroup sponsored by the national institute of dental and craniofacial research, national institute of health, U.S. public health service, department of health and human services. J Public Health Dent. 2005 Summer;65:174–82. doi: 10.1111/j.1752-7325.2005.tb02808.x. [DOI] [PubMed] [Google Scholar]
- 13.Alexander RE. Readability of published dental educational materials. J Am Dent Assoc. 2000;131(7):937–42. doi: 10.14219/jada.archive.2000.0312. [DOI] [PubMed] [Google Scholar]
- 14.Chung V, Horowitz AM, Canto MT, Siriphant P. Oral cancer educational materials for the general public. J Public Health Dent. 2000;60(1):49–52. doi: 10.1111/j.1752-7325.2000.tb03292.x. [DOI] [PubMed] [Google Scholar]
- 15.Gong DA, Lee JY, Rozier G, Pahel BT, et al. Development and testing of the Test of Functional Health Literacy in Dentistry (TOFHLiD) J Public Health Dent. 2007;67:105–12. doi: 10.1111/j.1752-7325.2007.00023.x. [DOI] [PubMed] [Google Scholar]
- 16.Lee JY, Rozier RG, Lee SY, Bender D, Ruiz RE. Development of a word recognition instrument to test health literacy in dentistry: The REALD-30--a brief communication. J Public Health Dent. 2007;67:94–8. doi: 10.1111/j.1752-7325.2007.00021.x. [DOI] [PubMed] [Google Scholar]
- 17.Richman JA, Lee JY, Rozier RG, Gong D, Pahel BT, Vann WF., Jr Evaluation of a Word Recognition Instrument to test Health Literacy in Dentistry: the REALD-99. J Pub Health Dent. 2007;67(2):99–104. doi: 10.1111/j.1752-7325.2007.00022.x. [DOI] [PubMed] [Google Scholar]
- 18.Sabbahi D, Lawrence HP, Limeback H, Rootman I. Development and evaluation of an oral health literacy instrument for adults. Community Dent Oral Epidemiol. 2009;37:451–462. doi: 10.1111/j.1600-0528.2009.00490.x. [DOI] [PubMed] [Google Scholar]
- 19.Atchison KA, Gironda MW, Messadi D, Der-Martirosian C. Screening for oral health literacy in an urban dental clinic. J Public Health Dent. 2010 Jun 2; doi: 10.1111/j.1752-7325.2010.00181.x. [DOI] [PMC free article] [PubMed] [Google Scholar]
- 20.Dye BA, Tan S, Smith V, Lewis BG, Barker LK, Thornton-Evans G, Eke PI, Beltrán-Aguilar ED, Horowitz AM, Li CH. Trends in oral health status: United States, 1988–1994 and 1999–2004. Vital Health Stat. 2007 Apr;11(248):1–92. [PubMed] [Google Scholar]
- 21.Vargas CM, Crall JJ, Schneider DA. Sociodemographic distribution of pediatric dental caries: NHANES III, 1988–1994. [see comments] J Am Dent Assoc. 1998;129(9):1229–38. doi: 10.14219/jada.archive.1998.0420. [DOI] [PubMed] [Google Scholar]
- 22.United States Department of Health and Human Services. Oral Health in America: A Report of the Surgeon General. Rockville, MD: Department of Health and Human Services, National Institute of Dental and Craniofacial Research, National Institutes of Health; 2000. [Google Scholar]
- 23.Howard DH, Sentell T, Gazmararian JA. Impact of health literacy on socioeconomic and racial differences in health in an elderly population. J Gen Intern Med. 2006 Aug;21(8):857–61. doi: 10.1111/j.1525-1497.2006.00530.x. [DOI] [PMC free article] [PubMed] [Google Scholar]
- 24.D’Agostino RB, Balanger A, D’Agostino RB., Jr A suggestion for using powerful and informative tests of normality. American Statistician. 1990;44:316–321. [Google Scholar]
- 25.Jones M, Lee JY, Rozier RG. Oral health literacy among adult patients seeking dental care. J Am Dent Assoc. 2007;138:1199–1208. doi: 10.14219/jada.archive.2007.0344. [DOI] [PubMed] [Google Scholar]
- 26.Miller EK, Lee JY, DeWalt DA, Vann WF., jr The Impact of Caregiver Health Literacy on Children’s Oral Health Outcomes. Pediatrics. doi: 10.1542/peds.2009-2887. (in press) [DOI] [PMC free article] [PubMed] [Google Scholar]
- 27.Andrus MR, Roth MT. Health literacy: a review. Pharmacotherapy. 2002 Mar;22(3):282–302. doi: 10.1592/phco.22.5.282.33191. [DOI] [PubMed] [Google Scholar]
- 28.Kircsh I, Jungeblut A, Jenkins L, Kolstad A. Adult Literacy in America: a first look at the findings of the National Adult Literacy Survey. Washington DC: US Department of Education; 1993. [Google Scholar]
- 29.Gazmararian JA, Baker DW, Williams MV, Parker RM, Scott TL, Green DC, et al. Health literacy among Medicare enrollees in a managed care organization. JAMA. 1999 Feb 10;281(6):545–51. doi: 10.1001/jama.281.6.545. [DOI] [PubMed] [Google Scholar]
- 30.Cho YI, Lee SYD, Arozullah AM, Crittenden KS. Effects of health literacy on health status and health service utilization. Soc Sci & Med. 2008;66:1809–1816. doi: 10.1016/j.socscimed.2008.01.003. [DOI] [PubMed] [Google Scholar]
- 31.Lee SYD, Cho YI, Arozullah AM, Crittenden KS, Vicencio D. Health literacy, social support, and health status among Medicare enrollees in an inner-city area. Educational Gerontology. 2009;35(3):191–201. [Google Scholar]
- 32.Soo-Jin Lee S, Mountain J, Koenig BA. The Meanings of “Race” in the New Genomics: Implications for Health Disparities Research. Yale Journal of health policy, law, and ethics. 2005:33–75. [PubMed] [Google Scholar]
- 33.Sarkar U, Fisher L, Schillinger D. Is self-efficacy associated with diabetes self-management across race/ethnicity and health literacy? Diabetes Care. 2006 Apr;29(4):823–9. doi: 10.2337/diacare.29.04.06.dc05-1615. [DOI] [PubMed] [Google Scholar]
- 34.Bennett CL, Ferreira MR, Davis TC, Kaplan J, Weinberger M, Kuzel T, Seday MA, Sartor O. Relation between literacy, race, and stage of presentation among low-income patients with prostate cancer. J Clin Oncol. 1998 Sep;16(9):3101–4. doi: 10.1200/JCO.1998.16.9.3101. [DOI] [PubMed] [Google Scholar]
- 35.Macek MD, Haynes D, Wells W, Bauer-Leffler S, Cotten PA, Parker RM. Measuring conceptual health knowledge in the context of oral health literacy: preliminary results. J Public Health Dent. 2010 Mar 10; doi: 10.1111/j.1752-7325.2010.00165.x. [DOI] [PMC free article] [PubMed] [Google Scholar]
- 36.Hays RD, Woolley JM. The concept of clinically meaningful difference in health-related quality-of-life research. How meaningful is it? Pharmacoeconomics. 2000 Nov;18(5):419–23. doi: 10.2165/00019053-200018050-00001. [DOI] [PubMed] [Google Scholar]
- 37.United States Department of Agriculture, Food and Nutrition Services. [Accessed 8/5/2010]; Website http://www.fns.usda.gov/wic/