

Abstract
Background
It is becoming increasingly important to study common and distinct etiologies, clinical and pathological features, and mechanisms related to neurodegenerative diseases such as Alzheimer’s disease (AD), Parkinson’s disease (PD), amyotrophic lateral sclerosis (ALS), and frontotemporal lobar degeneration (FTLD). These comparative studies rely on powerful database tools to quickly generate data sets which match diverse and complementary criteria set by the studies.
Methods
In this paper, we present a novel Integrated NeuroDegenerative Disease (INDD) database developed at the University of Pennsylvania (Penn) through a consortium of Penn investigators. Since these investigators work on AD, PD, ALS and FTLD, this allowed us to achieve the goal of developing an INDD database for these major neurodegenerative disorders. We used Microsoft SQL Server as the platform with built-in “backwards” functionality to provide Access as a front-end client to interface with the database. We used PHP hypertext Preprocessor to create the “front end” web interface and then integrated individual neurodegenerative disease databases using a master lookup table. We also present methods of data entry, database security, database backups, and database audit trails for this INDD database.
Results
We compare the results of a biomarker study using the INDD database to those using an alternative approach by querying individual database separately.
Conclusions
We have demonstrated that the Penn INDD database has the ability to query multiple database tables from a single console with high accuracy and reliability. The INDD database provides a powerful tool for generating data sets in comparative studies across several neurodegenerative diseases.
Keywords: Database, Neurodegenerative Disease, Microsoft SQL, Relational Neurodegenerative Disease Database
1. Introduction
Aging related neurodegenerative diseases such as Alzheimer’s disease (AD), Parkinson’s disease (PD), amyotrophic lateral sclerosis (ALS), and frontotemporal lobar degeneration (FTLD) are increasing in prevalence with the rising longevity of populations in most countries across the globe. For example, members of the “baby boomer” generation in the United States (i.e. all those born between 1946 to 1964) began turning 60 as of January, 2006, and, in 2011, they will begin to turn 65 years old [1]. Notably, AD increases exponentially after age 65 with its prevalence doubling every 5 years [1]. However, increasing evidence shows that AD and most other neurodegenerative diseases (including PD, FTLD and ALS) share similar types of hallmark pathologies (e.g. disease specific protein aggregates) and there is overlap in the clinical features of these disorders. For example, Neumann et al. [2] showed that TDP-43 is the disease protein in both ALS and FTLD, but it is known that TDP-43 pathology occurs in PD and AD, as well as other disorders to a variable extent [3, 4]. Thus, it is critical that we conduct multidisciplinary patient-oriented clinical and basic science research comparatively and in a multidimensional manner to improve the understanding and treatments of AD, PD, FTD, ALS and other aging-related neurodegenerative disorders. Moreover, advances in one of these disorders could accelerate the pace of advances for other of these diseases. To achieve this goal, it is essential to build an overarching Integrated NeuroDegenerative Disease (INDD) database that includes multiple neurodegenerative disorders such as AD, PD, FTD, ALS and other related diseases. Specifically, using this neurodegenerative disease database as a research tool, investigators would be able to obtain data across several disease groups and conduct comparative studies to elucidate distinct and common features and mechanisms of these disorders.
In this paper, we describe a novel neurodegenerative disease database that we have developed at the University of Pennsylvania (Penn) through a consortium of Penn investigators working collaboratively on AD, PD, FTLD and ALS. In the Methods section, we describe the technical details of building this relational neurodegenerative disease database. In the Results section, we present snapshots of the database, provide detailed information regarding what types of data the database captured, and compare the results of a biomarker study using the INDD database to those using an alternative approach by querying individual database separately. In the Discussion section, we consider the advantages, limitations, challenges, and benefits of constructing the INDD database. We provide the development costs and the anticipated cost savings. We also discuss how this technology will aid in new discoveries, our future development plans, and the potential impact in neurodegenerative disease research.
2. Methods
We first provide a flow-chart indicating the steps and timelines of building the INDD database (Table 1). We then elaborate these steps in the following subsections.
Table 1.
Flow Chart of Steps in Building the INDD Database
|
Step 1: Preparation and meeting to discuss criteria of INDD database
From the inception of database implementation, in which paper forms used for data capture were converted to electronic databases, each individual neurodegenerative disease research group at Penn that had unique focuses in AD, PD, FTLD or ALS employed locally-housed databases. These databases were comprised of various database platforms and technologies, and ranged from group accessible Microsoft Access [5] databases and single-user Microsoft Excel spreadsheets to more complex SPSS files and FileMaker databases (SPSS Inc, Chicago, IL). In 2006, the leaders of these different disease-centered research groups at Penn embarked on a joint, consensus-driven effort to create a single Penn INDD database. The most mature database at the time was developed through the National Institute of Aging funded Alzheimer’s Disease Core Center (ADCC), and the first step in creating a single comprehensive database was to determine common technologies and methods that could be used for converting the individual databases into a new integrated database.
The first stage of conceptualizing the integrated database required two initial criteria that had to be addressed by each neurodegenerative disease research group or center prior to the launch of the INDD database project. The first criterion was that the new database had to be “backwards” compatible with the older database. More specifically, this meant that all the data from the new database had to have an ability to export to Excel files and then be accessible and queryable using the Access interface, as some of the centers were accustomed to using an Access database.
The second criterion was that locally assigned patient identification numbers (IDs) were not to be altered. Each individual center’s patient IDs were linked and utilized on various paper charts and patient samples, including biomarker samples, since requiring each center to renumber all patients and related items was deemed an ineffective strategy.
Step 2: Selecting backend to meet criterion 1: new database had to be “backwards” compatible with the old database
When deciding on the platform upon which to develop and implement the new database, both of the above criteria had to be taken into consideration, and the collective final decision was to implement INDD with the Microsoft SQL Server (MSSQL) [6]. In 2006, when this project was launched, MSSQL was a widely deployed relational database management system (RDBMS) with built-in backwards functionality to provide Access as a front-end client to interface with the database. While the primary user interface for the new integrated database is based on dynamic web-developed technologies, the MSSQL Server provided an easy implementation of backwards compatibility with Access to satisfy the first criterion.
Step 3: Determining the programming language to create the frontend
After selecting the “back end” RDBMS component, the next step was to determine the programming language to create the “frontend” web interface, and we decided to develop the new database using the PHP Hypertext Preprocessor (PHP) [7]. PHP is a widely deployed dynamic web language specifically created for developing web pages with flexible and powerful built-in functions that allow for quick access to a comprehensive online database. Along with PHP, other fundamental web technologies were employed to develop the database, such as JavaScript [8], Cascading Style Sheet (CSS) [9], HTML [10], and XML [11]. Building on top of the web technology foundation, several other modern technologies have also been employed, including Asynchronous JavaScript and XML (AJAX) [12], which is a combination of several technologies to create dynamic, user-friendly interfaces. In addition, jQuery [13] was utilized for rapid JavaScript development and an in-house built PHP framework geared toward the rapid development of patient-oriented database forms. The combination of these various technologies yielded powerful forms for accommodating various uses of the database.
Step 4: Integration of databases to meet criterion 2: locally assigned IDs were not to be altered
As stated above, the INDD server is comprised of four clinical core or disease – centered databases along with three supporting databases (Figure 1). The four clinical core databases (AD, PD, ALS, and FTD) were created prior to the integration, so the structures of the databases vary slightly from one disease-focused group or center to another by the means of data collection. While AD, PD, FTLD and ALS centers at Penn have their own unique center-specific IDs, it is entirely possible for a patient to be seen in multiple Penn centers. In this case, the patient will have several center-specific IDs. The three supporting databases are the bio-fluid database, neuropathology database and genetics database. These databases are comprised of their own specific IDs with ties to the clinical center IDs. All seven databases are linked by use of a master lookup table. Each unique individual added to any of the clinical databases will have a unique entry in this lookup table. When a new patient is requested in one of the clinical databases, the system will perform a lookup based on the patient’s name. The database will search for a similar-sounding name based on the built-in MSSQL function SoundEx [14]. By using SoundEx, similar sounding names are used to display already existing patients in the database. Once identified, the database displays a list of similar patients and prompts the user to choose an already-existing patient with the verification of the date of birth and address to form a patient linkage through a unique entry in the master lookup table. This allows different database users to be aware of the changes to a patient on the other databases. A special warning system is in place to generate alerts to the different clinical centers when patient information is updated from a separate center.
Figure 1.

Integrated Neurodegenerative Disease Database
While the database maintains the individual patients in an accurate state through a lookup table and global database IDs, when data are requested and queried from the database, overlapping IDs from different centers pose difficulties in identifying the individuals with ease and accuracy. To address this problem, the database automatically appends a prefix letter to distinguish between originating centers when we perform a multicenter query with a potential for overlapping patient IDs. For the four clinical centers, the individual IDs are identified with a composite ID constructed with a capital letter plus their Patient ID. The method used in this instance is the capital letter A for AD center, P for PD center, F for FTLD center, and M for ALS center.
The last segment for completion of the integrated system was incorporating the genetics database into the INDD database. The genetics database is unique in that it uses its own separate third-party database system called Progeny (Version 7, Progeny Software, LLC, South Bend, IN) which is designed especially for gathering and generating pedigrees from patient information housed in the database. Due to this advanced feature, we wanted to integrate our clinical database along with the Progeny database. Although Progeny is a closed source system, it allows access to the core database fields via open database connectivity (ODBC). Using the provided ODBC, we are able to select, insert, update and delete records to and from Progeny directly from our integrated database, thereby facilitating the integration of the genetics core with the clinical cores. This provided us the necessary ability to include genetic information in queries across the database and to have Progeny “push” genetic information into the clinical database so that clinicians cleared for access and having a validated credential can view patient genetic information. Because patient information and especially genetic information is highly confidential, a special genetics table was implemented with an extra security level. In addition to the standard researcher view group, a clinician view group was established, thereby allowing only the primary clinician of the patient to be able to view the genetic data. This along with a separation of the genetic data from the rest of the data in the INDD database ensures that only a few investigators with appropriate clearance are privileged to view sensitive genetic information.
Step 5: Building a rapid database development environment
When developing an in-house customized database, especially a web-based database from a blank slate, it is important to be able to rapidly develop forms that can be used by the researchers. A hybrid research and clinical database such as the INDD database requires new forms to be created in conjunction with new studies. For the purposes of code reusability and rapid database development, an in-house database framework has been specifically created for the Penn INDD database. The framework is flexible enough to accommodate the diverse formats of the individual forms while comprehensive enough for quick development with a uniform look and feel across the database and forms. The INDD framework is based on Model-View-Controller (MVC) architecture, where the framework is comprised of MSSQL for data or model, PHP as controller, as well as HTML and CSS for presentation or view. There are various instances of using AJAX for making direct database calls from JavaScript through PHP, thus preventing unpleasant refreshing of the web pages while creating more of the look and feel of a desktop application.
Step 6: Implementing a comprehensive database security system
Because we were developing a medical research database containing sensitive patient information, security was a priority of utmost importance. To prevent access by unauthorized users, data transmission employed encrypted tunnels, and several group-and user-level authorizations were implemented for data protection and authorization. The first layer of security, commonly called network layer security, is the initial line of defense against unauthorized activity. Network layer security is intended to position the database physically and logically in a secure location, thus minimizing the exposure of the database to unauthorized users and machines. The INDD database is located in a University of Pennsylvania Health System (UPHS) secured network infrastructure and data center. The UPHS data center is located within the Hospital of the University of Pennsylvania (HUP) and it houses all of the UPHS servers and data equipments. The data center is an environment-controlled, physically secured area that only allows authorized UPHS information technology (IT) personnel physical access to the servers. UPHS also provides a secure UPHS network, segregated from the Internet via a UPHS firewall and a secure network implementation. Access to the database is only possible while physically connected to the UPHS network or via Virtual Private Network (VPN) [15] access to the UPHS network. Because the database server is located in the UPHS data center at HUP and behind the UPHS firewall, the database has the same first tier level protection as the rest of the UPHS data (Figure 2).
Figure 2. System Layout of the INDD Database.
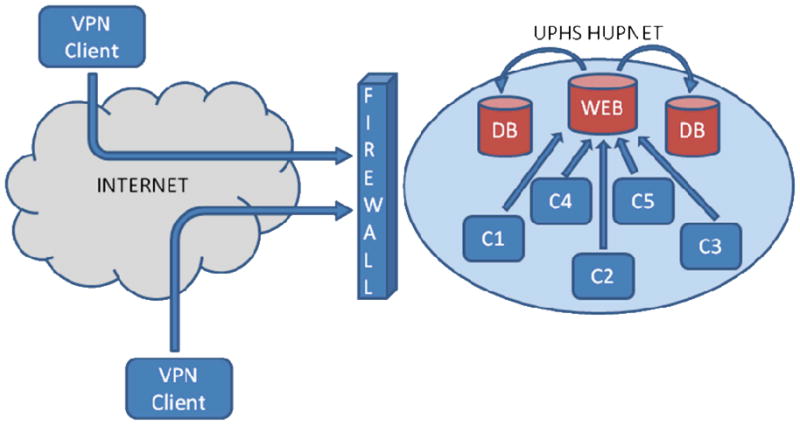
C1 – Client 1, C2 – Client 2, C3 – Client 3, C4 – Client 4, C5 – Client 5 DB – Database, Web – Web Server, VPN Client – Virtual Private Network Client, UPHS HUPNET - University of Pennsylvania Health System and Hospital of the University of Pennsylvania Network
The second layer of security implementation, also known as domain layer security, involves users being authenticated on the operating system or the machine level of the database. Since the MSSQL is a Microsoft product and the UPHS data center is built on top of Microsoft domain architecture, one must have a user name on the UPHS domain in order to properly access the database server on the domain level.
The next level of security implementation is database layer security. Even with proper credentials to the server, one must also obtain database level security approval in order to access the database. This layer provides admittance to the web-driven database along with globally defined table, and one can access the database by logging in using their database credential.
Once a user is authenticated to the main database container, each individual table and database form contains further security levels. Tables are configured with four data transaction operations: SELECT, INSERT, UPDATE and DELETE. Each table is associated with one or more groups, thus restricting access to tables based on the group membership of a given user. Users are associated with groups, and the groups are applied to each individual table with the above four data transaction operations. The security groups are divided into individual centers, and then into four different smaller subgroups: Principal Investigator (PI), Researcher, Data Entry and Read Only. The PI security level allows SELECT, INSERT and UPDATE operations on all center-specific tables, thereby allowing full control over the data fields. The researcher level allows SELECT, INSERT and UPDATE on a subset of the tables. The data entry level allows access to even smaller sets of tables designed for capturing data transcribed from paper. Read-only access allows users to view the permitted information but without the ability to make any modifications. None of the above security groups are allowed to delete records from the database; a special database administration group is in place to allow data deletions. This was implemented to prevent accidental data deletions and to encourage good data entry habits. The decision regarding who has access to the database is from a committee comprised of the co-authors and collaborators in the author list who decide collectively on access based on the qualifications of investigators requesting access and the nature of their project.
Data transmission between the server and the client is encrypted and secured using 128-bit Transport Layer Security (TLS) [15], also known as Secure Socket Layer cryptographic protocols. TLS prevents eavesdropping on the communication between the server and the client. This is the same security implemented by banks and other institutions with sensitive data communications.
The INDD database employs a stringent data security model to thwart and prevent unauthorized data access and to minimize accidental data modifications. On top of the technical security model, security protocols such as Health Insurance Portability and Accountability Act (HIPAA) and IT policies are in use for good practice and to encourage safe habits.
Step 7: Implementing database audit trails
An audit trail is one of the most important aspects of a reliable database. No matter how well the database is designed with proper access levels, data constraints and process handling, ultimately the end result is still controlled by and dependent on human actions. The best defense against human errors is to ensure that proper backup and audit trails are in place. The INDD database relies on the third-party product ApexSQL Logs software (ApexSQL LLC, Chapel Hill, NC) for Microsoft SQL Server 2005. ApexSQL Logs provide comprehensive up-to-date audit trail information based on built-in MSSQL logs. ApexSQL Logs parse the log files to determine the information to be presented with numerous filters incorporated. Because ApexSQL Logs perform audit trails based on an already-in-place process of MSSQL, it has no overhead performance degradation or any requirement for additional storage. Figure 3 is an ApexSQL screenshot displaying activities in the INDD database for selected days.
Figure 3.

ApexSQL Screenshot (Database Audit Screenshot)
Step 8: Implementing database backups
Along with the audit trail, the INDD database is also backed up using traditional database backups. The INDD database server is part of the UPHS enterprise backup system, and all information on the UPHS network, including the INDD database, undergo backup daily via an automated tape library system. Additionally, a separate database backup is performed on a weekly basis. This is primarily for information archiving and this backup is kept offsite in a permanent archive.
Step 9: Incorporating various data entry methods
In the INDD database, three different data entry methods are in use to accommodate different data and research needs. These data entries were done at each local clinic. The first method is paper form data entry; in this entry method, a database user enters the data via an electronic data entry form that links directly to the database. This paper-capturing method is used when a computer is not directly available for the data to be captured or if the situation does not warrant the use of a direct computer entry. The electronic data entry form mimics the look and feel of the paper forms, thus allowing for an easy transition from the paper to the database with minimal training and computer skill. The second data entry method allows for fast and accurate data entry by usage of dropdown numerical fields with number keypads along with tabs. This allows a trained data entry person to perform speedy data entry with relatively high accuracy based on our experiences. The downside of this method is that personnel must be trained on how to perform the data entry. The third data entry method is importation of data. There are times when the desired data are already stored in an Excel file or other delimited text files. When these files are to be imported to the database, we use an import function within the database. Data import allows existing data files to be directly transferred to the database, thereby bypassing user data entry. The benefit of this method is that data entry error is minimized because no human transcription is required. However, the downside of this method is that the file being imported must be predefined and correctly formatted, and an error could either halt the process altogether or incorrect data could be entered without the user’s knowledge.
Incorporating various data entry methods provides flexibility and usability to the database. Maximum efficiency can be achieved by selecting the data entry methods that are most suited to the situation at hand.
Step 10: Implementing quality control procedures
The Penn INDD database employs stringent data quality checks to ensure the accuracy and quality of the data. Double entry of randomly selected data enables us to monitor the quality of data entry using paper forms and we randomly select 10% of the original source records each quarter and perform a double data entry check. The double entry error rate is defined by the ratio of the total number of errors to the total number of data values doubly entered. While our goal is 100% accuracy, an error rate of <0.5% is acceptable in general; anything higher will initiate a review of the data entry procedures (e.g. checking if someone in particular is problematic with entry or the data entry form is poorly designed) and appropriate corrective action. Inconsistencies are reported immediately to the appropriate Core/Project Leader for resolution.
Other quality control procedures include a wide range of data checking via range checks, consistency checks to ensure that data entered in the database is consistent with the expected data, as well as missing value and cross form consistency checks. To assure these quality control procedures, we implement hard stops and soft stops in the data entry process. A hard stop prevents a user from entering the data value in the database if the value does not fit within the range or the type expected. A soft stop, on the other hand, allows a user to enter the data value in the database and save it. However, the database will flag the value as questionable and require a user or an administrator to go back and double check on the data entered. At that time, either the data can be corrected by the user or the warning can be cleared by an administrator.
The database has routine scheduled jobs for gathering and providing reports of missing and/or questionable data. This report is regularly emailed out to the end users ensuring proper communication of data correction. Along with data quality control, the database also has the ability to communicate with a third party reference for ensuring data accuracy. For example, the database communicates with the United States Postal Service (USPS) address verification server to ensure that addresses in the database, including doctor offices and patient addresses, are correct. Along with internal procedures and processes to ensure data accuracy and quality, the database is flexible enough to have modules for communicating with external sources as well.
Validation of the INDD database
Using the Penn-Pfizer collaborative biomarker study as an example, we compared our INDD database approach to a traditional database approach with separate and disjointed database containers. We compare the detailed steps involved in each method and present the advantages using the INDD database versus the other approach in the Result section.
3. Results
As discussed in the methods section, there are seven upstream databases within the INDD database: AD, PD, ALS, FTLD clinical databases as well as bio-fluid database, neuropathology database and genetics database. The INDD database contains measures in the areas of demographics, clinical assessment, neuropychological tests, imaging, pathology, bio-fluid, genetics, and clinical trials. Table 2 provides a summary of number of variables in each of these arrays and some key variables. As of July 27, 2010, there were a total of 460,000 observations (unique records) in the INDD database.
Table 2.
Summary of Data Fields and Arrays of the INDD database
| Array name | Number of variables | Key variables |
|---|---|---|
| Demographics | 731 | Education, Race, Gender |
| Clinical Assessment | 5830 | Diagnosis, Age of Onset |
| Neuropsychological Measures | 3333 | Mini Mental State Exam, Clinical Dementia Rating, Geriatric Depression Scale |
| Imaging | 341 | Volumetric Data, Imaging Diagnosis |
| Pathology | 646 | Neuropathology Diagnosis, Amygdala Tau, Middle Frontal Gyrus Tau |
| Bio-fluid | 389 | CSF t-tau, CSF p-tau, CSF Abeta |
| Genetics | 117 | APOE, MAPT |
| Clinical Trials | 8085 | Consent Date, Visit Date |
Note: CSF - cerebrospinal fluid
Since the inception of the INDD database, there have been many examples of its utility and benefit in data retrieval, analysis and research. This is most clearly illustrated by a recent series of biomarker targeted proteomic studies that were performed across all disease domains in the INDD including AD, PD, FTLD and ALS as reviewed recently by Hu et al. [16]. Since these studies included interrogation of ~1,500 bio-fluid samples from several hundred patients using a multiplex system to measure >150 analytes in each sample, it is hard to imagine how we could have completed these studies without using the Penn INDD. Thus, having a cross-disease database incorporating major neurodegenerative diseases (i.e., AD, PD, FTLD, ALS) along with bio-fluid samples, neuropathology and genetic information has conferred great advantages in the quantity and quality of neurodegenerative disease data sets at Penn. As summarized in the review by Hu et al [16], abundant data fields within the database, as well as compatible data fields from across neurodegenerative disease centers, provided us with the information that was needed to correlate these biomarker data with clinical features of the different disorders. Thus, these studies illustrate the exceptional data mining capabilities of the INDD database. Figure 4 provides an example of the INDD database interface with patient background and family history.
Figure 4.

INDD Database Interface Example
One of the best examples showcasing the advantages and strengths of the INDD database was a biomarker study conducted at Penn through the Penn-Pfizer Alliance in which 1500 plasma and cerebrospinal fluid (CSF) samples from patients with AD, PD, FTLD or ALS and normal controls (NC) were interrogated using the Rules Based Medicine, Inc. (RBM) human Discovery/MAP panel of 151 analytes configured for the multiplex Luminex platform. The study initially required queries of the INDD database to ensure Penn had the necessary data from the four clinical disease centers to match various study criteria, as well as the ability to locate and extract the corresponding plasma and CSF samples. The study criteria for selecting the cases required that a subject have had either a plasma or CSF sample drawn from one of the four clinical centers with emphasis on having both plasma (e.g., epidermal growth factor) and CSF biomarkers (e.g., CSF t-tau). Additionally, each patient was required to have had a full clinical evaluation performed and had psychometrics tests (e.g., MMSE), vitals (e.g., blood pressure), and medical history (e.g., stroke) gathered.
We compare and contrast two database methods to extract the data that satisfy the above criteria in the Penn-Pfizer collaborative biomarker study. We demonstrate below how two different database schemes differ in design yet arrive at the same results.
The first database method used to generate the data was the traditional database design with separate and disjointed database containers. In this design, each clinical center housed their own center data locally using their center-specific IDs. Among others, a bio-fluid database, a neuropathology database, and a genetics database were also implemented in their individual containers segregated from others. When performing the same data extraction required by the above criteria for the Penn-Pfizer biomarker study, each of the four clinical center’s databases were queried separately along with three supporting databases. Once the data were queried and the Excel data files were collected, the next step was to compare each of the files and ensure that no duplicate patients among different centers were found and then combine the four separate Excel files. In this post-processing of the data, one must carefully examine the data to ensure that no duplicate records are found and take extra care when combining the files. In this example, after querying the databases, the resulting dataset contained more than 5000 records, which had to be examined and stitched together during post-processing. In a large study like this biomarker study, the investigators commonly request either the data to be rerun with additional data fields or rerun in the future after additional data has been added to the database. With this method of separate databases and the need to perform post-processing of the data, the task of rerunning the data extraction is time consuming and challenging. All the steps of extracting and combining the data must be repeated for each instance, leaving room for human error and possible misrepresentation of the data.
The second method used to perform the data extraction was the INDD database method. Utilizing the INDD database and its capability of centralized jointed tables, a single query was crafted to join 13 separate tables using the criteria listed above. The query generated 1103 records with each row representing a unique patient with the data points spanned across the columns. This result was exported to Excel, formatted and annotated for each column header, then sent to the investigators for their analysis. In the event of rerunning the query, the INDD database stores previous executed queries in the database. Because the data extraction was performed via a single query, the query could be modified to contain the additional fields investigators were seeking or the same query could be rerun to update the records of the dataset.
In the above case study, one can clearly see the advantage of the INDD database versus the traditionally deployed databases. The reduction in time and effort in utilizing the INDD database enables researchers and data managers to focus their efforts elsewhere and eliminate the steps required by manual post-processing, greatly reducing the chances of error in the data. While the conclusions of the two datasets are identical, the two different approaches vary significantly in the time, effort and accuracy of the resulting dataset. Table 3 summarizes the key differences of the two database approaches.
Table 3.
Comparison between the INDD Database Approach and the Separated Database Approach
| INDD Database Approach | Separated Database Approach | |
|---|---|---|
| Initial data planning stage | 1. Determine the necessary data values to be included in the query. | 1. Determine the necessary data points to be included in the query. |
| Data identifying stage | 2. With a database administrator, identify the tables containing the data points. | 2. With a database administrator, identify the databases and tables containing the data points. |
| Data gathering and formatting for analysis | 3. Write a single query that pulls from multiple tables interconnected by a key master table. | 3. Write a separate query from the individual database; a total of four queries have to be written; output the result to an Excel or other delimited file format. 4. Examine the individual files to ensure no duplicate records are found across different files. 5. Using Excel or other spreadsheet programs, join the separate files into a single large file. Careful attention is required to ensure the accuracy of matching up the data from individual files. |
| Rerunning of the query | 4. To rerun the query or run a modified query, adjust the single query then rerun. | 6. To rerun the queries or run modified queries, Steps 3 to 5 must be performed. |
With the ability to query across multicenter datasets and to match those data with bio-fluid and/or genetic data, the INDD database played a key role in our ability to conduct this study. Figure 5 gives an example of a portion of the data set queried for the Penn-Pfizer biomarker study from several clinical core databases. It shows data from the ALS, AD, FTLD databases with education, race, ethnicity, and diagnosis along with Mini Mental State Exam (MMSE) date, MMSE total score, Luminex total CSF tau (t-tau) values, and Luminex CSF phosphorylated tau (p-tau) values. Since the interrogation of these 1500 plasma and CSF samples is complete, several analyses of the data have either been published, submitted or in preparation. Briefly, several analytical strategies are being used to identify classifying analytes according to clinical and pathological diagnosis, including significance analysis of microarrays (SAM) and random forest analysis. Many analytes differed between AD and NC subjects, but only a few differed between AD and non-AD dementias. This type of analysis required the model to adjust for basic demographic variables (age, gender, education) at the most superficial level, and additional adjustment for more complex time-dependent variables including disease duration at collection time for bio-fluid sample(s) and cognitive and neurological examination results corresponding to bio-fluid collection. As some patients had multiple types of bio-fluids collected (plasma and CSF), and a small subset had serial samples from different time points, a comprehensive INDD database is necessary to generate the data points associated with each patient at a particular time point. Novel analytes representing potential CSF biomarkers for AD and FTLD using the data generated from the INDD database have been studied and results have been published [17] or submitted (Hu et al., Neurology, submitted). We also investigated plasma biomarkers that distinguish between AD from NC and other neurodegenerative diseases and these studies are being prepared for publication (Soares et al, in preparation). Thus, we have exploited the Penn INDD database to implement novel biomarker studies that would otherwise have been nearly impossible to accomplish in a timely fashion without an integrated database system.
Figure 5. Screenshot Database Output for Penn-Pfizer Biomarker Study.

This screenshot shows data queried from the INDD database on parameters for patients with ALS, AD or FTLD including education, race, ethnicity, and diagnosis along with Mini-Mental State Exam (MMSE) Date, MMSE Total score, Luminex CSF t-tau values and Luminex CSF p-tau values.
4. Discussion
We have developed an INDD database that includes AD, PD, FTLD, ALS and normal control patients, as well as those with other neurodegenerative diseases. This is significant because the INDD database provides a powerful tool for generating data sets in comparative studies across several neurodegenerative diseases.
In the Penn-Pfizer collaborative biomarker study, having an integrated database significantly eases the process of querying and extracting data from the database compared to the traditional database scheme, in which individual centers and individual components of the centers operate in separate and disjointed databases. We showed that the INDD database is robust and reliable because the two approaches generated identical results of the study. However, using a traditional database scheme is prone to a higher degree of errors and significant increase in labor for post-processing of the data. In contrast, the Penn INDD database has the ability to query multiple database tables from a single console with high accuracy and reliability. Thus, the merits of this Penn INDD database are evident now and its utility as a research tool will certainly grow as it continues to mature and expand.
We keep and make separate distinctions between different centers and tables for the ease of data entries and not for technical reasons. The INDD database avoids altering local data entry. While the interfaces for each center are customized and center-specific, all the data are stored in a same container and can be queried using joins of the databases.
One challenge in building the INDD database is to make sure that subject in more than one centers are indeed the same person. The work presented in this paper illustrates the use of SoundEX to display similar sounding patients and the use of the date of birth and address to verify that they are indeed the same subject. This feature is important for an integrated database that links multiple clinical centers as it is not unusual to have a subject who is seen in more than one clinic. The second challenge is to continually use the separate center IDs that were created before the integration took place while accommodating for instances where the center IDs could overlap with other centers. After multiple meetings among data managers and investigators, we came up with the idea of building the INDD database by automatically appending a prefix letter to distinguish between originating centers. This is essential for researchers who plan to perform any comparative studies across more than one disease. The third challenge is to unify the variable coding. For example, race variable may have different categories for different centers. Data managers and principle investigators had to meet to decide the common coding scheme for each common variable. This is obviously crucial as any comparative studies and statistical analysis would require the same definition of the same variable for all subjects.
The current limitation of the INDD database is that data queries have to be run by data managers and can not be run by investigators who request the data. Our future development plan is to build a query bank that includes common queries that researchers can run themselves.
In terms of the cost of the development, we purchased a new server with SQL software and license (~ $6000). It took approximately 75% effort of a data manager per year for about two years to build the INDD database. But these investments will eventually save costs because all centers share one server instead of using their own servers. Furthermore, investigators do not need to clean and merge data set themselves when they need datasets from multiple centers. They can get a clean data set from the INDD database. This will greatly reduce errors and save time. Finally, as exemplified by the biomarker studies mentioned above and reviewed in Hu et al. [16], the INDD will be enormously useful for future biomarker studies, as well as for genomic and genome wide association studies in addition to the analysis of clinical trials and classical clinic-pathological correlations. Indeed, we view the INDD as a significant step forward in creating the foundational framework upon which we and others can usher in the exciting new era of “personalized medicine”.
Acknowledgments
This work was supported by NIH grants including the AG-10124 (the Alzheimer’s Disease Core Center), AG-17586, AG-09215, NS-44266, AG-15116, and NS-053488 (the Morris K. Udall Parkinson’s Disease Research Center of Excellence) and a foundation that prefers to remain anonymous. We are grateful to all of our colleagues in the Center for Neurodegenerative Disease Research, the Penn Memory Center, the Center for Frontotemporal Degeneration, the Parkinson’s Disease And Movement Disorder Clinic, the Morris K. Udall Parkinson’s Disease Research Center of Excellence, the Alzheimer’s Disease Core Center and the Amytrophic Lateral Sclerosis Center for all of their contributions to make the Penn INDD database a reality. We would like to thank Warren Bilker, Jonas Ellenberg, John Holmes, Kurt Brunden, and William Hu for their helpful comments on the draft of the manuscript. Finally, we thank all of our patients and their families for their participation in our research and their support for the Penn neurodegenerative disease research programs.
Footnotes
There are no financial or other relationships that could be interpreted as a conflict of interest affecting this manuscript.
References
- 1.Trojanowski JQ, Arnold SE, Karlawish JH, Brunden K, Cary M, Davatzikos C, et al. Design of comprehensive Alzheimer’s Disease Centers to address unmet national needs. Alzheimer’s & Dementia. 2010;6:150–5. doi: 10.1016/j.jalz.2009.11.004. [DOI] [PMC free article] [PubMed] [Google Scholar]
- 2.Neumann M, Sampathu DM, Kwong LK, Traux A, Miscenyi M, Chou TT, et al. Ubiquitinated TDP-43 in frontotemporal lobar degeneration and amyotrophic lateral sclerosis. Science. 2006;314:130–3. doi: 10.1126/science.1134108. [DOI] [PubMed] [Google Scholar]
- 3.Geser F, Martinez-lage M, Kwong LK, Lee VM-Y, Troajanoski JQ. Amyotrophic lateral sclerosis, frontotemporal dementia and beyond. Journal of Neurology. 2009;256:1205–14. doi: 10.1007/s00415-009-5069-7. [DOI] [PMC free article] [PubMed] [Google Scholar]
- 4.Pesiridis GS, Lee VM-Y, Trojanowski JQ. Mutations in TDP-43 link glycine rich domain functions to amyotrophic lateral sclerosis. Hum Mol Genetics. 2009;18(R2):R156–62. doi: 10.1093/hmg/ddp303. [DOI] [PMC free article] [PubMed] [Google Scholar]
- 5.Forte S, Howe T, Wall K. Access 2002 development. Indianapolis, Indiana: Sam Publishing; 2001. [Google Scholar]
- 6.Rankins R, Bertucci P, Jensen P. Microsoft SQL Server 2000 unleased. Indianapolis, Indiana: Sams Publishing; 2003. [Google Scholar]
- 7.Schlossnagle G. Advanced PHP programming. Indianapolis, Indiana: Sams Publishing; 2004. [Google Scholar]
- 8.Goodman D, Morrison M. JavaScript bible. Indianapolis, Indiana: Wiley Publishing, Inc; 2007. [Google Scholar]
- 9.Bartlett K. Teach Yourself CSS. Indianapolis, Indiana: Sam Publishing; 2001. [Google Scholar]
- 10.Castro E. HTML 4 for the World Wide Web. 4. Berkeley, California: Peachpit Press; 2000. [Google Scholar]
- 11.Myer T. No nonsense XML web development with PHP. Collingwood VIC Australia: Sitepoint; 2005. [Google Scholar]
- 12.Holzner S. Ajax bible. Indianapolis, Indiana: Wiley Publishing, Inc; 2007. [Google Scholar]
- 13.York R. Beginning JavaScript and CSS development with jQuery. Indianapolis, Indiana: Wiley Publishing, Inc; 2009. [Google Scholar]
- 14.Turley P, Wood D. Transact-SQL with SQL Server 2000 and 2005. Indianapolis, Indiana: Wiley Publishing, Inc; 2006. [Google Scholar]
- 15.Dean T. Network+ guide to networks. 3. Boston, Massachusetts: Course Technology; 2004. [Google Scholar]
- 16.Hu WT, Chen-Plotkin A, Arnold SE, Grossman M, Clark CM, Shaw LM, et al. Biomarker discovery for Alzheimer’s disease, frontotemporal lobar degeneration, and Parkinson’s disease. Acta Neuropathol. 2010 doi: 10.1007/s00401-010-0723-9. in press. [DOI] [PMC free article] [PubMed] [Google Scholar]
- 17.Hu WT, Chen-Plotkin A, Arnold SE, Grossman M, Clark CM, Shaw LM, et al. Novel CSF biomarkers for Alzheimer’s disease and mild cognitive impairment. Acta Neuropathol. 2010;119:669–78. doi: 10.1007/s00401-010-0667-0. [DOI] [PMC free article] [PubMed] [Google Scholar]