

Abstract
Background
In the diagnosis of Alzheimer's disease, structural MRI scans have been used primarily to exclude non-Alzheimer's cause of dementia. However, the pattern and extent of medial temporal atrophy (MTA) on structural MRI scans, which correlates strongly with the pathological severity of Alzheimer's disease (AD), can be used to support the diagnosis of a degenerative dementia, especially AD, even in its early pre-dementia stage.
Methods
Elderly subjects (n = 224) were diagnosed to have no cognitive impairment (NCI), amnestic mild cognitive impairment (aMCI), or AD. Hippocampal and hemispheric gray matter volumes were measured on structural MRI scans, and a new visual rating system (VRS) was used to score the severity of MTA (VRS-MTA) of the hippocampus (HPC), entorhinal cortex (ERC) and perirhinal cortex (PRC) on a coronal image intersecting the mammillary bodies.
Results
Although both VRS-MTA scores and HPC volumes distinguished between NCI, aMCI and AD subjects, aMCI and NCI subjects could be better distinguished using right VRS-MTA scores, in comparison to right HPC volumes. VRS-MTA scores were more highly correlated with episodic memory and Clinical Dementia Rating scores. A combination of left side VRS-MTA scores and left side hippocampal volume was the most predictive measure of diagnostic classification.
Conclusion
VRS-MTA is a clinically convenient method of distinguishing aMCI or AD from NCI. Compared with volumetric measures, it provides better discriminatory power and correlates more strongly with memory and functional scores.
Keywords: Alzheimer disease, dementia, volumetric analysis, visual rating, brain MRI, medial temporal atrophy, diagnosis, cognitive impairment, neuropsychological tests
Introduction
Alzheimer's disease (AD), the most common cause of dementia in the elderly, is a gradually progressive degenerative neurological disorder that is characterized by increasing cognitive impairment, characteristic degenerative pathology and brain atrophy.1,2 Approximately one third of non-demented elderly individuals have neuropathology consistent with that observed in a majority of cases diagnosed with Probable AD, yet do not manifest the symptoms of the disease during life.3,4 At present, there is no cure for AD, but an early and accurate diagnosis is potentially important for intervention in this disease, even among cognitively normal, at-risk individuals, before irreversible changes in the brain have taken place5. Imaging is currently used in a dementia workup to exclude non-AD etiologies, such as hydrocephalus, brain tumors, subdural hematomas and strokes, but not to identify and measure the severity of underlying AD neuropathology.4, 6-8 It would seem that limiting use of MRI scans solely for the purpose of excluding diagnoses other than AD, does not optimize the utility of a valuable and widely employed imaging resource in the work–up of patients with cognitive impairment. In fact, imaging could be employed routinely to support a clinical diagnosis of AD among patients with dementia and amnestic Mild Cognitive Impairment (aMCI), by confirming the presence and severity of AD-like pathology in the brain. MRI could also be used in multicenter clinical trials of pharmacological and non-pharmacological interventions for AD, to ensure that patients in these studies have imaging evidence of AD pathology.
Morphological changes in the brain can be measured using manual, semi-automated and fully automated volumetric techniques to study whole brain and medial temporal volumes. 9-13 We have expanded the scope and improved the reliability and sensitivity of a visual rating method that assesses the entire medial temporal region,14 with a visual rating system (VRS) for separately rating atrophy of the hippocampus (HPC), entorhinal (ERC) and perirhinal cortex (PRC) on a single coronal MRI slice.15-16 This study compares the capability of VRS-MTA and volumetric analysis in distinguishing cases diagnosed with no cognitive impairment (NCI), aMCI, and AD among 224 subjects enrolled in the Florida Alzheimer's Disease Research Center (FADRC). The correlation of VRS-MTA scores and volumetric analysis to specific neuropsychological test scores and the Clinical Dementia Rating scale (CDR) was also evaluated. Finally, VRS-MTA scores and volumetric analysis were combined to determine whether this improved diagnostic power.
Methods
Subjects
A total of 224 male and female subjects, 60-92 years of age, including English and Spanish speakers, participating in the Florida AD Research Center Clinical Core (FADRC-CC) in Miami and Tampa, FL, were evaluated. Subjects were recruited from the community (by advertisement and from free memory screening evaluations) and from memory disorder clinics. All subjects or a legal representative provided informed consent as approved by Mount Sinai Medical Center, Miami Beach and University of South Florida, Tampa, Institutional Review Boards. Subjects were evaluated using: (1) Mini-Mental State Examination (MMSE),17 a measure of global cognitive status; (2) neuropsychological test battery following National Alzheimer's Coordinating Center (NACC) protocol;18 (3) Three Trial Fuld Object Memory Evaluation;19 (4) Hopkins Verbal Learning Test;20 (4) volumetrically acquired structural brain MRI. An MMSE score of 20 or greater was required to enter the study, to ensure that the subjects with dementia would be mildly impaired.
Diagnosis
Each subject was evaluated independently by a physician and a neuropsychologist, experienced in the diagnosis of elderly subjects with cognitive impairment or dementia. These clinicians did not have access to each others' diagnoses, or to any imaging data, prior to assigning their diagnoses. To standardize the method in which the independent diagnoses by these two clinicians were reconciled into a consensus diagnosis, an algorithmic diagnosis procedure34 was used, based upon a formula that combined the physician's diagnosis (Phy-Dx) and the neuropsychologist's diagnosis (NP-Dx). The diagnosis of No Cognitive Impairment (NCI) required that both Phy-Dx and NP-Dx were NCI based on an informant report of “no significant decline in cognition,” and no cognitive test scores were 1.5 SD or more below age and education corrected means. The amnestic MCI (aMCI) diagnosis21 required that both the Phy-Dx be MCI and the NP-Dx be aMCI. The Dementia diagnosis met DSM-IV and National Alzheimer's Coordinating Center (NACC) criteria,18 and a specific diagnosis of AD was based on NINCDS-ADRDA criteria.22
MRI Procedures
Structural brain MRIs were obtained on a 1.5 Tesla MRI machine using proprietary 3-D MPRAGE (Siemens) or 3-D FSPGR (General Electric) sequences to acquire contiguous coronal slices of 1.5 mm or less in thickness. Structural MRIs were reconstructed in the coronal plane perpendicular to the anterior commissure-posterior commissure line.
Visual Rating System (VRS)
VRS software was developed to standardize ratings of atrophy in the HPC, ERC and PRC structures (Figure 1) of the medial temporal lobe. All raters using VRS were blind to the subjects' diagnosis and demographic information. Technical details for the VRS were described previously.15, 16 Briefly, VRS is used to assess a standard coronal slice intersecting the mammillary bodies, and medial temporal atrophy (MTA) is evaluated by separately assessing atrophy in the HPC, ERC and PRC of each hemisphere. Ratings are based on a five point scale, with “0” signifying no atrophy, and “4” signifying the most severe atrophy. MTA ratings for each hemisphere are calculated by summing the ratings for the HPC, ERC and PRC on each side. A library of reference images that defines the anatomical boundaries of each brain structure and depicts different levels of atrophy are provided from a drop-down menu in the system interface; this facilitates a direct comparison of each structure on the subject's MRI. VRS enables digital entry of atrophy ratings that are automatically saved to an Excel file. We have previously reported excellent inter-rater (kappa, 0.75 to 0.94) and intra-rater (kappa, 0.84 to 0.94) reliabilities for VRS ratings of atrophy in the HPC, ERC, and PRC.16
Figure 1. Visual Rating System for Assessing Hippocampal Atrophy.
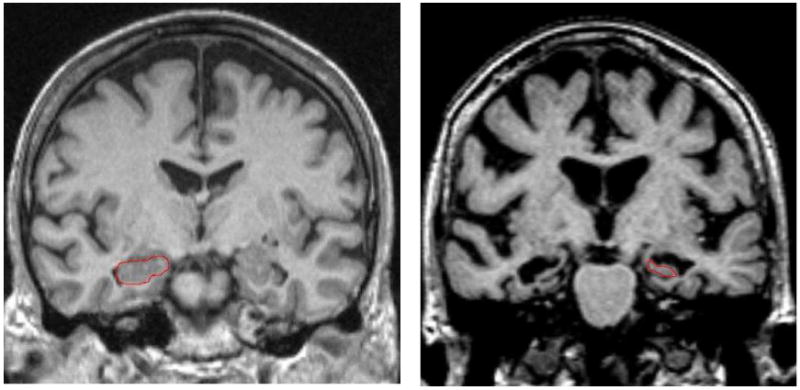
On the left, the hippocampus outlined in red shows no atrophy (Score =0) in both hemispheres; on the right, the hippocampus has severe atrophy (Score = 4) in both hemispheres.
Volumetric Analysis of Brain MRIs
Volumetric analysis of brain MRIs (Figure 2) utilized modified Individual Brain Atlases using Statistical Parametric Mapping (IBASPM)23 that is an extension of SPM-5,24 and operates in MATLAB environment.25 Calculation of brain structure volumes was performed as follows: 1) using IBASPM segmentation, MRIs were segmented into gray matter, white matter and cerebral spinal fluid (CSF); 2) MRI scans were spatially transformed into Montreal Neurological Institute (MNI) space,26 using affine transformation for approximate registration, and nonlinear transformation for fine registration to obtain the transformation parameters; 3) an anatomical automatic labeling (AAL) data set27 of 116 brain structures was applied to encode each structure with an unique intensity value; the intensity-coded AAL structural brain was transformed from MNI space to each individual; 4) volume information for each structure, including medial temporal structures such as HPC, parahippocampal gyrus, and amygdala was derived by summing the number of voxels assigned the same coding intensity value and multiplying with the voxel size; 5) intracranial volume (ICV) was calculated as the summation of gray matter, white matter, and cerebrospinal fluid volumes, and ICV was used to normalize each brain structure's volume. The operator involved with volumetric analysis was blind to the subjects' diagnosis and demographic information.
Figure 2. Procedure of Obtaining Hippocampal Volume.
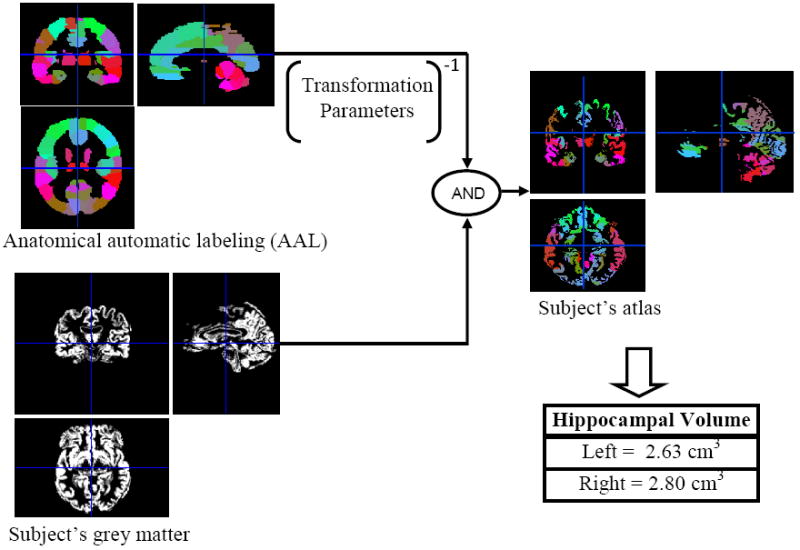
By warping the intensity-coded anatomical automatic labeling (AAL) into the individual subject's grey matter based on the transformation parameters, the individual subject's atlas was obtained. Then hippocampal volumes were calculated by summing the number of voxel of hippocampus in individual subject's atlas and multiply with the voxel size.
Statistical Analysis
Group comparisons of means were analyzed using a series of one-way analyses of variance (ANOVA). Scheffe' post-hoc procedure was used to examine differences between means. Pearson Correlation Coefficients were employed to compare neuroimaging measures to indices of memory and severity of clinical impairment. The magnitude of these correlations were compared using SISA.28 Comparison of different methods to classify subjects in different diagnostic groups was conducted by comparison of the area under the receiver operating curve (ROC), and evaluation of the optimal combination of variables for diagnostic classification was assessed via logistic regression.
Results
Groups differed (Table 1) with respect to age [F(2,221)= 31.7; p<.001], level of education [F(2,174)= 4.1; p<.02], and MMSE scores [ F(2,192)= 125.3; p<.001]. Post-hoc tests of means by Scheffe' procedure showed NCI subjects were younger than aMCI, and AD were older than aMCI subjects. NCI and aMCI subjects had similar levels of education, but AD subjects were less educated than NCI subjects. Subjects in the NCI group were predominantly female, in comparison to a more even distribution of gender in other diagnostic groups. MMSE scores were highest among NCI subjects, intermediate in the aMCI group and lowest among AD subjects. The three diagnostic groups were compared with regards to their average right and left hempisphere HPC volumes as well as left and right-side VRS-MTA scores. As indicated in Table 2, there were group differences on all measures. NCI subjects had the largest left HPC volumes followed by the aMCI group and the AD group, which had the smallest left HPC volumes. NCI subjects also had larger right HPC volumes than both aMCI and AD groups, which did not differ from each other. AD subjects evidenced the highest left sided and right sided VRS-MTA scores (indicating greater atrophy) relative to the other study groups, while aMCI subjects had greater left and right sided atrophy scores relative to NCI subjects.
Table 1.
Demographic Variables of Diagnostic Groups (n=224)
| Diagnostic Group | NCI (n=104) |
aMCI (n=72) |
AD (n=48) |
F values |
|---|---|---|---|---|
| Age Mean (SD) |
71.1a (5.4) |
76.4b (6.5) |
79.2c (7.6) |
31.67*** |
| Education Mean (SD) |
14.4a (3.5) |
13.5ab (3.3) |
12.3b (4.4) |
4.11* |
| Gender (% Female) |
73.1% | 51.4% | 58.3% | 9.14**(χ2) |
| MMSE Score Mean (SD) |
29.1a (1.0) |
26.2b (2.3) |
22.9c (3.4) |
125.33*** |
NCI = No Cognitive Impairment; aMCI=Amnestic MCI, AD= Alzheimer's disease
p<.05;
p≤ .01;
p≤ .001
Means with different alphabet superscripts are statistically significant at p<.05 by the Scheffe' procedure
Table 2.
Volumetric and VRS-MTA Scores in Different Diagnostic Groups
| NCI (n=104) |
aMCI (n=72) |
AD (n=48) |
F values | |
|---|---|---|---|---|
| HPC-L Vol (SD) [95% CI] |
0.20a (.03) [.20 -.21] |
0.18b (.03) [.17 -.18] |
0.15c (.03) [.15-.16] |
50.17*** |
| HPC-R Vol (SD) [95%CI] |
0.19a (.03) [.18 -.19] |
0.16b (.03) [1.5 -1.7] |
0.15b (.04) [.13-.16] |
27.72*** |
| VRS-MTA-L (SD) [95%CI] |
0.45a (.53) [.35 -.56] |
1.31b (.84) [1.12 -.1.51] |
2.12 c (1.10) [1.80 -2.44] |
78.80*** |
| VRS-MTA-R (SD) [95%CI] |
0.48a (.55) [.38 -.59] |
1.38b (.89) [1.173 -.1.59] |
2.01 c (1.10) [1.69 -2.33] |
64.74*** |
NCI = No Cognitive Impairment; aMCI=Amnestic MCI; AD= Alzheimer's disease
HPC volumes are in cubic centimeters; VRS-MTA measures are means for bilateral hippocampal, entorhinal cortex and perirhinal cortex ratings on a 0 to 4 scale.
p<.05;
p≤.01;
p≤ .001
Means with different alphabet superscripts are statistically significant at p<.05 by the Scheffe' procedure
To evaluate the effect of age on VRS-MTA scores and HPC volumes, subjects were divided into two age groups, i.e., 60-74 years and 75 + years of age (Tables 3 and 4). For right and left VRS-MTA, there was a main effect for Diagnostic Group [F(2,218)= 32.8; p<.001; F(2,218)= 41.6; p<.001, respectively] and age [F(1,218)= 30.2; p<.001; [F(1,218)= 31.5; p<.001], but no significant Group by Age interactions [F(1,218)= 1.4; p=.25; F(1,218) = 1.2; p=.30]. In general, older subjects had higher right and left VRS-MTA scores and post-hoc Sidak tests indicated that the AD group had right and left VRS-MTA scores that were higher than the other diagnostic groups. Also, aMCI subjects had higher right and left VRS-MTA scores than did NCI subjects (Table 3). For right and left volumetric measures, there was a main effect for Diagnostic Group [F(2,218)= 16.0; p<.001; F(2,218)= 31.8; p<.001, respectively] and age [F(1,218)= 4.6; p<.03; F(1,218)= 4.2; p<.05, respectively] but no significant Group by Age interaction [F(1,218)= .04; p=.96; F(1,218)= .09; p=.91, respectively]. Lower right and left HPC volumes were noted among older subjects, but post-hoc Sidak tests indicated that the AD group had HPC volumes that were not different from aMCI volumes. However, both AD and aMCI groups had lower values than did NCI subjects (Table 4).
Table 3.
Right VRS-MTA Mean Scores by Diagnosis and Age Group
| 60-74 yrs | 75+ yrs | |||||
|---|---|---|---|---|---|---|
| m ± sd | 95% CI | n | m ± sd | 95% CI | n | |
| NCI | 0.36 ± 0.44 | [.26, .46] | 77 | 0.84 ± .68 | [.57, 1.11] | 27 |
| aMCI | 1.03 ± 0.84 | [0.67, 1.38] | 24 | 1.56 ± .87 | [1.30, 1.81] | 48 |
| AD | 1.28 ± 0.71 | [.83, 1.73] | 12 | 2.25 ± 1.10 | [1.88, 2.62] | 36 |
NCI = No Cognitive Impairment; aMCI=Amnestic MCI, AD= Alzheimer's disease
Effects: Diagnosis [F(2,218)= 32.82; p<.001; Age Group [F(1,218)= 30.15; p<.001; Diagnosis by Age interaction [F(1,218)= 1.39; p=.25
For the Main effect for Diagnosis, post-hoc Sidak tests revealed that AD subjects had the highest degree of atrophy followed by the a-MCI group. The NCI group had the lowest levels of atrophy.
Table 4.
Right HPC-Volumes by Diagnostic Group and Age Group
| 60-74 yrs | 75+ yrs | |||||
|---|---|---|---|---|---|---|
| m ± sd | 95% CI | n | m ± sd | 95% CI | n | |
| NCI | 0.19 ± 0.03 | [0.18, 0.19] | 77 | 0.18 ± 0.04 | [0.16, 0.19] | 27 |
| aMCI | 0.17 ± 0.04 | [0.15, 0.18] | 24 | 0.15 ± 0.03 | [0.15, 0.16] | 48 |
| AD | 0.16 ± 0.04 | [0.13, 0.18] | 12 | 0.14 ± 0.04 | [0.13, 0.16] | 36 |
NCI = No Cognitive Impairment; aMCI=Amnestic MCI, AD= Alzheimer's disease
Effects: Diagnosis [F(2,218)= 15.97; p<.001]; Age Group[F(1,218)= 4.60; p<.03];Diagnosis by Age [F(1,218)= .04; p=.96]
For the main effect of Diagnosis, post-hoc Sidak tests revealed that AD and aMCI subjects had equivalent hippocampal volumes that were lower than the NCI group.
We conducted comparative receiver operating characteristics (ROC) analyses to determine the extent to which VRS-MTA and volumetric measures could distinguish between aMCI and NCI groups. As depicted in Table 5, the area under the curve for the ROC curve (AUC-ROC) for NCI versus aMCI ranged from .725 to .82. There was a statistically greater AUC-ROC for the right sided VRS-MTA than the corresponding right sided volumetric measure Z=2.32; p=.021. The overall correct classification rate of aMCI versus normal elderly subjects was 76% and 75% for left and right VRS-MTA, and 68% for the each volumetric measure. When left and right hemisphere VRS-MTA and HPC volumes were entered into step-wise logistic regression, the most significant predictors of diagnostic classification was left VRS-MTA [B=1.59; SE= .33; Wald= 23.70; p< .001] and left volumetric score [B=-2188.0; SE= 767.0 Wald=8.14; p< .005] resulting in a sensitivity of 66.7%, a specificity of 87.5% and an overall classification of 79.0%. No significant differences were found when AUC-ROCs for VRS-MTA versus HPC volumetric measures were used to distinguish the AD group from the NCI group.
Table 5.
Comparison of areas under the curve (AUC) HP-Vol for distinguishing aMCI from NCI
| AUC | SE | 95% CI | |
|---|---|---|---|
| HP-Vol Left | 0.753 | 0.037 | 0.682 to 0.814 |
| VRS-MTA Left | 0.819 | 0.032 | 0.754 to 0.873 |
| HP-Vol Right | 0.725 | 0.040 | 0.653 to 0.789 |
| VRS-MTA Right | 0.806 | 0.034 | 0.740 to 0.862 |
Comparison of VRS-MTA to HP-Vol AUC values on the right is significantly different at p=0.021 level
As shown in Table 6, the correlation of the 3-Trial Fuld Object Memory Evaluation (FOME) scores, a measure of memory and learning, were r =.55 (p<.001) and r =.45 (p<.001), with left and right VRS-MTA scores and r= -.47 (p =< .001) and r = -.31 (p =.004) for left and right HPC volumes, respectively. The absolute strength of association with the FOME for right VRS-MTA score (but not the left MTA score) was statistically higher than the corresponding HPC volume measures. The correlations of CDR-SB scores were r = -.56 (p<.001) and r = -.58 (p<.001) respectively, with left and right VRS-MTA scores, and r= -.42 (p =< .001) and r = -.32 (p =.004), respectively, for left and right HPC volumes. The strength of association for VRS-MTA right and left scores with CDR-SB were statistically higher than for the corresponding right and left HPC volumes. Taken together, independent of the effects of age, VRS-MTA scores were more highly correlated with memory and severity of clinical symptoms than the HPC volumetric analysis measures.
Table 6.
Association Betweens Clinical Measures and Measures of Medial Temporal Atrophy
| MEASURE | Fuld OME | CDR Sum of Boxes |
|---|---|---|
| HP-Vol Left | 0.47*** | -0.42*** |
| VRS MTA Left | -0.55*** | 0.56*** |
| HP-Vol Right | 0.31** | -0.32*** |
| VRS MTA Right | -0.45*** | 0.58*** |
p<.05;
p≤ .01;
p≤ .001
Means with different superscripts are statistically significant at p<.05 by the Scheffe' procedure
The absolute magnitude of correlation with the Fuld OME is greater (p<.05) for VRS-MTA right than for right hippocampal volumetric scores. Further, the absolute magnitude of correlation with the CDR sum of boxes is greater (p<.05) for both VRS-MTA left and right indices, relative to their corresponding hippocampal volume scores.
Discussion
In this study we compared the ability of VRS-MTA scores to that of standard HPC volumetric measures for distinguishing NCI from aMCI and AD. The overall correct classification rate of aMCI versus normal elderly subjects was greater for VRS-MTA than volumetric measures. VRS-MTA scores were also more highly correlated to measures of memory and severity of functional impairment, in comparison to volumetric measures. An optimal combination of VRS-MTA and volumetric hippocampal measures yielded overall correct classification of 79%. We found that while VRS-MTA and HPC volumetric measures distinguished both younger and older AD and aMCI subjects from NCI subjects, the distinctions between the disease and normal groups appeared to be greater among older subjects for both types of measures (Table 2 and 3). This suggests that MRI scans are likely to provide better biomarkers of AD pathology among older subjects, who have the greatest prevalence of AD pathology. These results agree with previous findings which compared visual rating of medial temporal lobe with volumetric analysis among subjects with NCI and AD.29,30
The most common neurodegenerative disease to afflict the elderly, namely AD, initially affects layer II of the ERC, which links the neocortex to the HPC via the perforant pathway. Degenerative changes in the ERC are soon followed by degeneration and atrophy in the hippocampus, amygdala, and perirhinal regions. These atrophic changes are characteristic early pathological features of AD,31 which are visible and measurable on MRI scans. Not surprisingly, atrophy of the ERC and HPC quantified on MRI scans has been found to correlate highly with the severity of AD pathology4, 6-8 at autopsy. Further, this pattern of atrophy appears to be specific to AD, as opposed to Lewy Body Dementia and Vascular Dementia.8 As such, MTA is a well-defined quantitative biomarker, measurable on MRI scans that can be used to identify the presence and severity of AD pathology among individuals presenting with MCI and dementia syndromes.32 The foregoing also suggests that the presence of MTA on MRI scans could be used to identify the presence of AD pathology among non-demented subjects, including normal elderly individuals with subjective cognitive symptoms, about one third of whom may harbor the neuropathology of AD,3,4 and those with an elevated risk for developing AD.2 It is not surprising that aMCI subjects could be distinguished from NCI subjects, because the severity of AD pathology in the vast majority of patients who carry a diagnosis of aMCI is indistinguishable from that of clinically diagnosed AD patients 42.
We have already validated VRS-MTA in several studies in which we have shown the relationship of the scores to the diagnosis of NCI, aMCI and AD, to APOE ε4 genotype frequency and to performance on memory scores.15,16,33-35 A unique feature of VRS-MTA is that the ratings are performed specifically on a coronal slice at the level of the mammillary bodies, which in human subjects depicts the anterior aspect of the ERC, the PRC and maximizes visualization of the CA1 sector of the adjacent head of the HPC,36 where the earliest pathological changes of AD occur.37 In contrast, volumetric analysis with IBASPM and most other volumetric methods, focus only on the HPC and include the entire hippocampal structure, averaging the most anterior aspects with the less affected middle and posterior regions of the HPC. In primates, lesions in the ERC and CA1 sector of the HPC cause the most severe impairment in memory test performance.38,39 Several studies using MRI have shown that atrophy in the ERC and inferior temporal cortex (which is immediately lateral to the PRC), in addition to HPC atrophy, are among the earliest structural changes that distinguish mildly impaired AD subjects from cognitively normal elderly individuals.40,41
Although the reliability of this semi-quantitative visual rating system (VRS) cannot be expected to be as high as strictly quantitative volumetric analysis, the following are major advantages of VRS for routine clinical use: (1) unlike most volumetric methods, VRS separately assesses atrophy of the HPC, ERC and PRC; (2) VRS-MTA ratings are based on the severity of atrophy of both gray and white matter within the relevant brain regions, as well as the consequences of atrophy that may include local increase in CSF space, enlargement of sulci, especially the collateral sulcus, and changes in the outline of gyri in comparison to premorbid morphology; (3) VRS-MTA is user-friendly, easily operates on a PC or radiology console, and does not require special technical support, a major obstacle in the routine use of volumetric methods; (4) image artifacts, including those resulting from patient movement or aberrant positioning, have a much smaller impact on VRS-MTA ratings than on volumetric methods; (5) VRS-MTA rating take no more than about 5 minutes per patient, including time needed to load images on to the computer.
A limitation of VRS-MTA may be the restricted range of scoring (0 to 4) for each structure and the greater degree of variability relative to volumetric analysis. Although VRS-MTA was found to be superior to HPC volumetry, this finding is not surprising given that HPC volumetry measures the effect of atrophy in a single brain region, whereas the total VRS-MTA score is derived from scoring atrophy in three brain regions that are highly vulnerable to AD pathology. However, from a practical standpoint, VRS-MTA appears to be a superior diagnostic method because of current limitations in volumetric methods. For example, it is not possible to replicate the performance of VRS-MTA by adding volumetric assessment of the parahippocampal gyrus (which includes the ERC and the PRC) to HPC volumes. Nevertheless, it is worth noting that it is the combination of left VRS-MTA and left hippocampus measures that produce the greatest separation between aMCI and normal elderly groups, demonstrating that both methods provide unique explanatory power.
An inherent weakness of MRI structural imaging in the diagnosis of AD, using VRS-MTA and especially of HPC volumetry, is the relatively low specificity of these methods. This low specificity may be related to the fact that although structural MRI measures reflect atrophy resulting from underlying pathological processes in the brain, many elderly individuals are able to compensate for this very evident pathology. The resulting clinical syndrome can be very variable, and as many as 40% of individuals who are found to have sufficient pathology in the brain at autopsy to warrant a pathological diagnosis of AD have not been found to have cognitive impairment or dementia, proximate to the time of death 3, 4 At the same time, a potential strength of structural MRI is that it can serve as a method for identifying asymptomatic individuals with AD pathology for whom early intervention in the disease process may be a consideration.
Conclusion
In this study we found VRS-MTA was equivalent to validated volumetric methods in distinguishing AD from NCI subjects, and better than volumetric methods in distinguishing aMCI from NCI subjects. Correlations with memory measures were also higher with VRS-MTA scores than with HPC volumes. VRS-MTA is a convenient and valid method for measuring medial temporal atrophy for the clinical diagnosis of prodromal and probable AD, and can have an important role in validating the diagnosis of AD in clinical trials as a quantitative biomarker of the severity of AD pathology. 32.33
Acknowledgments
Research was supported by the National Institute of Aging, NIH 5R01AG020094-03 and NIH 1P50AG025711-03, & Byrd Alzheimer Center and Research Institute grants
Footnotes
Disclosure: The authors report no conflicts of interest.
Statistical analysis was performed by David A. Loewenstein, Ph.D., University of Miami
Publisher's Disclaimer: This is a PDF file of an unedited manuscript that has been accepted for publication. As a service to our customers we are providing this early version of the manuscript. The manuscript will undergo copyediting, typesetting, and review of the resulting proof before it is published in its final citable form. Please note that during the production process errors may be discovered which could affect the content, and all legal disclaimers that apply to the journal pertain.
References
- 1.Bowen J, Teri L, Kukull W, McCormick W, McCurry SM, Larson EB. Progression to dementia in patients with isolated memory loss. Lancet. 1997;349:763–5. doi: 10.1016/S0140-6736(96)08256-6. [DOI] [PubMed] [Google Scholar]
- 2.Tabert MH, Albert SM, Borukhova-Milov L, Camacho Y, Pelton G, Liu X, et al. Functional Deficits in Patients with Mild Cognitive Impairment: Prediction of Alzheimer's Disease. Neurology. 2002;58:758–64. doi: 10.1212/wnl.58.5.758. [DOI] [PubMed] [Google Scholar]
- 3.Snowdon DA, Greiner LH, Mortimer JA, Riley KP, Greiner PA, Markesbery WR. Brain infarction and the clinical expression of Alzheimer disease. The Nun Study. JAMA. 1997;277:813–7. [PubMed] [Google Scholar]
- 4.Jack CR, Dickson DW, Parisi JE, Xu YC, Cha RH, O'Brien PC, et al. Antemortem MRI findings correlate with hippocampal neuropathology in typical aging and dementia. Neurology. 2002;58:750–7. doi: 10.1212/wnl.58.5.750. [DOI] [PMC free article] [PubMed] [Google Scholar]
- 5.Golde TE. The therapeutic importance of understanding mechanisms of neuronal cell death in neurodegenerative disease. Mol Neurodegener. 2009;4:8. doi: 10.1186/1750-1326-4-8. [DOI] [PMC free article] [PubMed] [Google Scholar]
- 6.Gosche KM, Mortimer JA, Smith CD, Markesbery WR, Snowdon DA. Hippocampal volume as an index of Alzheimer neuropathology: Findings from the Nun Study. Neurology. 2002;58:1476–1482. doi: 10.1212/wnl.58.10.1476. [DOI] [PubMed] [Google Scholar]
- 7.Bobinski M, Wegiel J, Wisniewski HM, Tarnawski M, Bobinski M, Reisberg B, et al. Neurofibrillary pathology - correlation with hippocampal formation atrophy in Alzheimer disease. Neurobiol Aging. 1996;17:909–919. doi: 10.1016/s0197-4580(97)85095-6. [DOI] [PubMed] [Google Scholar]
- 8.Burton EJ, Barber R, Mukaetova-Ladinska EB, Robson J, Perry RH, Jaros E, et al. Medial temporal lobe atrophy on MRI differentiates Alzheimer's disease from dementia with Lewy bodies and vascular cognitive impairment: a prospective study with pathological verification of diagnosis. Brain. 2009;132:195–203. doi: 10.1093/brain/awn298. [DOI] [PubMed] [Google Scholar]
- 9.Killiany RJ, Gomez-Isla T, Moss M, Kikinis R, Sandor T, Jolesz F, et al. Use of structural magnetic resonance imaging to predict who will get Alzheimer's disease. Ann Neurol. 2000;47(4):430–9. [PubMed] [Google Scholar]
- 10.de Jong LW, van der Hiele K, Veer IM, Houwing JJ, Westendorp RG, Bollen EL, et al. Strongly reduced volumes of putamen and thalamus in Alzheimer's disease: an MRI study. Brain. 2008;131:3277–85. doi: 10.1093/brain/awn278. [DOI] [PMC free article] [PubMed] [Google Scholar]
- 11.Feczko E, Augustin JC, Fischl B, Dickerson BC. An MRI-based method for measuring volume, thickness and surface area of entorhinal, perirhinal, and posterior parahippocampal cortex. Neurobiol Aging. 2009;30:420–31. doi: 10.1016/j.neurobiolaging.2007.07.023. [DOI] [PMC free article] [PubMed] [Google Scholar]
- 12.Brewer JB, Magda S, Airriess C, Smith ME. Fully-Automated Quantification of Regional Brain Volumes for Improved Detection of Focal Atrophy in Alzheimer Disease. Am J Neuroradiol. 2009;30:578–80. doi: 10.3174/ajnr.A1402. [DOI] [PMC free article] [PubMed] [Google Scholar]
- 13.Sandstrom CK, Krishnan S, Slavin MJ, Tran T, Doraiswamy PM, Petrella JR. Hippocampal Atrophy Confounds Template-Based Functional MR Imaging Measures of Hippocampal Activation in Patients with Mild Cognitive Impairment. Am J Neuroradiol. 2006;27:1622–27. [PMC free article] [PubMed] [Google Scholar]
- 14.Scheltens P, Launer LJ, Barkhof F, Weinstein HC, van Gool WA. Visual assessment of medial temporal lobe atrophy on magnetic resonance imaging: interobserver reliability. J Neurol. 1995;242:557–60. doi: 10.1007/BF00868807. [DOI] [PubMed] [Google Scholar]
- 15.Duara R, Loewenstein DA, Potter E, Appel J, Greig MT, Urs R, et al. Medial Temporal Atrophy on MRI Scans and the Diagnosis of Alzheimer's Disease. Neurology. 2008;71:1986–92. doi: 10.1212/01.wnl.0000336925.79704.9f. [DOI] [PMC free article] [PubMed] [Google Scholar]
- 16.Urs R, Potter E, Barker W, Appel J, Loewenstein DA, Zhao W, et al. Visual Rating System (VRS) for Assessing Magnetic Resonance Images (MRIs): A tool in the diagnosis of Alzheimer's disease. J Comput Assist Tomogr. 2009;33:73–78. doi: 10.1097/RCT.0b013e31816373d8. [DOI] [PubMed] [Google Scholar]
- 17.Folstein M, Folstein S, McHugh P. Mini-Mental State: a practical method for grading the cognitive state of patients for the physician. J Psychiatr Res. 1975;12:189–98. doi: 10.1016/0022-3956(75)90026-6. [DOI] [PubMed] [Google Scholar]
- 18.Beekly DL, Ramos EM, Lee WW, Deitrich WD, Jacka ME, Wu J, et al. The National Alzheimer's Coordinating Center (NACC) database: the Uniform Data Set. Alzheimer Dis Assoc Disord. 2007;21(3):249–58. doi: 10.1097/WAD.0b013e318142774e. [DOI] [PubMed] [Google Scholar]
- 19.Fuld PA. Fuld Object-Memory Evaluation. Wood Dale, IL: Stoelting Co.; 1981. [Google Scholar]
- 20.Lacritz LH, Cullum CM, Weiner M, Rosenberg RN. Comparison of the Hopkins Verbal Learning Test Revised to the California Verbal Learning Test in Alzheimer's disease. Appl Neuropsychol. 2001;8:180–4. doi: 10.1207/S15324826AN0803_8. [DOI] [PubMed] [Google Scholar]
- 21.Petersen RC, Smith GE, Waring SC, Ivnik RJ, Tangalos EG, Kokmen E. Mild cognitive impairment: clinical characterization and outcome. Arch Neurol. 1999;56:303–8. doi: 10.1001/archneur.56.3.303. [DOI] [PubMed] [Google Scholar]
- 22.McKhann G, Drachman D, Folstein M, Katzman R, Price D, Stadlan EM. Clinical diagnosis of Alzheimer's disease: report of the NINCDS-ADRDA Work Group under the auspices of the Department of Health and Human Services Task Force on Alzheimer's disease. Neurology. 1984;34:939–944. doi: 10.1212/wnl.34.7.939. [DOI] [PubMed] [Google Scholar]
- 23.Alemán-Gómez Y, Melie-García L, Valdés-Hernandez P. IBASPM: Toolbox for automatic parcellation of brain structures. Presented at the 12th Annual Meeting of the Organization for Human Brain Mapping; June 11-15, 2006; Florence, Italy. Available on CD-Rom in NeuroImage. [Google Scholar]
- 24.Wellcome Trust Centre for Neuroimaging. London, England: SPM. 2 April 2009. 1 July 2009 < http://www.fil.ion.ucl.ac.uk/spm/>. [Google Scholar]
- 25.MATLAB. The Mathworks; Natick, Massachusetts, USA: [Google Scholar]
- 26.McGill University. Montreal, Quebec, Canada: 12 June 2006. 1 July 2009 < http://www.bic.mni.mcgill.ca/brainweb/>. [Google Scholar]
- 27.Tzourio-Mazoyer N, Landeau B, Papathanassiou D, Crivello F, Etard O, Delcroix N, et al. Automated anatomical labelling of activations in spm using a macroscopic anatomical parcellation of the MNI MRI single subject brain. Neuroimage. 2002;15:273–289. doi: 10.1006/nimg.2001.0978. [DOI] [PubMed] [Google Scholar]
- 28.Uitenbroek DG. SISA Binomial. Southampton: D.G. Uitenbroek; 1997. Retrieved January 01, 2004, from the World Wide Web: http://www.quantitativeskills.com/sisa/distributions/binomial.htm. [Google Scholar]
- 29.Wahlund LO, Julin P, Johansson SE, Scheltens P. Visual rating and volumetry of the medial temporal lobe on magnetic resonance imaging in dementia: a comparative study. J Neurol Neurosurg Psychiatry. 2000;69(5):630–5. doi: 10.1136/jnnp.69.5.630. [DOI] [PMC free article] [PubMed] [Google Scholar]
- 30.Bresciani L, Rossi R, Testa C, Geroldi C, Galluzzi S, Laakso MP, et al. Visual assessment of medial temporal atrophy on MR films in Alzheimer's disease: comparison with volumetry. Aging Clin Exp Res. 2005;17(1):8–13. doi: 10.1007/BF03337714. [DOI] [PubMed] [Google Scholar]
- 31.Braak H, Braak E. Neuropathological stageing of Alzheimer's–related changes. Acta Neuropathol (Berl) 1991;82:239–59. doi: 10.1007/BF00308809. [DOI] [PubMed] [Google Scholar]
- 32.Dubois B, Feldman HH, Jacova C, Dekosky ST, Barberger-Gateau P, Cummings J, et al. Research criteria for the diagnosis of Alzheimer's disease: revising the NINCDS-ADRDA criteria. Lancet Neurol. 2007;6:734–46. doi: 10.1016/S1474-4422(07)70178-3. [DOI] [PubMed] [Google Scholar]
- 33.Duara R, Loewenstein DA, Greig-Custo MT, Raj A, Barker W, Potter E, et al. Diagnosis and staging of mild cognitive impairment, using a modification of the clinical dementia rating scale: the mCDR. Int J Geriatr Psychiatry. 2010;25:282–289. doi: 10.1002/gps.2334. [DOI] [PMC free article] [PubMed] [Google Scholar]
- 34.Duara R, Loewenstein DA, Greig M, Acevedo A, Potter E, Appel J, et al. Reliability and validity of an algorithm for the diagnosis of normal cognition, mild cognitive impairment, and dementia: implications for multicenter research studies. Am J Geriatr Psychiatry. 2010;18:363–370. doi: 10.1097/jgp.0b013e3181c534a0. [DOI] [PMC free article] [PubMed] [Google Scholar]
- 35.Loewenstein DA, Acevedo A, Potter E, Schinka JA, Raj A, Greig MT, et al. Severity of medial temporal atrophy and amnestic mild cognitive impairment: selecting type and number of memory tests. Am J Geriatr Psychiatry. 2009;17:1050–1058. doi: 10.1097/JGP.0b013e3181b7ef42. [DOI] [PubMed] [Google Scholar]
- 36.Mori E, Yoneda Y, Yamashita H, Hirono N, Ikeda M, Yamadori A. Medial temporal structures relate to memory impairment in Alzheimer's disease: an MRI volumetric study. J Neurol Neurosurg Psychiatry. 1997;63:214–21. doi: 10.1136/jnnp.63.2.214. [DOI] [PMC free article] [PubMed] [Google Scholar]
- 37.Leverenz JB, Raskind MA. Early amyloid deposition in the medial temporal lobe of young Down syndrome patients: a regional quantitative analysis. Exp Neurol. 1998 Apr;150(2):296–304. doi: 10.1006/exnr.1997.6777. [DOI] [PubMed] [Google Scholar]
- 38.Zola-Morgan S, Squire LR, Amaral DG, Suzuki WA. Lesions of perirhinal and parahippocampal cortex that spare the amygdala and hippocampal formation produce severe memory impairment. J Neurosci. 1989;9:4355–70. doi: 10.1523/JNEUROSCI.09-12-04355.1989. [DOI] [PMC free article] [PubMed] [Google Scholar]
- 39.Zola-Morgan S, Squire LR, Clower RP, Rempel NL. Damage to the perirhinal cortex exacerbates memory impairment following lesions to the hippocampal formation. J Neurosci. 1993;13:251–65. doi: 10.1523/JNEUROSCI.13-01-00251.1993. [DOI] [PMC free article] [PubMed] [Google Scholar]
- 40.Desikan RS, Cabral HJ, Hess CP, Dillon WP, Glastonbury CM, Weiner MW, et al. Automated MRI measures identify individuals with mild cognitive impairment and Alzheimer's disease. Brain. 2009 Aug;132(Pt 8):2048–57. doi: 10.1093/brain/awp123. [DOI] [PMC free article] [PubMed] [Google Scholar]
- 41.Krasuski JS, Alexander GE, Horwitz B, Daly EM, Murphy DG, Rapoport SI, Schapiro MB. Volumes of medial temporal lobe structures in patients with Alzheimer's disease and mild cognitive impairment (and in healthy controls) Biol Psychiatry. 1998 Jan 1;43(1):60–8. doi: 10.1016/s0006-3223(97)00013-9. [DOI] [PubMed] [Google Scholar]
- 42.Morris JC. Mild Cognitive Impairment is early-stage Alzheimer disease. Arch Neurol. 2006;63:15–16. doi: 10.1001/archneur.63.1.15. [DOI] [PubMed] [Google Scholar]