

Abstract
This study investigated whether symptoms of depression and cognitive dysfunction predicted all-cause mortality in long-term care (LTC) residents at 12 months after admission. Participants were 171 adults with a mean age of 77 in an urban LTC setting (51% African American and 49% European American). The Geriatric Depression Scale and the Dementia Rating Scale, Second Edition (DRS–2), were administered upon admission, and demographic variables and the Charlson Comorbidity Index were also recorded. Cox regression analyses found that increased depressive symptoms, lower performance on the DRS–2, and European American ethnicity were significant predictors of all-cause mortality. The overall results suggest that the combination of cognitive dysfunction and depressive symptoms can increase the chances of 12-month, all-cause mortality in LTC settings.
Keywords: all-cause mortality, cognition, depression, African American, long-term care
Approximately 1.8 million individuals reside in long-term care (LTC) facilities across the United States, and it is expected that about 85% of these individuals will die while in this setting (Beers, 2004). For those placed into an LTC facility, the presence of depressive symptoms can impair functioning and possibly hasten mortality (Rovner, 1993; Rovner et al., 1991). Lichtenberg (1998) noted that those with increased levels of depressive symptoms tend to have poorer self-care, which can lead to behaviors and functioning that are detrimental and that can interfere with health. A number of other factors, including cognitive functioning, have been found to be related to older adults’ mortality during placement into LTC. This study investigated cognition and depressive symptoms as predictors of 12-month, all-cause mortality for newly admitted LTC residents.
Medical problems for LTC residents (e.g., malnutrition, diabetes, cardiovascular diseases) are most clearly associated with mortality for those with Alzheimer’s disease (Gambassi et al., 1999). In addition, dementia, an abnormal heartbeat, Parkinson’s disease, cancer, and infection of the lungs (van Dijk, Dippel, van der Meulen, & Habbema, 1996), along with decreased nutrition, lower activities of daily living (ADL) functioning, and older age, have been found to be significant predictors of mortality (Sund-Levander, Grodzinsky, & Wahren, 2007). Both the number and seriousness of medical conditions (Ancoli-Israel, Klauber, Kripke, Parker, & Cobarrubias, 1989; Sund-Levander et al., 2007; van Dijk et al., 1996) contribute to an increasing chance of mortality for LTC residents.
Mental health and cognitive dysfunction can also predict mortality. Shah, Phongsathorn, George, Bielawska, and Katona (1993) found that in LTC residents symptoms of depression were the only significant predictor of mortality, whereas level of independence and a dementia diagnosis were not significant predictors. Also in this population, both depressive symptoms and self-esteem ratings were significant predictors of mortality (O’Connor & Vallerand, 1998; Rovner et al., 1991). Additionally, increased depressive symptomatology depresses immune system functioning, which can also raise the risk of mortality (Small & Backman, 1997). Impaired cognitive functioning (Cohen-Mansfield, Marx, Lipson, & Werner, 1999; St. John, Montgomery, Kristijansson, & McDowell, 2002) has been found to significantly predict mortality in LTC residents. These studies consistently offer evidence of depressive symptoms and cognitive dysfunction independently predicting mortality in LTC settings. To our knowledge, no studies have investigated both variables as predictors of mortality in LTC.
Past studies have involved primarily European American participants, but the current study included a sample in which more than half of the participants were African American. African Americans have been shown to have higher levels of medical problems (Hassaballa, Gorelick, West, Hansen, & Adams, 2001; Lynch, Leurgans, Raman, Barboi, & Gorelick, 2001) and depressive symptoms (Jonas & Mussolino, 2000) than European Americans have; thus, it is especially important to investigate relationships between depressive symptoms and medical problems among African Americans. Additionally, it may be possible that the relationship of depression and cognitive functioning with 12-month all-cause mortality differs between these two ethnic groups. For instance, African Americans have been shown to manifest depressive symptoms more physically (e.g., through changes in appetite and weight loss) than European Americans do (Brown, Schulberg, & Madonia, 1996). These physical symptoms may interfere with health and suggest that the relationship between depression and all-cause mortality may differ between these two ethnic groups. Also, given the differential performance of African American and European American older adults on neuropsychological measures (Manly, 2006), it is possible that measures of cognition perform differently as predictors in these two ethnic groups.
In the current study, it was hypothesized that measures of cognitive functioning and depression would significantly predict all-cause mortality in LTC residents within 12 months. It was also hypothesized that there would be an interaction between ethnicity and cognitive functioning associated with 12-month, all-cause mortality rates. This hypothesis was based on the frequent finding in the literature that African American and European American patients often perform differently on neuropsychological tests.
Method
Participants
Participants were 171 adults over age 60 consecutively admitted to an LTC facility in a Midwest urban area. They had a mean age of 77.1 years (SD = 8.8 years, range = 60–96 years), with 10.6 years of education (SD = 3.3 years), and 61.4% were female. Of those sampled, 50.9% were African American and 49.1% were European American. Participants had a mean score of 1.58 on the Comorbidity Index (SD = 1.85, range = 0–9; see Table 1).
Table 1.
Means and Standard Deviations of Participant Demographics and Test Data by Ethnicity
| Variable | African Americans (n = 87)
|
European Americans (n = 84)
|
||
|---|---|---|---|---|
| M (SD)/% (n) | Range | M (SD)/% (n) | Range | |
| Age | 77.8 (8.4) | 60–96 | 76.3 (9.1) | 60–94 |
| Education | 10.1 (3.4) | 2–20 | 11.0 (3.1) | 0–18 |
| CMI | 1.4 (1.6) | 0–9 | 1.8 (2.1) | 0–9 |
| DRS–2* | 100.35 (21.49) | 57–139 | 107.38 (20.91) | 59–142 |
| GDS | 11.25 (6.46) | 1–24 | 11.51 (6.39) | 0–24 |
| Mortality** | 24% (n = 21) | 33% (n = 28) | ||
Note. Age and education are measured in years. N = 171. CMI = Comorbidity Index; DRS–2 = Dementia Rating Scale, Second Edition; GDS = Geriatric Depression Scale; Mortality = 12-month all-cause mortality.
Significantly different, p < .05.
Significantly different, p < .01.
Measures
Geriatric Depression Scale (GDS)
This is a 30-item self-report measure of depressive symptoms designed for use with older adults (Yesavage et al., 1982). This measure consists of yes/no questions, in which individuals answer questions on how they have been feeling over the past week. Scores can total to 30 (1 point possible for each question), and higher scores indicate the presence of more depressive symptoms. A score over 10 indicates mild depression, and a score over 20 indicates more severe depression. Mui (1996) reported that this measure has adequate internal consistency, test–retest reliability, and concurrent validity with other measures of depressive symptoms. In the current study, the Cronbach’s alpha coefficient was .88, indicating high internal consistency. Additionally, this measure had high internal consistency for both African Americans and European Americans (r = .89 and .88, respectively) in this sample.
Dementia Rating Scale, Second Edition (DRS–2)
This scale was created for the purpose of assessing cognitive functioning in people with diagnosed or suspected dementia (Mattis, 1988). A second edition (Jurica, Leitten, & Mattis, 2001) contains an improved manual, scoring booklet, and norms, but the test itself is unchanged. Scores can total to 144, and lower scores on this measure indicate increased cognitive dysfunction. This measure has been shown to have adequate internal consistency (Vitaliano et al., 1984) and test–retest reliability (Smith et al., 1994). After eight participants who scored more than two standard deviations from the mean were removed, the distribution of the DRS–2 was examined and found not to have significant skew or kurtosis. A large proportion of the sample (82%) scored in the impaired range as defined by a cut score of 121, the score found by Yochim, Bank, Mast, MacNeill, and Lichtenberg (2003) to have the highest clinical utility in a sample with a similar demographic background.
Comorbidity Index (CMI)
This measure, also known as the Charlson Comorbidity Index, was developed by assessing what combination of medical diagnoses best predicted 1-year mortality in a group of hospitalized patients (Charlson, Pompei, Ales, & MacKenzie, 1987). It is a weighted combination of chronic diseases that was originally created for use in predicting mortality. One advantage of the CMI is that it can be abstracted from medical record databases. The CMI is both sensitive to severity of different diseases and efficient to collect. It was originally developed by ascertaining what combination of diagnoses best predicted 1-year mortality in a group of hospitalized patients (Charlson et al., 1987). Diseases significantly associated with mortality were identified, and weights equivalent to adjusted relative risks were assigned. The CMI was validated on a cohort of 685 medical patients by prediction of 1-year survival; it accounted for a greater proportion of the deaths due to comorbid conditions than a simple measure of number of coexisting conditions alone. Weights given to diseases consist of a weight of 1 for conditions such as congestive heart failure or diabetes, 2 for conditions such as moderate or severe kidney disease or lymphoma, 3 for moderate or severe liver disease, or 6 for metastatic solid tumor. Scores on the CMI typically range from 1 to 3 but can range to 9 or higher. Scores of 3 or higher indicate the presence of several major health problems. Thus, a score of 2 should be seen as indicating significantly complicated comorbid medical illness. The CMI is a commonly used measure of medical burden (Deyo, Cherkin, & Ciol, 1992) and is a valid predictor of disability and mortality among older adults (Di Bari et al., 2006).
Procedures
Participants were administered the GDS and DRS–2 an average of 12 days after admission by a master’s-level clinical psychology graduate student, and the CMI score was based on the attending physicians’ diagnoses. All-cause mortality was assessed 12 months after admission, regardless of the participant’s current residential status. LTC facility notes were reviewed and, if patients were discharged, caregivers were contacted by phone for assessment of the participants’ current status. All-cause mortality data were gathered on the entire sample; thus, there are no missing data for this variable.
Statistical Analyses
Correlations, presented in Table 2, were calculated among demographic variables of age, education, sex, and ethnicity; CMI, GDS, and DRS–2 data; and all-cause mortality at 12 months. It was thought that age, ethnicity, and CMI scores would be related to all-cause mortality, and thus they were entered into Block 1 of a Cox regression analysis. GDS and DRS–2 scores were entered in Block 2. Cox regression analysis was conducted with all-cause mortality as the dependent variable. Odds ratios (ORs) were used to calculate effect size. With this sample size, there was enough power to detect a moderate-to-large effect size (Faul, Erdfelder, Lang, & Buchner, 2007).
Table 2.
Correlations for Participant Demographics and the CMI, GDS, and DRS–2 Data With 12-Month, All-Cause Mortality
| Variable | 1 | 2 | 3 | 4 | 5 | 6 | 7 | 8 |
|---|---|---|---|---|---|---|---|---|
| 1. Age | — | |||||||
| 2. Sex | −.11 | — | ||||||
| 3. Education | −.26** | −.05 | — | |||||
| 4. Ethnicity | −.09 | .06 | .14 | — | ||||
| 5. CMI | −.11 | .10 | .06 | .09 | — | |||
| 6. GDS | .06 | .06 | −.12 | .02 | .07 | — | ||
| 7. DRS–2 | −.34** | −.02 | .30** | .16* | .02 | −.01 | — | |
| 8. Mortality | .14* | .14 | .10 | .13 | −.02 | .16* | −.20** | — |
Note. N = 171. CMI = Comorbidity Index; DRS–2 = Dementia Rating Scale, Second Edition; GDS = Geriatric Depression Scale; Mortality = 12-month all-cause mortality (n = 49).
p ≤ .05.
p < .01.
Both the GDS and the DRS–2 were completed by 179 participants. Those who scored more than two standard deviations from the mean on the GDS or DRS–2 were excluded from all analyses to remove outliers and make the distributions more normal. Eight participants were excluded as a result, bringing the sample size to 171.
Results
Of the participants, 1 year after admission, 24.6% were living in the same (present) facility (n = 42), 28.7% were deceased (n = 49), 5.3% were hospitalized (n = 9), 30.4% were living at home (n = 52), 2.3% were in an assisted living facility (n = 4), 7.0% had moved to another nursing home (n = 12), and 1.8% were in a hospice (n = 3). At 12 months, there were no statistically significant differences between African American and European Americans with regard to who remained a resident at the present facility, who had been hospitalized, who was in assisted living, or who was at another LTC facility. Both groups were equally likely to have returned home after 1 year. Also, DRS–2 and CMI scores did not distinguish those who returned home and those who did not.
In Block 1 of the Cox regression analysis, neither age, nor ethnicity, nor CMI scores were significant predictors of 12-month, all-cause mortality. In Block 2, lower scores on the DRS–2, Wald = 5.00, p = .05, OR = 0.98, 95% CI [0.97, 1.00], and higher scores on the GDS, Wald = 3.89, p < .05, OR = 1.04, 95% CI [1.00, 1.09], were significant predictors of 12-month, all-cause mortality. Ethnicity approached significance as a predictor in the Block 2 of the regression, Wald = 3.47, p = .06, OR = 0.58, 95% CI [0.32, 1.03], with European Americans at greater risk of 12-month, all-cause mortality. Block 2 is summarized in Table 3.
Table 3.
Summary of Cox Regression Analysis for Variables Predicting All-Cause Mortality 12 Months Postadmission
| Variable | B | SE | Wald | df | p | OR | 95% CI |
|---|---|---|---|---|---|---|---|
| Age | .02 | .02 | 0.74 | 1 | .39 | 1.02 | [0.98, 1.05] |
| Ethnicity | −.55 | .30 | 3.47 | 1 | .06 | 0.58 | [0.32, 1.03] |
| CMI | −.04 | .08 | 0.24 | 1 | .63 | 0.96 | [0.83, 1.12] |
| DRS–2 | −.02 | .01 | 5.00 | 1 | .03 | 0.98 | [0.97, 1.00] |
| GDS | .04 | .02 | 3.89 | 1 | .05 | 1.04 | [1.00, 1.09] |
Note. N = 171. 12-month, all-cause mortality (n = 49). SE = standard error; df = degrees of freedom; OR = odds ratio; CI = confidence interval; CMI = Comorbidity Index; DRS–2 = Dementia Rating Scale, Second Edition; GDS = Geriatric Depression Scale.
A second Cox regression was conducted to see if there was an interaction between DRS–2 and ethnicity in the prediction of 12-month, all-cause mortality. DRS–2 scores were centered around the mean for this regression in order to properly test for interaction effects through Cox regression. That is, scores were converted into the mean score subtracted from each participant’s score. In this regression, lower centered DRS–2 scores, Wald = 5.00, p < .05, OR = 0.98, 95% CI [0.97, 1.00], and higher GDS scores, Wald = 3.89, p < .05, OR = 1.04, 95% CI [1.00, 1.09], again predicted 12-month, all-cause mortality in Block 2. When the interaction term (DRS–2 × Ethnicity) was entered in Block 3, both the DRS–2 and the GDS became nonsignificant predictors (p > .05), and the interaction term was not significant (p = .22). In this final block of this regression, however, European American ethnicity became a significant predictor of 12-month, all-cause mortality, Wald = 4.35, p < .05, OR = 0.50, 95% CI [0.26, 0.96] (see Table 4). Survival functions are depicted in Figures 1 and 2.
Table 4.
Summary of Cox Regression Analysis for Variables, Including Interaction Term, Predicting All-Cause Mortality 12 Months Postadmission
| Variable | B | SE | Wald | df | p | OR | 95% CI |
|---|---|---|---|---|---|---|---|
| Age | .02 | .02 | 0.90 | 1 | .34 | 1.02 | [0.98, 1.05] |
| Ethnicity | −.69 | .33 | 4.35 | 1 | .04 | 0.50 | [0.26, 0.96] |
| CMI | −.03 | .08 | 0.14 | 1 | .71 | 0.97 | [0.83, 1.13] |
| DRS–2 (centered) | −.01 | .01 | 0.71 | 1 | .40 | 0.99 | [0.97, 1.01] |
| GDS | .04 | .02 | 3.26 | 1 | .07 | 1.04 | [1.00, 1.09] |
| DRS–2 × Ethnicity | −.02 | .01 | 1.52 | 1 | .22 | 0.98 | [0.96, 1.01] |
Note. N = 171. 12-month, all-cause mortality (n = 49). SE = standard error; df = degrees of freedom; OR = odds ratio; CI = confidence interval; CMI = Comorbidity Index; DRS–2 = Dementia Rating Scale, Second Edition; GDS = Geriatric Depression Scale.
Figure 1.

Overall survival function at mean of covariates.
Figure 2.
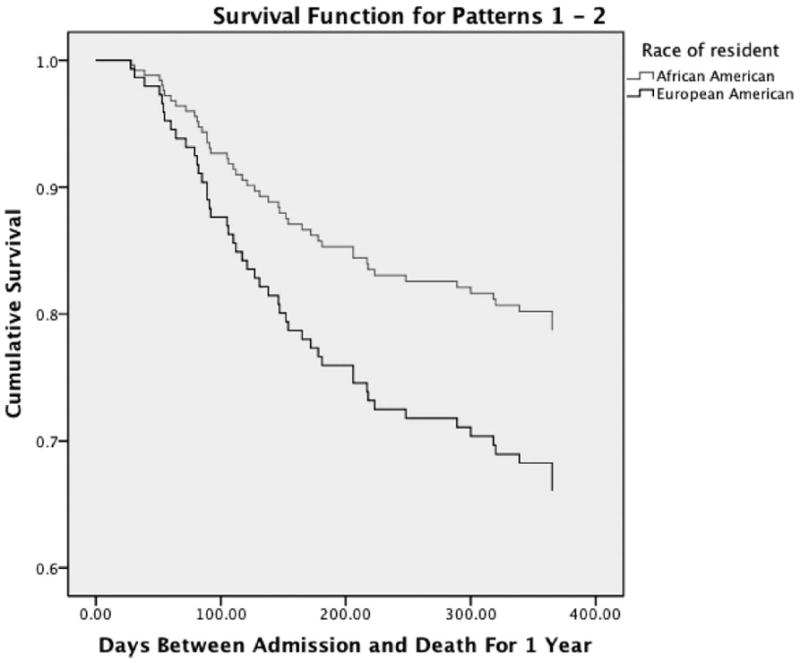
Survival function by ethnic group.
The same Cox regression analyses were run with a subset of the total sample, comparing those who remained in the current LTC facility with those who were deceased at the end of 12 months. That is, participants who were alive but had moved into another setting were excluded. This analysis included the 42 participants who were in living in the present facility, three participants receiving hospice care in the facility, and the 49 participants who were deceased, for a total of 94. In the first Cox regression analysis, in Block 1, neither age, nor ethnicity, nor CMI scores were significant predictors of 12-month, all-cause mortality. In Block 2, higher scores on the GDS, Wald = 4.87, p < .05, OR = 1.05, 95% CI [1.01, 1.10], were a significant predictor of 12-month, all-cause mortality. Ethnicity, specifically being European American, also became a significant predictor of 12-month, all-cause mortality in Block 2, Wald = 4.50, p < .05, OR = 0.53, 95% CI [0.29, 0.95]. In the second Cox regression with this subset of the sample, age, ethnicity, and CMI scores were again not significant predictors of 12-month, all-cause mortality in Block 1. In Block 2, higher scores on the GDS, Wald = 4.87, p < .05, OR = 1.05, 95% CI [1.00, 1.10], were a significant predictor of 12-month, all-cause mortality. In Block 3, the interaction term (DRS–2 Centered Scores × Ethnicity) was not significant (p = .21). Higher scores on the GDS remained a significant predictor, Wald = 3.77, p = .05, OR = 1.04, 95% CI [1.00, 1.09], and European American ethnicity became a significant predictor, Wald = 5.42, p < .05, OR = 0.45, 95% CI [0.23, 0.88], for 12-month, all-cause mortality.
Discussion
This study found evidence that depressive symptoms are strong predictors of mortality in LTC. Overall, increased depressive symptoms, lower cognitive functioning, and European American ethnicity were significant predictors of 12-month, all-cause mortality.
The relationship found between cognitive functioning and 12-month, all-cause mortality is similar to that found in past research (Cohen-Mansfield et al., 1999; Royall, Chiodo, Mouton, & Polk, 2007; St. John et al., 2002). The DRS–2 is one measure of general cognitive functioning, and poor performance may be related to changes and decline throughout the brain. In an LTC setting, cognitive functioning may be a robust predictor, because dysfunction can impair one’s ability to complete ADLs (e.g., eating adequately, transferring from bed to chair), as well as one’s ability to engage in safety precautions (e.g., preventing falls). Thus, changes in cognitive functioning may possibly further endanger physical safety.
In addition, findings suggest that increased depressive symptomatology was related to 12-month, all-cause mortality in this population, which is consistent with past research (Arfken, Lichtenberg, & Tancer, 1999; O’Connor & Vallerand, 1998; Rovner et al., 1991). When we included only participants who remained in the LTC facility or who were deceased, depressive symptoms remained a significant predictor, whereas cognitive functioning was not significant. This highlights the importance of the relationship between depressive symptoms and risk of mortality in this population. Increased depressive symptomatology may lead to poorer self-care, grooming, physical activity, and eating and/or drinking behaviors, as well as decreased immune system functioning (Adler & Matthews, 1994; Cohen & Herbert, 1996; Maier, Watkins, & Fleshner, 1994; Small & Backman, 1997), which may all increase one’s chances of all-cause mortality in an LTC setting.
European American ethnicity was a significant predictor of 12-month, all-cause mortality. In Cox regression analyses, ethnicity had a small-to-medium effect size, in which European Americans were approximately twice as likely to expire within 1 year of admission into an LTC setting. European American ethnicity also was a significant predictor in an analysis that excluded people who had been discharged from the LTC facility. These findings were unexpected, and they generate the question of why European Americans were at greater risk than African Americans of 12-month, all-cause mortality in this LTC setting. Both groups were equivalent in age, medical burden, and depressive symptoms, so it is possible that there were other differences between the groups, undetected by this study, that led European Americans to experience a greater risk of 12-month, all-cause mortality. For instance, the European Americans in this study likely had less social support than the African Americans in this study and than European Americans in other studies, and social support has been shown to be related to mortality (Cohen-Mansfield et al., 1999). In addition, there may have been differences in physical health that were not detected by the CMI (e.g., severity of a given health problem like congestive heart failure) and that relate to mortality. This finding merits replication and exploration in future studies.
When we compared current residents of the LTC facility to those who were deceased, only European American ethnicity and depressive symptoms were significant predictors of 12-month, all-cause mortality. The results were similar when the interaction between ethnicity and DRS–2 scores were added, with ethnicity and depressive symptoms again being significant predictors of 12-month, all-cause mortality. Thus, our hypothesis that depressive symptoms would predict all-cause mortality at 12 months was supported with this subset of the total sample.
This study has a few strengths. First, this study investigated both depressive symptoms and cognitive dysfunction as predictors of 12-month, all-cause mortality in an LTC sample and found them both to be significant, whereas prior studies that investigated both variables (Arfken et al., 1999; Royall et al., 2007) were conducted in community samples. Second, over half of the participants in this sample were African Americans. Third, for the dependent variable, 12-month, all-cause mortality, there were no missing data, as all participants were all successfully followed for this variable. This study would benefit from the addition of multiple cognitive assessment measures; yet with a frail population, such as those in LTC facilities, measures need to be extremely brief to prevent fatigue and ensure participation. A surprising finding was that the CMI did not predict 12-month, all-cause mortality. This may have been due to the lack of variance on this measure in our sample.
Possible directions for future research include extending the current study beyond 12 months for a longer time frame, to assess if depressive symptoms and cognitive functioning are still significant predictors for all-cause mortality in this population. As only 28.7% (n = 49) of our sample had expired within 12 months, it would be beneficial to investigate predictors of all-cause mortality after a higher percentage of the sample had expired. However, this was not possible to accomplish. Also, with a longer time frame it may be possible to see if changes in either depression or cognitive functioning are predictive of all-cause mortality. Furthermore, additional cognitive and mental health variables, such as memory, visuospatial functioning, and anxiety, could be assessed and analyzed for relations with all-cause mortality in LTC residents. Additionally, increasing the sample size may increase the statistical power to detect smaller significant effect sizes. Another goal for future research would be to determine if impairment in ADLs mediates the relationship between depression or cognition and all-cause mortality. That is, it is possible that depression and cognitive impairment lead to decline in ADLs, and it may be the decline in ADLs that specifically leads to all-cause mortality.
In summary, cognitive functioning and depressive symptoms are related to survival upon entering an LTC facility. Assessment can lead to treatment of these problems, and appropriate interventions (e.g., to ensure safety, to increase exercise and dietary intake) may lessen the risk of premature mortality in this population. These results support the use of entrance screening for LTC residents, specifically for both depressive symptomatology and cognitive dysfunction.
Contributor Information
Katherine D. Kane, Department of Psychology, University of Colorado at Colorado Springs
Brian P. Yochim, Department of Psychology, University of Colorado at Colorado Springs
Peter A. Lichtenberg, Institute of Gerontology and Department of Psychology, Department of Psychiatry and Behavioral Neuroscience and Department of Physical Medicine and Rehabilitation, Wayne State University
References
- Adler N, Matthews K. Health psychology: Why do some people get sick and some stay well? Annual Review of Psychology. 1994;45:229–259. doi: 10.1146/annurev.ps.45.020194.001305. [DOI] [PubMed] [Google Scholar]
- Ancoli-Israel S, Klauber M, Kripke D, Parker L, Cobarrubias M. Sleep apnea in female patients in a nursing home: Increased risk of all-cause mortality. Chest. 1989;96:1054–1058. doi: 10.1378/chest.96.5.1054. [DOI] [PubMed] [Google Scholar]
- Arfken CL, Lichtenberg PA, Tancer ME. Cognitive impairment and depression predict all-cause mortality in medically ill older adults. Journal of Gerontology, Series A: Biological Sciences and Medical Sciences. 1999;54:152–156. doi: 10.1093/gerona/54.3.m152. [DOI] [PubMed] [Google Scholar]
- Beers M, editor. The Merck manual of health & aging. New York, NY: Ballantine Books; 2004. [Google Scholar]
- Brown C, Schulberg H, Madonia M. Clinical presentations of major depression by African Americans and whites in primary medical care practice. Journal of Affective Disorders. 1996;41:181–191. doi: 10.1016/S0165-0327(96)00085-7. [DOI] [PubMed] [Google Scholar]
- Charlson M, Pompei P, Ales K, MacKenzie C. A new method of classifying prognostic comorbidity in longitudinal studies: Development and validation. Journal of Chronic Diseases. 1987;40:373–383. doi: 10.1016/0021-9681(87)90171-8. [DOI] [PubMed] [Google Scholar]
- Cohen S, Herbert T. Health psychology: Psychological factors and physical diseases from the perspective of human psychoneuroimmunology. Annual Review of Psychology. 1996;47:113–142. doi: 10.1146/annurev.psych.47.1.113. [DOI] [PubMed] [Google Scholar]
- Cohen-Mansfield J, Marx M, Lipson S, Werner P. Predictors of all-cause mortality in nursing home residents. Journal of Clinical Epidemiology. 1999;52:273–280. doi: 10.1016/S0895-4356(98)00156-5. [DOI] [PubMed] [Google Scholar]
- Deyo R, Cherkin D, Ciol M. Adapting a clinical comorbidty index for use with ICD-9-CM administration databases. Journal of Clinical Epidemiology. 1992;45:613–619. doi: 10.1016/0895-4356(92)90133-8. [DOI] [PubMed] [Google Scholar]
- Di Bari M, Virgillo A, Matteuzzi D, Inzitari M, Mazzaglia G, Pozzi C, Pini R, et al. Predictive validity of measures of comorbidity in older community dwellers: The Insufficienza Cardiaca negli Anziani Residenti a Dicomano study. Journal of the American Geriatrics Society. 2006;54:210–216. doi: 10.1111/j.1532-5415.2005.00572.x. [DOI] [PubMed] [Google Scholar]
- Faul F, Erdfelder E, Lang A-G, Buchner A. G*Power 3: A flexible statistical power analysis program for the social, behavioral, and biomedical sciences. Behavior Research Methods. 2007;39:175–191. doi: 10.3758/bf03193146. [DOI] [PubMed] [Google Scholar]
- Gambassi G, Lapane K, Landi F, Sgadari A, Mor V, Bernabei R. Sex differences in the relation between comorbidity and all-cause mortality of patients with Alzheimer’s disease. Neurology. 1999;53:508–516. doi: 10.1212/wnl.53.3.508. [DOI] [PubMed] [Google Scholar]
- Hassaballa H, Gorelick PB, West CP, Hansen MD, Adams HP. Ischemic stroke outcome: Racial differences in the trial of danaparoid in acute stroke (TOAST) Neurology. 2001;57:691–697. doi: 10.1212/wnl.57.4.691. [DOI] [PubMed] [Google Scholar]
- Jonas BS, Mussolino ME. Symptoms of depression as a prospective risk factor for stroke. Psychosomatic Medicine. 2000;62:463–471. doi: 10.1097/00006842-200007000-00001. [DOI] [PubMed] [Google Scholar]
- Jurica PJ, Leitten CL, Mattis S. Dementia Rating Scale–2. Odessa, FL: Psychological Assessment Resources; 2001. [Google Scholar]
- Lichtenberg P. Mental health practice in geriatric health care settings. Binghamton, NY: Haworth Press; 1998. [Google Scholar]
- Lynch G, Leurgans S, Raman R, Barboi A, Gorelick P. A comparison of stroke risk factors in patients enrolled in stroke prevention trials. Journal of the National Medical Association. 2001;93(3):76–86. [PMC free article] [PubMed] [Google Scholar]
- Maier SF, Watkins LR, Fleshner M. Psychoneuroimmunology: The interface between behavior, brain, and immunity. American Psychologist. 1994;49:1004–1017. doi: 10.1037/0003-066X.49.12.1004. [DOI] [PubMed] [Google Scholar]
- Manly JJ. Cultural issues. In: Attix DK, Welsh-Bohmer KA, editors. Geriatric neuropsychology: Assessment and intervention. New York, NY: Guilford Press; 2006. pp. 198–222. [Google Scholar]
- Mattis S. Dementia Rating Scale: Professional manual. Odessa, FL: Psychological Assessment Resources; 1988. [Google Scholar]
- Mui A. Geriatric Depression Scale as a community screening instrument for elderly Chinese immigrants. International Psychogeriatrics. 1996;8:445–458. doi: 10.1017/S1041610296002803. [DOI] [PubMed] [Google Scholar]
- O’Connor BP, Vallerand RJ. Psychological adjustment variables as predictors of all-cause mortality among nursing home residents. Psychology and Aging. 1998;13:368–374. doi: 10.1037/0882-7974.13.3.368. [DOI] [PubMed] [Google Scholar]
- Rovner BW. Depression and increased risk of all-cause mortality in the nursing home patient. American Journal of Medicine. 1993;94(Suppl. 5A):19–22. [PubMed] [Google Scholar]
- Rovner BW, German PS, Brant LJ, Clark R, Burton L, Folstein MF. Depression and all-cause mortality in nursing homes. JAMA. 1991;265:993–996. doi: 10.1001/jama.265.8.993. [DOI] [PubMed] [Google Scholar]
- Royall DR, Chiodo LK, Mouton C, Polk MJ. Cognitive predictors of all-cause mortality in elderly retirees: Results from the Freedom House study. American Journal of Geriatric Psychiatry. 2007;15:243–251. doi: 10.1097/01.JGP.0000240824.84867.02. [DOI] [PubMed] [Google Scholar]
- Shah A, Phongsathorn V, George C, Bielawska C, Katona C. Does psychiatric morbidity predict all-cause mortality in continuing care geriatric inpatients? International Journal of Geriatric Psychiatry. 1993;8:255–259. doi: 10.1002/gps.930080309. [DOI] [Google Scholar]
- Small BJ, Backman L. Cognitive correlates of all-cause mortality: Evidence from a population based sample of very old adults. Psychology and Aging. 1997;12:309–313. doi: 10.1037/0882-7974.12.2.309. [DOI] [PubMed] [Google Scholar]
- Smith GE, Ivnik RJ, Malec JF, Kokmen E, Tangalos EG, Petersen RC. Psychometric properties of the Mattis Dementia Rating Scale. Assessment. 1994;1:123–131. doi: 10.1177/1073191194001002002. [DOI] [PubMed] [Google Scholar]
- St. John PD, Montgomery PR, Kristijansson B, McDowell I. Cognitive scores, even within the normal range, predict death and institutionalization. Age and Ageing. 2002;31:373–378. doi: 10.1093/ageing/31.5.373. [DOI] [PubMed] [Google Scholar]
- Sund-Levander M, Grodzinsky E, Wahren L. Sex differences in predictors of survival in elderly nursing-home residents: A 3-year follow up. Scandinavian Journal of Caring. 2007;21:18–24. doi: 10.1111/j.1471-6712.2007.00431.x. [DOI] [PubMed] [Google Scholar]
- van Dijk P, Dippel D, van der Meulen J, Habbema J. Comorbidity and its effects on all-cause mortality in nursing home patients with dementia. Journal of Nervous and Mental Disease. 1996;184:180–187. doi: 10.1097/00005053-199603000-00007. [DOI] [PubMed] [Google Scholar]
- Vitaliano PP, Breen AR, Russo J, Albert M, Vitiello M, Prinz PN. The clinical utility of the Dementia Rating Scale for assessing Alzheimer’s patients. Journal of Chronic Disabilities. 1984;37:743–753. doi: 10.1016/0021-9681(84)90043-2. [DOI] [PubMed] [Google Scholar]
- Yesavage J, Brink T, Rose T, Lum O, Huang V, Adez M, Leirer V. Development and validation of a geriatric depression screening scale: A preliminary report. Journal of Psychiatric Research. 1983;17:37–49. doi: 10.1016/0022-3956(82)90033-4. [DOI] [PubMed] [Google Scholar]
- Yochim BP, Bank AL, Mast BT, MacNeill SE, Lichtenberg PA. Clinical utility of the Mattis Dementia Rating Scale in older, urban medical patients: An expanded study. Aging, Neuropsychology, and Cognition. 2003;10:230–237. doi: 10.1076/anec.10.3.230.16448. [DOI] [Google Scholar]