

Abstract
The advent of genetically encoded FRET-based kinase activity reporters has ushered in a new era of signal transduction research. Such reporters allow the direct monitoring of kinase activity in live cells at specific locations, providing unprecedented information on the spatiotemporal dynamics of kinase signaling. Specifically, FRET-sensitive conformational changes in the reporters following phosphorylation serve as a direct readout of kinase activity. These genetically encoded reporters allow not only temporal resolution of kinase activity, but also spatial resolution: by fusing appropriate targeting sequences, reporters can be positioned at specific subcellular locations. Herein we present a strategy to generate and target kinase activity reporters to discrete intracellular regions to measure kinase signaling in live cells.
Key terms for indexing: kinase activity reporter, imaging, FRET, localized kinase signaling
INTRODUCTION
Kinase signaling is an essential component of many cellular processes. Phosphorylation of target substrate proteins generally modulates their function by altering their activity, localization or association with other proteins. Thus, measuring kinase activity is integral to understanding cell signaling. The activity of protein kinases is most commonly assessed by immunoblotting with a phospho-specific antibody toward the phosphorylated substrate protein. However, this approach has limitations. It is becoming increasingly clear that signaling events often occur at the subcellular level and the spatiotemporal resolution of these events, as measured using conventional methods, is limited to the time resolution of the assay as well as the success of cell fractionation methods. Another common approach to assessing the activation state of a kinase is to immunoblot using phospho-specific antibodies made to sites on the kinase described to indicate kinase activation. This is also an imperfect measure as there may be other means of kinase activation, or even inactivating phosphorylations, neither of which is reflected when analyzing a specific site. Genetically-encoded reporters overcome many of these problems, allowing visualization of activity in real time at precise intracellular locations.
REPORTER DESIGN
The archetypal model for a FRET-based reporter for measuring kinase activity has the modular design indicated in Figure 1. Specifically, the reporter comprises a phosphorylation sensor [phosphopeptide-binding domain (PBD) and a substrate sequence] that is flanked by a FRET donor/acceptor pair. In designing reporters, an appropriate consensus substrate sequence for the kinase to be monitored is the foremost decision. To achieve specificity of the reporter, this sequence must be readily phosphorylated by the kinase of interest, yet not readily recognized by other kinases. This sequence is placed adjacent to a phosphoamino acid binding domain which, when the consensus sequence is phosphorylated, undergoes intramolecular complexation resulting in a conformational change of the kinase activity reporter. This change alters the distance and/or orientation between the selected FRET pair that bracket the substrate sequence and phosphoamino acid binding domain, thus resulting in a change in FRET that can be monitored in live cells. Note that some reporters display an increase in FRET upon phosphorylation by the relevant kinase (Figure 1A; Zhang et al., 2001) whereas others undergo a loss of FRET following phosphorylation (Figure 1B; Violin et al., 2003).
Figure 1.

Schematic diagram showing the modular structure of kinase activity reporters. Kinase activity reporters consist of a FRET donor (e.g. CFP), a phosphoamino acid binding domain (PBD), a consensus phosphorylation sequence (substrate peptide), and a FRET acceptor (e.g. YFP). The FRET pair is at a distance and orientation with respect to one another that changes once the substrate peptide is phosphorylated (circle with P) by the kinase; following phosphorylation, the PBD binds to the phosphorylated sequence resulting in a conformational change that alters FRET between the FRET donor and FRET acceptor. Depending on the reporter construct, phosphorylation can cause an increase (a) or decrease (b) in FRET.
STRATEGIC PLANNING
Identifying a suitable consensus sequence
There are many approaches one can take in designing a consensus sequence. First, a sequence derived from a prominent substrate of the kinase of interest can be chosen and, if needed, further modified. This approach was used successfully in the development of isozyme-specific kinase activity reporters for protein kinase C (PKC) (Kajimoto and Newton, in preparation). The sequence of a known substrate is used and then a series of amino acid additions, deletions or substitutions are made to optimize phosphorylation by the kinase of interest and reduce phosphorylation by other kinases. The specificity of the sequence can be assessed in the context of the reporter via live cell imaging (see below) or in vitro (see Troubleshooting). While time consuming (these isozyme-specific PKC reporters underwent over 30 permutations each), this approach can produce a very specific kinase activity reporter.
A second approach involves identifying a consensus phosphorylation sequence in silico and there are a number of databases that have consolidated information about known kinase substrates. KinasePhos (kinasephos.mbc.nctu.edu.tw) is one such database that presents a weighted picture of the sequence requirements for phosphorylation by specific kinases. Phospho.ELM (phospho.elm.eu.org), PhosphoMotif finder (www.hprd.org/PhosphoMotif_finder), Scansite (scansite.mit.edu) and PhosphoSite Plus (www.phosphosite.org) are other sites that employ different algorithms to create databases of known substrate sequences of kinases.
Finally, the most informative approach is an unbiased method using a combinatorial peptide library to determine optimal amino acids at positions N-terminal and C-terminal to the site of phosphorylation (Turk et al., 2006). Here, biotinylated peptides are synthesized in which, for each of the assayed positions surrounding the phosphoacceptor site, a single amino acid is fixed; the other positions contain a mixture of all amino acids except serine, threonine or tyrosine such that the only phosphorylatable residue within the peptide is the phosphoacceptor site. These peptides are incubated in solution with radioactive ATP and the kinase and then spotted onto a streptavidin membrane. Phosphorylation of the peptide mixtures is then quantified using a phosphorimager. Using this assay, the data yield a thorough picture of the sequence preferences surrounding the phosphorylation site, both favorable and unfavorable, that are recognized by the purified kinase.
All of these methods for selecting a consensus substrate sequence suffice for kinases that efficiently phosphorylate their substrates. However, some kinases have additional requirements for phosphorylation of substrates, notably docking motifs. Thus, for example, in the design of the kinase activity reporter for ERK, a docking domain for ERK was included on its C-terminus (Sato et al., 2007).
After having settled on a sequence, it is critical to determine if any other kinases may recognize and potentially phosphorylate the sequence. There are a number of databases that predict which kinases will phosphorylate a specific sequence using computational methods. The substrate sequence information can be uploaded into programs such as Scansite, as well as some of the other programs listed above, which will return with a series of potential kinases that are predicted to phosphorylate the input sequence. From here, one can experimentally check the specificity of the kinase activity reporter against these identified kinases.
Choosing a phosphoamino acid binding domain
In identifying a suitable substrate sequence to insert into the reporter, one must also consider the sequence requirements for binding of the phosphoamino acid binding domain. The reporter function is based on a conformational change induced following substrate phosphorylation, an event that triggers an intramolecular clamp between the phospho-binding domain and the newly phosphorylated sequence. There are a number of options in choosing such a domain. In the case of a tyrosine kinase activity reporter, Src-homology 2 (SH2) domains or phosphotyrosine binding (PTB) domains serve as the binding moiety. In the case of serine/threonine kinase activity reporters, one can take advantage of the forkhead associated (FHA) domains, 14-3-3 domains as well as some WW domains. One thing to take into consideration in using these latter domains is whether the phosphobinding domains show a preference for serine or threonine phosphorylation. Furthermore, the sequence requirements for binding for some of these domains have been investigated and these requirements must be compatible with the consensus substrate sequence used. For example, the FHA2 domain only binds to phosphorylated threonine residues and shows a strong preference for a leucine or isoleucine at the +3 position (Durocher et al., 2000). In all situations, one must decide whether the reporter is to be reversible allowing one to observe both phosphorylation and de-phosphorylation events (following kinase inactivation or inhibition). In order to have reversible signaling, the affinity of binding needs be high enough to induce the conformational change necessary, but not so high that phosphatases are unable to access and dephosphorylate the reporter. The optimization of the kinase activity reporter for PKA (A Kinase Activity Reporter, AKAR) from its first to its second permutation highlights these considerations. The original AKAR utilized a 14-3-3 PBD to induce a FRET change upon binding the phosphorylated substrate sequence within AKAR; however the binding affinity of this interaction was so high that phosphatases could not readily reverse the reaction (Zhang et al., 2001). The second version of the PKA reporter, AKAR2, utilized the FHA1 PBD which displayed one order of magnitude weaker binding than the 14-3-3 used in AKAR and this new reporter, AKAR2, is now a reversible FRET reporter of PKA activity (Zhang et al., 2005).
Choosing a FRET pair
The FRET pair of choice today is still the combination of two modified green fluorescent proteins (GFPs) that were engineered to fluoresce in the cyan (CFP) and yellow (YFP) wavelengths. Of the CFP and YFP variants, the authors have experience using ECFP and Citrine as the FRET pairs (Griesbeck et al., 2001; Rizzo et al., 2004). GFP exists as a dimer and the tendency for the CFP and citrine variants to dimerize affects the reversibility of the reporter. The introduction of monomeric fluorescent proteins resulted in a faster response of the kinase activity reporter than had been first observed using the parent CFP and YFP (Dunn et al., 2006). While these are the most popular FRET pairs used today, additional modified fluorescent proteins have been engineered from the parent GFP as well as from Discosoma sp. red fluorescent protein (DsRed) (Shaner et al., 2005). Note that a monomer version of DsRed, termed mRFP for monomeric Red Fluorescent Protein, has been constructed (DsRed exists as a tetramer) (Campbell et al., 2002). Indeed there are reports describing FRET between other fluorescent proteins and these could be used in the reporter in place of the CFP and YFP variants (Carlson and Campbell, 2009). More excitingly, the use of dual FRET pairs with non-interfering overlap in their excitation/emission spectra presents the option of imaging two biological processes within the same cell in real time. To begin, however, use of CFP and YFP is recommended (see Table 1); this is the standard FRET pair used to date.
Table 1.
Filter sets used to monitor CFP, FRET and YFP fluorescence
| Fluorochrome | Excitation (nm) | Dichroic mirror (nm) | Emission (nm) |
|---|---|---|---|
| CFP | 420/20 | 450 | 475/40 |
| FRET | 420/20 | 450 | 535/25 |
| YFP | 495/10 | 505 | 535/25 |
Control construct
An important and simple control construct is the reporter construct in which the phosphoacceptor site is mutated to an unphosphorylatable residue; i.e. mutate the respective serine, threonine or tyrosine to an alanine. This reporter should not undergo a FRET ratio change following stimulation of the kinase, as the critical residue is mutated and no longer phosphorylatable by the kinase. It also serves as a negative control in experiments where there is concern that the reporter is physically relocalizing within the cell, or where the cell is changing morphology; situations like these can appear as a change in FRET as the local reporter concentration may change thereby impacting basal intermolecular FRET.
BASIC PROTOCOL
Imaging setup
A number of setups can be used to image FRET-based reporters. The protocol described below is the one used in the authors’ lab to image a number of distinct kinase activity reporters (Gallegos et al., 2006; Kunkel et al., 2005; Violin et al., 2003). The setup includes a Zeiss Axiovert 200M microscope, a Roper Scientific MicroMAX 512BFT CCD camera, a Lambda 10-2 filterwheel shutter controller from Sutter, and is controlled using Metafluor software from Molecular Devices. We acquire fluorescent images at room temperature through a 10% neutral density filter and a 40x/1.3 NA oil-immersion objective with the following filters (Table 1):
Calibration
We calibrated our system to control against photobleaching and determined that we can acquire a series of images (CFP, FRET, YFP) every 10 seconds using the following exposure times: 200 ms for CFP, 200 ms for FRET, 100 ms for YFP. Many parameters are involved so this should be experimentally determined for each imaging setup.
We next calibrated the brightness of the reporter so that we could select cells in which its expression level is within the range of endogenous substrates (~1 μM). This is important as too high a concentration of exogenous reporter could compete with endogenous substrates and perturb normal cell signaling. To crudely estimate the concentration of reporter, we determined the fluorescence level of a known concentration of purified fluorescent protein on the microscope. A drop of purified fluorophore is placed adjacent to a coverslip which itself is resting on a coverslip (Figure 2). A third coverslip is placed on top to create a wedge with known length and height. From this, a series of images are captured across the length of the wedge and the fluorescence intensity is quantified. After plotting this relationship (intensity versus distance along the slide), one can then estimate the concentration of reporter in a given thickness of cell. While the fluorescence of the pure reporter will not equal the fluorescence in a cell, this method gives an estimate that is within several-fold correct (Violin, 2003).
Figure 2.
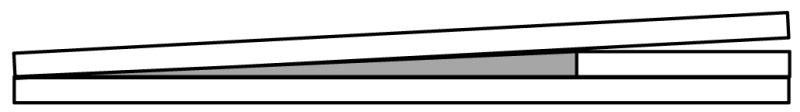
Cartoon depicting a method to calibrate reporter concentration in cells. A drop of purified fluorophore of known concentration (grey color) is placed in a wedge generated using coverslips. A series of images is acquired across the length of the wedge to correlate the intensity of signal with the height at each point in the wedge. From this and knowing the estimated thickness of the cell type used, one can estimate the intensity expected for reporter concentration within a cell.
Materials List
Sterile glass-bottom culture dishes from MatTek Corporation.
Transfection reagent (e.g. FuGENE 6 from Roche).
Hanks’ Balanced Salt Solution (without Ca2+ and Mg2+) supplemented with 1 mM Ca2+ the day of the imaging experiment.
Acquisition software (e.g. Metafluor from Molecular Devices and Microsoft Excel).
Assaying reporter activity
-
Plate adherent cells in 2 ml of media onto sterilized 35 mm glass bottom imaging dishes. As an example, plate approximately 5×10⁵ HeLa cells in a 35 mm dish.
A number of reagents exist that can be used to coat imaging dishes to help less adherent cells attach and adopt a more spread-out morphology. These include fibronectin, poly-D-lysine, Matrigel, collagen among others and most are compatible with imaging; however potential background fluorescence should be assessed for each matrix prior to the experiment.
-
12–24 hours later, transfect cells with DNA encoding the kinase activity reporter. For HeLa cells, transfection of 1 μg reporter DNA with FuGENE 6 according to the manufacturer’s protocol transfects a high percentage of cells that can be imaged within the next 24 hours.
Co-expression with the kinase will boost the rate and magnitude of the response for initial screening and future specificity checks.
12–24 hours later, aspirate media from the cells, rinse in Hank’s balanced salt solution (HBSS) containing 1 mM CaCl2 and replace with 2 ml HBSS/1 mM CaCl2.
Select cells expressing the reporter at levels comparable to those of cellular substrates (approximately 1 μM as determined in the ‘calibration’ section) and acquire one series of images.
Subtract background levels estimated from areas with no cells or untransfected cells.
-
Begin the experiment plotting both the FRET ratio (FRET/CFP) and YFP intensity in real time.
Acquisition and quantification of YFP intensity serves as an important control for photobleaching or reporter movement during the experimental protocol.
-
After acquiring a stable baseline FRET ratio, add an activator of the kinase signaling pathway. As an example, addition of 10 μM histamine to HeLa cells robustly stimulates activation of a Gq/PLC signal transduction pathway.
FRET reporters offer an unambiguous real-time readout of kinase activity following acute treatment of cells with activators or inhibitors of the signaling pathway.
An important experimental control is to add a kinase inhibitor, or an inhibitor of the kinase signaling pathway, to return the FRET ratio to baseline levels following a stable response. This control validates that the FRET ratio change observed resulted from activation of the kinase of interest. For example, in validating the PKC reporter (CKAR), 250 nM Gö 6983 was added to the imaging dish after CKAR attained a maximum FRET change in order to inhibit PKC and monitor reversal of the FRET change due to dephosphorylation of CKAR (Violin et al., 2003). The inhibitor could also be added prior to the experiment to block phosphorylation by the kinase (see Violin et al., 2003).
Another important control is to image the phospho-acceptor mutant, i.e. the ‘control construct’ designed under ‘Strategic Planning’. Only the reporter with the phospho-acceptor site intact within the substrate sequence should undergo a FRET change; this control construct should not display any change in FRET.
Upon completion of the experiment, data should be consolidated and graphed. The baseline FRET ratio varies from one cell to another, so the traces should be normalized to the baseline FRET ratio from each region of interest. We typically include data from three independent experiments, normalize each trace to the baseline reading and reference them around the time of ligand addition.
Determining the dynamic range of the reporter
The change in the FRET ratio from a reporter has a maximal range. Knowing the full range can help in interpreting data during the course of experiments. For example, in experiments where a response is seemingly minute, this may be interpreted as weak activation or signaling by the kinase, however, it might also be a reflection of high basal reporter phosphorylation. That is, if kinase activity is basally high, then a portion of the reporter pool will be basally phosphorylated such that further phosphorylation is limited. Knowing the full range of the reporter helps in interpreting the experiments and also helps determine the efficiency of reporter signaling at different subcellular locations. In Gallegos et al., 2006, this is clearly portrayed in analysis of CKAR at five subcellular regions (Figure 3). The data suggest that the outer membrane mitochondria reporter is not functioning optimally.
Figure 3.
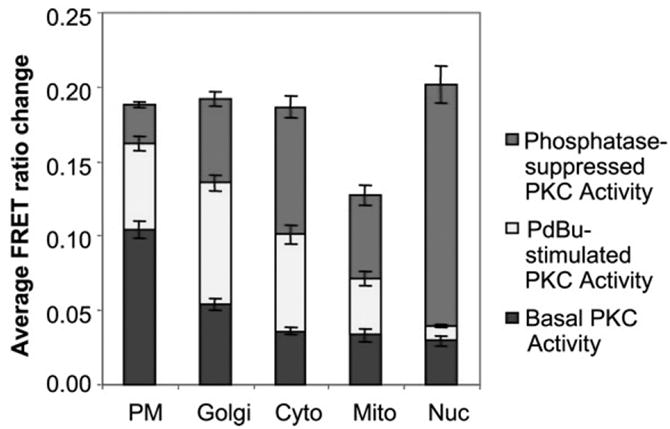
Quantitation of the basal, stimulated, and phosphatase-suppressed PKC activities at specific regions, showing the range of the C Kinase Activity Reporter (CKAR) at each cellular location. The reporter has a consistent maximal range (20% FRET ratio change) at plasma membrane (PM), Golgi, cytosol and nucleus, but a reduced range at the outer membrane of mitochondria. (Figure from Gallegos et al., 2006).
In cells expressing the kinase activity reporter, stimulate kinase activity until the maximal FRET ratio change is attained. This is the stimulated kinase activity.
Treat the cells that reached their maximal change following kinase activation (from part 1.) with phosphatase inhibitors that have been determined to inhibit phosphatases that act on the reporter’s substrate sequence. Blocking phosphatases prevents dephosphorylation and effectively leads to maximal accumulation of phosphorylated reporters. This difference in the FRET ratio is the phosphatase suppressed activity.
In cells expressing the kinase activity reporter, treat the cells with a kinase inhibitor (or inhibitor of the kinase pathway). If basal phosphorylation is present, inhibition of the kinase pathway will allow phosphatases to reverse this phosphorylation and the FRET ratio will drop to a new level. This difference reflects the basal phosphorylation of the reporter.
The sum of the FRET ratio changes from 1., 2., and 3. reveals the dynamic range of the reporter. In our experience, reporters utilizing the same PBD, (e.g. Akt/B Kinase Activity Reporter (BKAR), C Kinase Activity Reporter (CKAR) and D Kinase Activity Reporter (DKAR) all use an FHA2 domain) have the same maximum range (Kunkel et al., 2005; Kunkel et al., 2007; Violin et al., 2003).
TARGETING GENETICALLY ENCODED REPORTERS
The ability to poise reporters at specific intracellular locations allows one to image activity in discrete cellular microenvironments. This tethering to defined intracellular compartments is achieved through the addition of short targeting sequences. Listed in Table 2 are examples of targeting sequences that have been successfully used to target genetically encoded FRET reporters to specific intracellular locations. Figure 4 shows some representative examples of subcellular targeting. Using such targeting strategies, one can observe the kinetics, persistence and level of the response at distinct intracellular regions. An example of the differential dynamics of kinase signaling present at the subcellular level is described in Gallegos et al. (2006). Therein, the PKC activity reporter was targeted to the cytosol, nucleus, Golgi, outer membrane of mitochondria, and plasma membrane, and each subcellular location revealed a distinct signature of kinase activity.
Table 2.
Targeted sequences used to target genetically-encoded reporters
| Subcellular region | Targeting sequences | References |
|---|---|---|
| Cytosol (nuclear-excluded) | LALKLAGLDI at C-term. | Gallegos et al. (2006) |
| Nucleus | PKKRKVEDA at C-term. |
Gallegos et al. (2006) Ananthanarayanan et al. (2005) |
| Mitochondrial outer membrane | 33 N-terminal residues of TOM20 at N-term. |
Sasaki et al. (2003) Gallegos et al. (2006) |
| Mitochondrial matrix | 4 copies of 32 N-terminal residues of cytochrome c oxidase at N-term. | Palmer et al. (2006) |
| Golgi | 33 amino-terminal residues of eNOS at N-term. |
Sasaki et al. (2003) Gallegos et al. (2006) |
| ER | MLLPVLLLGLLGAAAD at N-term and KDEL at C-term. | Palmer et al. (2004) |
| Plasma membrane | MGCIKSK at N-term. |
Violin et al. (2003) Kunkel et al. (2005) Gallegos et al. (2006) |
| PDZ domain-containing proteins | PDZ binding motif to C-term. | Kunkel et al. (2009) |
Figure 4.

Targeting kinase activity reporters to subcellular regions. Images of targeted reporters utilizing some the targeting sequences from Table 2.
COMMENTARY
Background Information
As kinase research is becoming increasingly focused on signaling at the subcellular level, assays to determine the spatiotemporal resolution of kinase activity are needed. Assessing local phosphorylation events by immunoblotting or through activity assays is critically dependent on cell fractionation methods used to isolate localized substrates or kinases. The design of genetically-encoded kinase activity reporters was the first step in designing a tool to examine local kinase activity. There are many benefits to using genetically-encoded reporters. First, a simple transfection of a plasmid is needed to express the reporter in live cells; thus, it is a nondestructive way to introduce the reporter into cells. Second, these reporters can be targeted to subcellular locations through the addition of short targeting sequences. FRET changes observed from targeted reporters reflect phosphorylation events in discrete cellular microenvironments. Using these, one can observe the kinetics, persistence and level of the response at distinct intracellular regions.
Critical Parameters
A critical parameter is the ability of the phosphorylated reporter to undergo a FRET change with a sufficiently high signal to noise ratio; a reporter exhibiting a dynamic range of 20% or higher will yield unambigious results. Another critical consideration with kinase activity reporters is that the response is specific to the kinase of interest; preventing or reversing the FRET response with a kinase inhibitor is an important control.
Troubleshooting
Reporter does not undergo a FRET change
Overexpression of the kinase along with the kinase activity reporter should result in the most robust signal. If no FRET change is observed, there are a number of things to test.
Verify that the kinase is, in fact, activated under the activating conditions using immunoblotting or an activity assay.
Is the reporter already maximally phosphorylated? If so, addition of kinase inhibitors should cause a change in the FRET ratio.
Determine whether the reporter is phosphorylated at the phosphoacceptor site by the kinase by performing an in vitro kinase assay using purified reporter protein and pure kinase. If an antibody to the phosphorylated consensus sequence exists, one can use that to assess phosphorylation at the phosphoacceptor site. Alternatively, the kinase assay will need to include 32P-ATP such that the amount of radioactivity incorporated into the reporter can be quantified. In both cases, a phosphorylation-resistant reporter (control construct in Strategic planning) will need to be used as a control.
If the reporter is phosphorylated in vitro, verify that phosphorylation induces a change in the relative distance and/or orientation between the FRET pair. This can also be done in vitro by performing a fluorescence emission scan of the pure reporter protein before and after phosphorylation by the kinase (e.g. Violin et al., 2003; Kunkel et al., 2005).
If the reporter is phosphorylated, but does not undergo a FRET change, then one can try techniques listed below to optimize the reporter.
Testing reporter specificity
The specificity of a kinase reporter is critical in its use. As described above in the section on determining an optimal consensus sequence, computational methods predict kinases most likely to phosphorylate an input sequence. As it is impractical to perform an exhaustive test of every kinase against the reporter, at a minimum, the specificity of the predicted kinases should be examined. To test these, express the kinase activity reporter and image the FRET ratio following stimulation of the cells with an activator of the non-specific kinase. Should an unwanted kinase efficiently phosphorylate the reporter, one must adapt by changing the substrate peptide sequence. With knowledge of the substrate specificity of the unwanted kinase, one can tailor the consensus sequence such that it disfavors recognition by the unwanted kinase, yet still maintains efficient phosphorylation by the kinase of interest. While this can be done by imaging the FRET ratio changes in cells, the specificity of the reporter can also be assessed by performing a kinase assay in vitro using purified reporter and pure kinase.
Maximal FRET ratio change is inconsistent at different cellular compartments
The maximal FRET ratio change is likely that observed from the reporter in the cytosol. If the maximal change at a subcellular location is less than that observed elsewhere, there may be restricted ability of the reporter to undergo the conformational change when tethered there. One can try adding or altering linker sequences between the reporter and the targeting sequence. In the case of CKAR targeted to mitochondrial outer membrane, we determined via immunoblotting that some of the reporters were being cleaved, and this affected the apparent FRET ratio change observed. If reporter cleavage is observed, mutation of the domain or specific sequence that is recognized by the proteases will remedy the problem.
Optimizing the reporter for a maximal FRET ratio change
The larger the FRET ratio change, the more sensitive and reliable the experiment can be, so many researchers have tried to optimize their reporters. The first thing to try is to change the length of the linker sequences between the different modules. The PBD needs to be able to bind the phosphorylated substrate peptide sequence so there must be some flexibility between these two domains. Second, FRET depends on the distance and the orientation between the two fluorophores so the flexibility of the linkers can also play a role. As a starting point, linkers including the amino acid sequence GGSGG or GGTGG can be used. And last, the ability to create functional circularly-permuted GFPs provides another possible way to potentially increase FRET between FRET pairs. Circularly permutated GFP (and its variants) are proteins in which the amino and carboxyl portions of GFP are joined with a short spacer connecting the original termini (Baird et al., 1999). These proteins thus contain new termini derived from internal sequences to GFP, and they still fluoresce. Importantly, when inserted into the modular reporter, these new variants likely change the relative position and orientation of protein fluorescence which would impact the FRET between the reporter pair. Allen and Zhang (2006) experimentally manipulated all of these parameters and were able to improve their PKA activity reporter, AKAR2, to produce a two-fold increase in the FRET ratio change in their improved PKA reporter, AKAR3. This two-fold increase is a significant improvement in signal.
Anticipated Results
This protocol describes the methods we have used to generate and assay targeted kinase activity reporters. With the advent of novel FRET pairs, the possibilities of co-imaging one reporter alongside another within the same cell is an exciting future avenue. To do so, one needs the appropriate FRET pairs that have minimal or no overlap in their excitation/emission wavelengths along with the appropriate filter sets to image them, or one could envision a system where two FRET pairs share a common fluorophore (Carlson and Campbell, 2009; Ai et al., 2008). In addition, the modular design for the reporter presented here can be adapted to readout other cellular functions, and if using the appropriate FRET pairs, one could co-image them in the same cell as a kinase activity reporter. For example, other FRET-based genetically encoded reporters of similar design include reporters of GTPase activity (Hodgson et al., 2008), protease activity (Xu et al., 1998) as well as reporters of Ca2+ levels (Miyawaki et al., 1997). Imaging cellular activities at specific intracellular locations provides unprecedented opportunities for understanding cell signaling.
Time Considerations
Once the reporter DNA is made, the basic protocol to image kinase activity will take 3 days. Plating cells on day 1 will take about 15 minutes. Transfecting cells on day 2 will take 10–30 minutes depending on the reagent used. On day 3, imaging each dish takes between 30–60 minutes. It takes 5–10 minutes to prepare the dish on the microscope and to find cells expressing the correct concentration of reporter. It takes another 5–10 minutes to define the regions of interest and to begin the software protocol to acquire a time-lapse series of images. Once the imaging has started, it is important to acquire 5 minutes of baseline FRET ratio before activating the kinase signaling pathway. Depending on the level of active kinase in the cell, the level of phosphatases, and the mode of signaling (some of the responses we have observed, such as from DKAR in response to histamine, are transient), it will take about 15 minutes to complete a single imaging protocol. Typically one images multiple cells per dish in duplicate along with the necessary control dishes (e.g. phospho-acceptor mutant, kinase inhibitor pre-treatment) such that an entire series of dishes would take 3–4 hours of time. Analysis of each experiment using Microscoft Excel (or similar spreadsheet application) takes about 15 minutes per dish.
Acknowledgments
This work is supported by NIH GM 43154 and NIH P01 DK 54441.
Literature Cited
- Ai HW, Hazelwood KL, Davidson MW, Campbell RE. Fluorescent protein FRET pairs for ratiometric imaging of dual biosensors. Nat Methods. 2008;5:401–403. doi: 10.1038/nmeth.1207. [DOI] [PubMed] [Google Scholar]
- Allen MD, Zhang J. Subcellular dynamics of protein kinase A activity visualized by FRET-based reporters. Biochem Biophys Res Commun. 2006;348:716–721. doi: 10.1016/j.bbrc.2006.07.136. [DOI] [PubMed] [Google Scholar]
- Ananthanarayanan B, Ni Q, Zhang J. Signal propagation from membrane messengers to nuclear effectors revealed by reporters of phosphoinositide dynamics and Akt activity. Proc Natl Acad Sci U S A. 2005;102:15081–15086. doi: 10.1073/pnas.0502889102. [DOI] [PMC free article] [PubMed] [Google Scholar]
- Baird GS, Zacharias DA, Tsien RY. Circular permutation and receptor insertion within green fluorescent proteins. Proc Natl Acad Sci U S A. 1999;96:11241–11246. doi: 10.1073/pnas.96.20.11241. [DOI] [PMC free article] [PubMed] [Google Scholar]
- Campbell RE, Tour O, Palmer AE, Steinbach PA, Baird GS, Zacharias DA, Tsien RY. A monomeric red fluorescent protein. Proc Natl Acad Sci U S A. 2002;99:7877–7882. doi: 10.1073/pnas.082243699. [DOI] [PMC free article] [PubMed] [Google Scholar]
- Carlson HJ, Campbell RE. Genetically encoded FRET-based biosensors for multiparameter fluorescence imaging. Curr Opin Biotechnol. 2009;20:19–27. doi: 10.1016/j.copbio.2009.01.003. [DOI] [PubMed] [Google Scholar]
- Dunn TA, Wang CT, Colicos MA, Zaccolo M, DiPilato LM, Zhang J, Tsien RY, Feller MB. Imaging of cAMP levels and protein kinase A activity reveals that retinal waves drive oscillations in second-messenger cascades. J Neurosci. 2006;26:12807–15. doi: 10.1523/JNEUROSCI.3238-06.2006. [DOI] [PMC free article] [PubMed] [Google Scholar]
- Durocher D, Taylor IA, Sarbassova D, Haire LF, Westcott SL, Jackson SP, Smerdon SJ, Yaffe MB. The molecular basis of FHA domain:phosphopeptide binding specificity and implications for phospho-dependent signaling mechanisms. Mol Cell. 2000;6:1169–1182. doi: 10.1016/s1097-2765(00)00114-3. [DOI] [PubMed] [Google Scholar]
- Gallegos LL, Kunkel MT, Newton AC. Targeting Protein Kinase C Activity Reporter to Discrete Intracellular Regions Reveals Spatiotemporal Differences in Agonist-dependent Signaling. J Biol Chem. 2006;281:30947–30956. doi: 10.1074/jbc.M603741200. [DOI] [PubMed] [Google Scholar]
- Griesbeck O, Baird GS, Campbell RE, Zacharias DA, Tsien RY. Reducing the environmental sensitivity of yellow fluorescent protein. Mechanism and applications. J Biol Chem. 2001;276:29188–29194. doi: 10.1074/jbc.M102815200. [DOI] [PubMed] [Google Scholar]
- Hodgson L, Pertz O, Hahn KM. Design and optimization of genetically encoded fluorescent biosensors: GTPase biosensors. Methods Cell Biol. 2008;85:63–81. doi: 10.1016/S0091-679X(08)85004-2. [DOI] [PubMed] [Google Scholar]
- Kunkel MT, Ni Q, Tsien RY, Zhang J, Newton AC. Spatio-temporal dynamics of protein kinase B/Akt signaling revealed by a genetically encoded fluorescent reporter. J Biol Chem. 2005;280:5581–5587. doi: 10.1074/jbc.M411534200. [DOI] [PMC free article] [PubMed] [Google Scholar]
- Kunkel MT, Toker A, Tsien RY, Newton AC. Calcium-dependent regulation of protein kinase D revealed by a genetically encoded kinase activity reporter. J Biol Chem. 2007;282:6733–6742. doi: 10.1074/jbc.M608086200. [DOI] [PMC free article] [PubMed] [Google Scholar]
- Kunkel MT, Garcia EL, Kajimoto T, Hall RA, Newton AC. The protein scaffold NHERF-1 controls the amplitude and duration of localized protein kinase D activity. J Biol Chem. 2009 doi: 10.1074/jbc.M109.024547. in press. [DOI] [PMC free article] [PubMed]
- Miyawaki A, Llopis J, Heim R, McCaffery JM, Adams JA, Ikura M, Tsien RY. Fluorescent indicators for Ca2+ based on green fluorescent proteins and calmodulin. Nature. 1997;388:882–7. doi: 10.1038/42264. [DOI] [PubMed] [Google Scholar]
- Palmer AE, Giacomello M, Kortemme T, Hires SA, Lev-Ram V, Baker D, Tsien RY. Ca2+ indicators based on computationally redesigned calmodulin-peptide pairs. Chem Biol. 2006;13:521–530. doi: 10.1016/j.chembiol.2006.03.007. [DOI] [PubMed] [Google Scholar]
- Palmer AE, Jin C, Reed JC, Tsien RY. Bcl-2-mediated alterations in endoplasmic reticulum Ca2+ analyzed with an improved genetically encoded fluorescent sensor. Proc Natl Acad Sci U S A. 2004;101:17404–17409. doi: 10.1073/pnas.0408030101. [DOI] [PMC free article] [PubMed] [Google Scholar]
- Rizzo MA, Springer GH, Granada B, Piston DW. An improved cyan fluorescent protein variant useful for FRET. Nat Biotechnol. 2004;22:445–449. doi: 10.1038/nbt945. [DOI] [PubMed] [Google Scholar]
- Sasaki K, Sato M, Umezawa Y. Fluorescent indicators for Akt/protein kinase B and dynamics of Akt activity visualized in living cells. J Biol Chem. 2003;278:30945–30951. doi: 10.1074/jbc.M212167200. [DOI] [PubMed] [Google Scholar]
- Sato M, Kawai Y, Umezawa Y. Genetically encoded fluorescent indicators to visualize protein phosphorylation by extracellular signal-regulated kinase in single living cells. Anal Chem. 2007;79:2570–2575. doi: 10.1021/ac062171d. [DOI] [PubMed] [Google Scholar]
- Shaner NC, Steinbach PA, Tsien RY. A guide to choosing fluorescent proteins. Nat Methods. 2005;2:905–909. doi: 10.1038/nmeth819. [DOI] [PubMed] [Google Scholar]
- Turk BE, Hutti JE, Cantley LC. Determining protein kinase substrate specificity by parallel solution-phase assay of large numbers of peptide substrates. Nat Protoc. 2006;1:375–379. doi: 10.1038/nprot.2006.57. [DOI] [PubMed] [Google Scholar]
- Violin JD. Doctoral dissertation. La Jolla CA, University of California; San Diego: 2003. Spatiotemporal Dynamics of Protein Kinase C Signaling. [Google Scholar]
- Violin JD, Zhang J, Tsien RY, Newton AC. A genetically encoded fluorescent reporter reveals oscillatory phosphorylation by protein kinase C. J Cell Biol. 2003;161:899–909. doi: 10.1083/jcb.200302125. [DOI] [PMC free article] [PubMed] [Google Scholar]
- Xu X, Gerard AL, Huang BC, Anderson DC, Payan DG, Luo Y. Detection of programmed cell death using fluorescence energy transfer. Nucleic Acids Res. 1998;26:2034–5. doi: 10.1093/nar/26.8.2034. [DOI] [PMC free article] [PubMed] [Google Scholar]
- Zhang J, Ma Y, Taylor SS, Tsien RY. Genetically encoded reporters of protein kinase A activity reveal impact of substrate tethering. Proc Natl Acad Sci U S A. 2001;98:14997–15002. doi: 10.1073/pnas.211566798. [DOI] [PMC free article] [PubMed] [Google Scholar]
- Zhang J, Hupfeld CJ, Taylor SS, Olefsky JM, Tsien RY. Insulin disrupts beta-adrenergic signalling to protein kinase A in adipocytes. Nature. 2005;437:569–73. doi: 10.1038/nature04140. [DOI] [PubMed] [Google Scholar]