Abstract
Early detection of cancer remains the best way to ensure patient survival and quality of life. Squamous cell carcinoma is usually preceded by dysplasia presenting as white, red, or mixed red and white epithelial lesions on the oral mucosa (leukoplakia, erythroplakia). Dysplastic lesions in the form of erythroplakia can carry a risk for malignant conversion of 90%. A noninvasive diagnostic modality would enable monitoring of these lesions at regular intervals and detection of treatment needs at a very early, relatively harmless stage. The specific aim of this work was to test a multimodality approach [three-dimensional optical coherence tomography (OCT) and polarimetry] to noninvasive diagnosis of oral premalignancy and malignancy using the hamster cheek pouch model (nine hamsters). The results were compared to tissue histopathology. During carcinogenesis, epithelial down grow, eventual loss of basement membrane integrity, and subepithelial invasion were clearly visible with OCT. Polarimetry techniques identified a four to five times increased retardance in sites with squamous cell carcinoma, and two to three times greater retardance in dysplastic sites than in normal tissues. These techniques were particularly useful for mapping areas of field cancerization with multiple lesions, as well as lesion margins.
Keywords: optical imaging, Mueller matrix, polarization imaging, polar decomposition, retardance, optical coherence tomography, pre-malignancy, dysplasia
Introduction
In the United States, approximately 1.5 million new cancer cases were expected to be diagnosed in 2010, excluding most carcinomas in situ (noninvasive cancers) as well as basal and squamous cell skin cancers.1 Over half a million Americans were expected to die of cancer, more than 1,500 people a day in the year 2010.1 Cancer is the second most common cause of death in the US, exceeded only by heart disease.1 The 5-year relative survival rate for all cancers diagnosed between 1999 and 2005 was 68%, up from 50% in 1975 to 1977. The improvement in survival reflects progress in diagnosing certain cancers earlier and improvements in treatment. More than 85% of cancers originate in the epithelium, and epithelial cancers are preceded by a curable pre-cancerous stage, when 95% of cases completely recover.2 Cancer detection is further complicated by field cancerization or multicentric lesions. Current diagnostic techniques require repeated surgical biopsies of lesions that frequently turn out to be benign, yet they often also detect malignant change too late for curative treatment. Of all oral cancer cases documented by the National Cancer Institute, advanced lesions outnumbered localized lesions at the time of diagnosis by more than 2:1. These statistics mean that at least some lesions were ignored or missed by patients, healthcare professionals, or both. It is partly due to an incomplete understanding or awareness that even small asymptomatic lesions can have significant malignant potential and partly due to the lack of effective diagnostic modalities. Five-year survival rate is only 16% for patients with oral cancer metastasis, but 75% for those with localized disease at the time of diagnosis.1, 2 The current approach to detecting malignant change in existing oral lesions that are potentially pre-dysplastic or dysplastic is regular surveillance combined with biopsy or surgical excision. However, these techniques are invasive, often poorly tolerated by patients, may miss additional lesions or areas of more severe pathology, and unsuitable for regular screening of high risk sectors of the population.
OCT is a noninvasive high-resolution imaging modality capable of cross-sectional imaging of biological tissue.3, 4, 5 OCT is often compared to clinical ultrasound because both technologies employ back-scattered signals reflected from different layers within the tissue to reconstruct structural images. Since OCT utilizes light waves rather than sound, high-resolution in the range of 2 to 10 μm can be achieved while clinical ultrasound typically has a 100-μm level of resolution. In contrast to conventional medical imaging modalities, OCT provides high-resolution real time visualization of tissue structure in a noninvasive or minimally invasive manner. Due to the aforementioned advantages, OCT has a wide range of potential applications in diagnosing diseases in various biological tissues such as the eye, skin, gastrointestinal, respiratory and genitourinary tracts, and the oral cavity.6, 7, 8, 9, 10, 11, 12, 13 Although OCT penetration depth is limited to 2 to 3 mm, it can provide access to internal organs by incorporation with fiberoptic endoscopic probes. Previous studies using OCT have demonstrated an imaging penetration depth sufficient to evaluate macroscopic characteristics of epithelial and subepithelial structures with potential for near histopathological level resolution.14 Thus, OCT may improve on present clinical capabilities, particularly for the identification of multifocal pathological sites, regular monitoring of lesions, and screening of high-risk populations.
In 1976, Bickel et al. advanced polarimetry into the field of biomedical sensing when they described a technique that measured the polarization effects of the scattered light from bacterial suspensions to yield useful information to characterize the sample.15 In the ensuing decades, several groups have shown that a considerable amount of information can be obtained from polarization sensitive measurements such as the average particle size,16 photon path length,17 and particle shape18, 19, 20 of the sample under investigation.21 The experimental Mueller matrix of a sample contains information on retardance, diattenuation, and depolarization, which is not readily apparent in the original images. These sample discriminating parameters can be extracted using polar decomposition. The decomposition of Mueller matrices into a combination of product matrices has been addressed by many authors.22, 23, 24 Lu and Chipman were able to decompose the Mueller matrix into three factors, namely, diattenuation, retardance, and depolarization.22 Smith et al. have developed a Mueller matrix imaging polarimeter capable of collecting the full Mueller matrix of tissue in vivo.25 Previous studies using polarimetry identified useful factors for the differentiation between cancerous lesions and their benign counterparts and presented potential as a method for the in vivo early detection and diagnosis of oral premalignancy.26
In the present study, we investigated a multimodality approach to noninvasive diagnostics of oral premalignancy. Using the hamster cheek pouch model (nine hamsters), in vivo polarimetry of the oral mucosa was used to acquire Mueller matrix images providing quantitative information on epithelial tissues and optical coherence tomography (OCT) was used to map epithelial and subepithelial changes throughout carcinogenesis.
Materials and Methods
A standard hamster cheek pouch model (n = 9) was used, with one cheek pouch in each animal undergoing carcinogenesis and the other serving as control. At weekly intervals, noninvasive imaging was performed using a cheek pouch clamp with locator coordinates to ensure accurate co-localization. Volume rendering images were acquired using 3D OCT. Polarimetry provided Mueller matrix images with quantitative information on mucosal tissues. After two to 16 weeks carcinogenesis, the animals were sacrificed and routine histopathology was used to evaluate tissue. Tissue histopathology was scored by two blinded, prestandardized investigators using a standard scale from zero (healthy) to six (squamous cell carcinoma, SCC). The retardance images obtained from the Mueller matrix were quantitatively analyzed and compared with OCT diagnostics and histopathology.
Animal Preparation
A standard hamster (Mesocricetus auratus) cheek pouch model was used.27 By application of 0.5% DMBA (9,10 dimethyl-1, 2-benzanthracene) in mineral oil three times per week, mild to severe dysplasia developed in three to six weeks, progressing to squamous cell carcinoma at approximately 10 to 12 weeks. Histological features in this model have been shown to closely correspond with pre-malignancy and malignancy in human oral mucosa.27 This study used nine female animals, 10 to 12 weeks old. The median lining wall of one cheek pouch of each hamster was treated with DMBA carcinogen in mineral oil; the other cheek pouch was treated only with mineral oil and served as control. Previous studies have shown that, over 16 weeks, this carcinogenesis process in one cheek pouch does not affect the other cheek.28, 29 Therefore, the untreated cheek pouch can be used as the control. Half of the hamsters were euthanized and their cheek pouches were dissected and pinned onto histological corkboards for immediate OCT and polarimetry imaging. The other half of the hamsters were imaged in vivo using intraperitoneal 4:3 Ketamine HCL (100 mg/ml): Xylazine (20 mg/ml) at a dose of 1.0 cc/kg. These animals were wrapped in mylar during imaging to prevent hypothermia. The cheek pouches were inverted, held in place with a fixation device, kept moist using irrigation with sterile saline, and imaged.
Spectral-Domain Optical Coherence Tomography
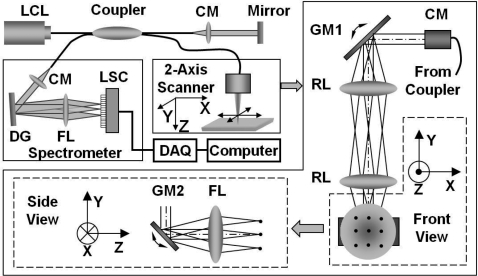
Spectral-domain optical coherence tomography is a high-speed, high-resolution, noninvasive, cross-sectional imaging technique based on a Michelson interferometer. The experimental setup is shown in Fig. 1. Four arms in the Michelson interferometer are assigned by a broadband light source (1310 nm of center wavelength and 90 nm of a full width at half maximum), a spectrometer (0.13 nm of spectral accuracy and 7.7 kHz of frame rate) as a fringe detector, an immobilized mirror at reference arm, and a two-axis scanner with focusing lens at sample arm. A mathematical description for the principle of the spectral-domain OCT was previously described in detail.30 Here, we summarize how it works. Reflected lights from the immobilized mirror and each scattering particle in a sample make a signal in spectral domain that is detected by the spectrometer. When the path difference between the reference and the sample arms is defined by 2z and the refractive index of the sample by n, the scattering event by each particle at a different depth z is encoded in the frequency 2nz of cosine function and the signal is a sum of the cosine functions with different z’s, where the amplitude of each cosine is proportional to the scattering amplitude. An inverse Fourier transform of the signal in spectral domain gives a complex signal in the z domain. The powers of peaks in the z domain represent the scattering amplitudes and are converted to gray scales to make an array of images along the z direction. While the two-axis scanner scans the xy plane, the array is continuously acquired to make a volume image. The current setup has an 8-μm (in air) depthwise and 13-μm lateral resolutions.
Figure 1.
Schematic of a fiber-based spectral-domain OCT: a 130-nm wide spectrum was sampled by a 1 × 1024 InGaAs detector array at 7.7 kHz. Imaging depth and depth resolution were 3.4 mm and 8 μm in air, respectively. A 2-axis scanner with two galvo mirrors was used. LCL, low-coherence light; CM, collimator; DAQ, data acquisition system; DG, diffraction grating; FL, focusing lens; LSC, line scan camera; GM, galvo mirror; RL, relay lens.
Polarimetry
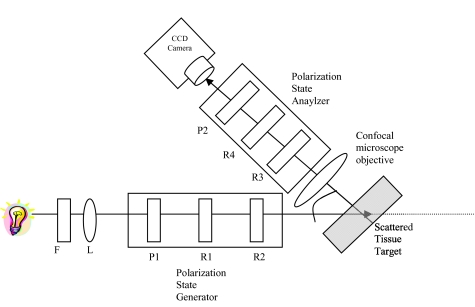
The system, shown in Fig. 2, consists of four voltage controlled optical elements (R1, R2, R3, and R4) (Meadowlark Optics, Frederick, Colorado). The light source is a fiber optic illuminator (Dolan-Jenner Industries, Inc., Lawrence, Massachusetts) with a 30-watt, 20-volt halogen bulb. The light passes through a laser line interference filter (F) with wavelength transmittance from 400 to 700 nm. The light emerging from the filter is collimated by a 38.1 mm focal length convex lens (L) (Newport Corporation, Fountain Valley, California) to provide a broad beam to illuminate the sample. The resulting light then passes through a Glan Thompson 100,000:1 polarizer (P1) (Newport Corporation, Fountain Valley, California), a linear polarizer set at horizontal, and two voltage-controlled variable retarders (R1, R2). These optical components allow for modulation of the input state of polarization. The variable retarders produce all of the necessary states of linearly and circularly polarized light. The operational basis underlying voltage-controlled optics is that voltage supplied in the form of a 2-kHz square wave modulates the degree of rotation of the polarization axis and the amount of retardation by the voltage controlled retarder. Light scattered from the sample toward the camera passes through another series of polarizing optics. The backscattered light from the sample is imaged by the objective lens (10×/0.30 N.A.). Theoretical resolution of this objective (λ/(2*N.A.)) is about 0.7 to 1.2 μm. Before not using the lens, the resolution was about 15 to 20 μm. The calibrated resolution is about 1.5 to 2.0 μm. The output branch contains another polarizer set at vertical (P2), consisting of two voltage-controlled variable retarders (R3, R4) encountered by the light in reverse order from the input branch. The resulting images are captured by a computer controlled 1024×1024 pixels, 14 μm×14 μm per pixel, and 12-bit CCD camera (Kodak, San Diego, California). Extracting the retardance images from the measured Mueller matrix requires performing the polar decomposition and a mathematical description for Mueller matrix retardance imaging from the polarimetry system was described in detail.26
Figure 2.
Schematic of Mueller matrix polarimetry system.
Co-localization
In order to co-localize OCT, polarimetry, and histology, the blood vessel network in the cheek pouch was used as a marker. After the cheek pouch was held in place with a fixation device, it was imaged in vivo with OCT, polarimetry, and light microscopy. One thousand and twenty four two-dimensional OCT slices (xz plane) were recorded every 5 μm along the y-direction and volume-rendered. En face image (xy plane) of the cheek pouch was taken by polarimetry and light microscopy. Another En face image was also reconstructed from the OCT volume-rendered image and compared to the results of polarimetry and light microscopy. The blood vessel network was clearly imaged for all modalities with a window size of 5.12 mm × 5.12 mm in the xy plane. After the animal was sacrificed, the tissue was harvested and prepared for standard paraffin sectioning and hematoxylin and eosin (H&E) staining. One thousand and five hundreds histological slices (xz plane) were made every 6 μm and imaged using a light microscope with 1, 4, and 10× objective lenses. Every fifteenth histological slice (every 90 μm) was selected to be volume-rendered with 1× of magnification. A reconstructed en face image (xy plane) was made to visualize the blood vessel network and compared to the en face images from the different modalities.
Results
Matching En Face Images
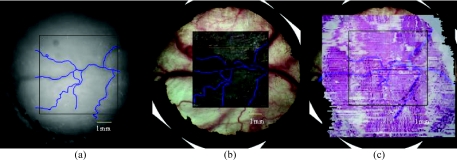
Figure 3 shows matching polarimetry image and microscope photo, OCT image, and histology. Figure 3a is the raw polarimetry image with traced blood vessels, Fig. 3b is the original microscope image with blood vessel tracings from the OCT image superimposed and Fig. 3c is the original histology with blood vessel tracings from the microscope image superimposed. Polarimetry, microscopy, OCT and histology image can be co-localized using the blood vessel tracings.
Figure 3.
(a) Raw polarimetry image with traced blood vessels, (b) original microscope image with blood vessel tracings from the OCT image superimposed, and (c) original histology with blood vessel tracings from the microscope image superimposed.
Optical Coherence Tomography
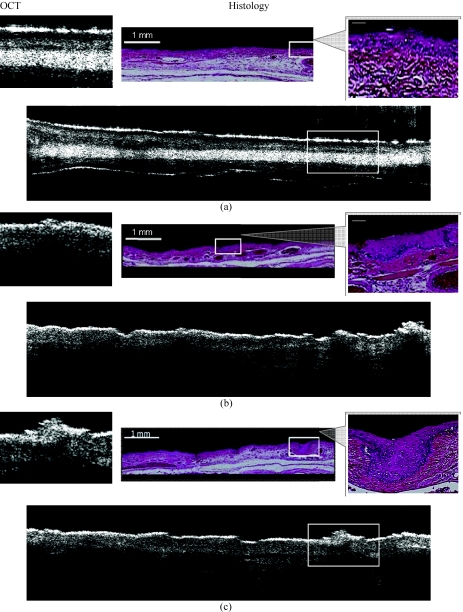
Optical coherence tomography (OCT) provided volume rendering images of the tissues. The depth-resolvable feature of high-resolution OCT enabled us to identify every tissue feature, including the blood vessel network, breakdown of the basement membrane, and epithelial as well as subepithelial changes. This was complementary information, which polarization detection and visual examination could not provide. In areas of dysplasia epithelial thickening, down growth of rete pegs, abnormal keratinization, and intact basement membrane are all clearly visible. In areas of malignancy, tissue disorganization, patches of thickened keratinized layer, and/or greatly thickened squamous epithelial layer, as well as breakdown of the basement membrane and invasion of the underlying submucosal connective tissue, are observed. These observations correspond with similar features in the H&E stained histopathological images (Figs. 45).
Figure 4.
In vivo OCT image and corresponding H&E stained histology of hamster cheek pouch with different stages: (a) healthy region ( SS =0); (b) dysplasia region ( SS =1 or 2); (c) squamous cell carcinoma region ( SS =6). Enlarged images (left for OCT and right for histology) were taken from the white boxes in the original images (center).
Figure 5.
(a) In vivo OCT 3D-image (Video 1, QuickTime, 1.7 MB) and (b) corresponding histology of a hamster cheek pouch with the squamous cell carcinoma (SS = 6) (Video 2, QuickTime, 2.2 MB) . Image size: 1.14 mm (W) × 0.52 mm (H) × 0.72 mm (D).
Figure 4 shows OCT images (left side) and matching histology (right side). Figure 4a shows healthy oral mucosa [standard scale (SS) = 0]. Normal epithelial surface appears very bright as the keratinized layer is very reflective. Underneath the epithelial layer, the base membrane is clearly visible with the connective tissue. Figure 4b shows an area of dysplasia (SS = 1 or 2). The epithelial surface is thicker than healthy tissue and the surface keratinized layer is still very bright and completely intact. The basement membrane shows some down growth into the underlying connective tissue but it is clearly still intact. Figure 4c depicts an image of squamous cell carcinoma (SS = 6) that surface keratinized layer is thicker and brightens. The epithelium layer is grown down and the base membrane is broken down.
Figure 5 shows in vivo OCT 3D-image (left side) and corresponding histology of a dysplastic area of the hamster cheek pouch (right side). Surface and subsurface mucosal layers including blood vessels were clearly visible in the 3-D OCT images. Epithelial changes throughout carcinogensis were apparent, including epithelial thickening, loss of basement membrane integrity, and subepithelial invasion.
Polarimetry
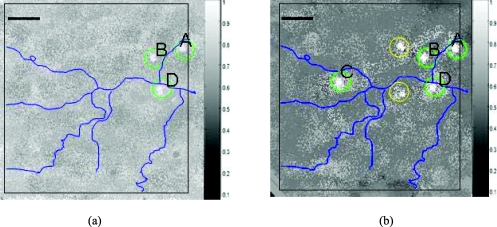
After two weeks of carcinogenesis using DMBA, the very early changes could not be distinguished with the naked eye. However, tissue retardance was already two to three times greater than that of normal tissue. By four weeks, the dysplastic tissue had retardance four to five times greater than that of normal tissue. Figure 6 shows the normalized retardance images and the gray level indicates the relative magnitude of retardance from baseline. Figure 6a depicts the image after two weeks of DMBA. The green circled sites (A, B, and D) had two to three times greater retardance than healthy sites (SS = 0) and shows an image of dysplasia (SS = 1 or 2). Figure 6b depicts the image after four weeks of DMBA. The circled sites had a four to five times greater retardance than healthy sites and shows an image of squamous cell carcinoma (SS = 6). Green circled sites (A, B, C, and D) in Fig. 6b were also detected using OCT and confirmed with histology, whereas yellow circled sites were confirmed with histology but remained undetected using OCT alone. In these images, we observe a significant retarding structure after the residual retardance is removed. We expect that these patterns are caused by an underlying birefringent structure such as oriented collagen fibers.
Figure 6.
Normalized retardance images from polarimetry based on Mueller matrix. Images after (a) two weeks and (b) four weeks of DMBA (scale bar: 1 mm).
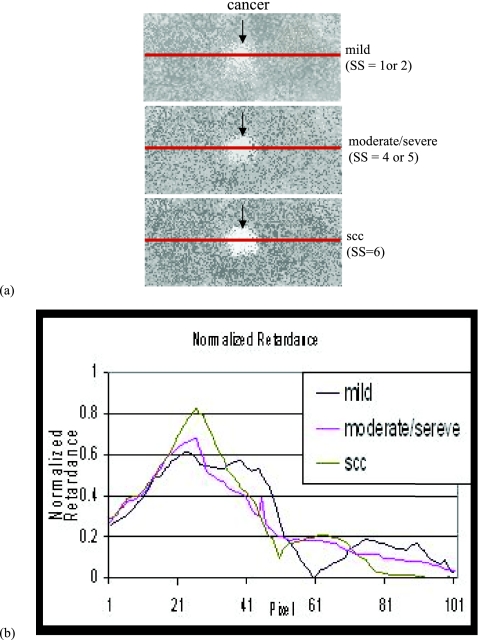
Figure 7a shows how much change of retardance occurred through carcinogenesis and Fig. 7b is a chart of normalized retardance with statistics along the lines in Fig. 7a.
Figure 7.
(a) Shows how much change of retardance occurred through carcinogenesis and (b) chart of normalized retardance with statistics along the lines in (a).
Discussion and Conclusion
These studies demonstrate the use of 3-D OCT and polarimetry for early detection and diagnosis of oral premalignancy and malignancy. Our results demonstrate the feasibility of diagnostic imaging within the oral cavity using these modalities. From OCT images, surface and subsurface structure including blood vessels were clearly visible with epithelial and subepithelial changes evident in the OCT images paralleling histopathological status. During carcinogenesis, epithelial down grow, eventual loss of basement membrane integrity, and subepithelial invasion were clearly visible. Polarimetry techniques identified a four to five times increased retardance in sites with squamous cell carcinoma and two to three times greater retardance in dysplastic sites than in normal tissues. This technique was particularly useful for mapping areas of field cancerization with multiple lesions, as well as lesion margins.
Taken together, these two techniques could provide useful information for screening patients for oral cancer. We expect that a clinical system would be used mostly by oral surgeons or other oral cancer specialists, who are in the best position both to screen for cancer and to remove the lesions for treatment or biopsy.
Recently, a few of diagnostic tools for the early detection of oral cancer were developed. Typical examples are Toluidine blue dye, ViziLite® and VELscope® that utilize absorption/reflectance, chemiluminescence, and fluorescence, respectively. As shown in this study, polarimetry provides a new contrast: polarization and OCT show tissue microstructure and depth information. Hence, multimodality approaches combining any of two methods will produce a more diagnostic contrast.
Acknowledgments
The authors thank Hilari Kawakami-Wong, David S. Mukai, Naglaa El-Abbadi, Nevine Hanna, Teri Waite-Kennedy, and Tanya Burney for their help with animal preparation, regulatory compliance, and sample processing. This research was supported by the National Research Foundation of Korea (2011-0006286, R31-20004), the National Science Foundation (BES-86924), California Tobacco Related Disease Research Program (#14IT-0097), and National Institutes of Health (EB-00293, NCI-91717, RR-01192, EB0002SS, EB002494, and AR47551). Institute support from the Air Force Office of Scientific Research (F49620-00-1-0371, FA9550-04-1-0101, CRFA 30003, CCRP 00-01391V-20235), and the Beckman Laser Institute Endowment is also gratefully acknowledged.
References
- Cancer Facts & Figures 2010, American Cancer Society, Atlanta: (2010); http://www.cancer.org/acs/groups/content/@epidemiologysurveilance/documents/document/acspc-026238.pdf [Google Scholar]
- What You Need To Know About Skin Cancer, NIH-National Cancer Institute, NIH Publication No. 95–1564, January 1995. [Google Scholar]
- Huang D., Swanson E. A., Lin C. P., Schuman J. S., Stinson W. G., Chang W., Hee M. R., Flotte T., Gregory K., Puliafito C. A., and Fujimoto J. G., “Optical coherence tomography,” Science 254, 1178–1181 (1991). 10.1126/science.1957169 [DOI] [PMC free article] [PubMed] [Google Scholar]
- Fercher A. F., “Optical coherence tomography,” J. Biomed. Opt. 1, 157–173 (1996). 10.1117/12.231361 [DOI] [PubMed] [Google Scholar]
- Schmitt J. M., “Optical coherence tomography (OCT): a review,” IEEE J. Sel. Top. Quantum Electron. 5, 1205–1215 (1999). 10.1109/2944.796348 [DOI] [PMC free article] [PubMed] [Google Scholar]
- Izatt J. A., Hee M. R., Swanson E. A., Lin C. P., Huang D., Schuman J. S., Puliafito C. A., and Fujimoto J. G., “Micrometer-scale resolution imaging of the anterior eye in vivo with optical coherence tomography,” Arch. Ophthamol. 112, 1584–1589 (1994). [DOI] [PubMed] [Google Scholar]
- Schmitt J. M., Yadlowsky M., and Bonner R. F., “Subsurface imaging if living skin with optical coherence microscopy,” Dermatology 191, 93–98 (1995). 10.1159/000246523 [DOI] [PubMed] [Google Scholar]
- Kobayashi K., Izatt J. A., Kulkarni M. D., Willis J., and M. V.SivakJr., “High-resolution cross-sectional imaging of the gastrointestinal tract using optical coherence tomography: preliminary results,” Gastrointest. Endosc. 47, 515–523 (1998). 10.1016/S0016-5107(98)70254-8 [DOI] [PubMed] [Google Scholar]
- Yelbuz T. M., Choma M. A., Thrane L., Kirby M. L., and Izatt J. A., “Optical coherence tomography: a new high-resolution imaging technology to study cardiac development in chick embryos,” Circulation 106, 2771–2774 (2002). 10.1161/01.CIR.0000042672.51054.7B [DOI] [PubMed] [Google Scholar]
- Tearney G. J., Brezinski M. E., Southern J. F., Bouma B. E., Boppart S. A., and Fujimoto J. G., “Optical biopsy in human urologic tissue using optical coherence tomography,” J. Urol. 157, 1915–1919 (1997). 10.1016/S0022-5347(01)64900-0 [DOI] [PubMed] [Google Scholar]
- Colston B. W., Everett M. J., Da Silva L. B., Otis L. L., Stroeve P., and Nathel H., “Imaging of hard- and soft-tissue structure in oral cavity by optical coherence tomography,” Appl. Opt. 37, 3582–3585 (1998). 10.1364/AO.37.003582 [DOI] [PubMed] [Google Scholar]
- Zagaynova E. V., Streltsova O. S., Gladkova N. D., Snopova L. B., Gelikonov G. V., Feldchtein F. I., and Morozov A. N., “In vivo optical coherence tomography feasibility for bladder disease,” J. Urol. 167, 1492–1496 (2002). 10.1016/S0022-5347(05)65351-7 [DOI] [PubMed] [Google Scholar]
- Pitris C., Jesser C., Boppart S. A., Stamper D., Brezinski M. E., and Fujimoto J. G., “Feasibility of optical coherence tomography for high resolution imaging of human gastrointestinal tract malignancies,” J. Gastroenterol. 35, 87–92 (2000). 10.1007/s005350050019 [DOI] [PubMed] [Google Scholar]
- Wilder-Smith P., Jung W. G., Brenner M., Osann K., Beydoun H., Messadi D., and Chen Z., “In vivo optical coherence tomography for the diagnosis of oral malignancy,” Lasers Surg. Med. 35, 269–275 (2004). 10.1002/lsm.20098 [DOI] [PubMed] [Google Scholar]
- Bickel W. S., Davidson J. F., Huffman D. R., and Kilkson R., “Application of polarization effects in light scattering: a new biophysical tool,” Proc. Natl. Acad. Sci. USA 73, 486–490 (1976). 10.1073/pnas.73.2.486 [DOI] [PMC free article] [PubMed] [Google Scholar]
- Sokolov K., Drezek R., Gossage K., and Richards-Kortum R., “Reflectance spectroscopy with polarized light: is it sensitive to cellular and nuclear morphology,” Opt. Express 5, 302–317 (1999). 10.1364/OE.5.000302 [DOI] [PubMed] [Google Scholar]
- Dogariu M. and Asakura T., “Photon pathlength distribution from polarized backscattering in random media,” Opt. Eng. 35, 2234–2239 (1996). 10.1117/1.601016 [DOI] [Google Scholar]
- Cameron B. D., Rakovic M. J., Mehrübeoglu M., Kattawar G. W., Rastegar S., Wang L. V., and Coté G. L., “Measurement and calculation of the two-dimensional backscattering Mueller matrix of a turbid medium,” Opt. Lett. 23, 485–487 (1998). 10.1364/OL.23.000485 [DOI] [PubMed] [Google Scholar]
- Cameron B. D., Rakovic M. J., Mehrübeoglu M., Kattawar G. W., Rastegar S., Wang L. V., and Coté G. L., “Measurement and calculation of the two-dimensional backscattering Mueller matrix of a turbid medium,” Opt. Lett. 23, 1630 erratum (1998). 10.1364/OL.23.001630 [DOI] [PubMed] [Google Scholar]
- Rakovic M. J., Kattawar G. W., Mehrübeoglu M., Cameron B. D., Rastegar S., Wang L. V., Rastegar S., and Coté G. L., “Light backscattering polarization patterns from turbid media: theory and experiment,” Appl. Opt. 38, 3399–3408 (1999). 10.1364/AO.38.003399 [DOI] [PubMed] [Google Scholar]
- Hielscher A. H., Mourant J. R., and Bigio I. J., “Influence of particle size and concentration on the diffuse backscattering of polarized light from tissue phantoms and biological cell suspensions,” Appl. Opt. 36, 125–135 (1997). 10.1364/AO.36.000125 [DOI] [PubMed] [Google Scholar]
- Lu S. Y. and Chipman R. A., “Interpretation of Mueller matrices based on polar decomposition,” J. Opt. Soc. Am. A 13, 1106–1113 (1996). 10.1364/JOSAA.13.000001 [DOI] [Google Scholar]
- Gil J. J. and Bernabéu E., “Obtainment of the polarizing and retardation parameters of a non-depolarizing optical system from the polar decomposition of its Mueller matrix,” Optik (Stuttgart) 76, 67–71 (1987). [Google Scholar]
- Sridhar R. and Simon R., “Normal form for Mueller matrices in polarization optics,” J. Mod. Opt. 41, 1903–1915 (1994). 10.1080/09500349414551811 [DOI] [Google Scholar]
- Smith M. H., “Interpreting Mueller matrix images of tissues,” Proc. SPIE 4257, 82–89 (2001). 10.1117/12.434690 [DOI] [Google Scholar]
- Chung J., Jung W., Hammer-Wilson M. J., Wilder-Smith P., and Chen Z., “Use of polar decomposition for the diagnosis of oral precancer,” Appl. Opt. 46, 3038–3045 (2007). 10.1364/AO.46.003038 [DOI] [PubMed] [Google Scholar]
- Salley J. J., “Experimental carcinogenesis in the cheek pouch of the Syrian hamster,” J. Dent. Res. 33, 253–262 (1954). 10.1177/00220345540330021201 [DOI] [PubMed] [Google Scholar]
- Ebihara A., Krasieva T. B., Liaw L. H., Fago S., Messadi D., Osann K., and Wilder-Smith P., “Detection and diagnosis of oral cancer by light-induced fluorescence,” Lasers Surg. Med. 32, 17–24 (2003). 10.1002/lsm.10137 [DOI] [PubMed] [Google Scholar]
- Wilder-Smith P., Ebihara A., Liaw L. H., Krasieva T. B., and Messadi D., “Detection of dysplasia and malignancy in oral mucosa using autofluorescence,” Lasers Surg. Med. 26(suppl. 12), 63–64, paper 264 (2000). [Google Scholar]
- Ahn Y.-C., Jung W., and Chen Z., “Optical sectioning for microfluidics: secondary flow and mixing in a meandering microchannel,” Lab Chip 8, 125–133 (2008). 10.1039/b713626a [DOI] [PMC free article] [PubMed] [Google Scholar]


