Abstract
We have successfully synthesized a lipid containing the pyranine dye as the hydrophilic head group. This lipid was incorporated into liposomes with 1-palmitoyl-sn-glycero-3-phosphocholine as the major component. The resultant liposomes displayed differential enhancements in fluorescence emission intensity in the presence of nanomolar concentrations of different glycosaminoglycans. Linear discriminant analysis of the fluorescence response data demonstrate that the liposomes are able to distinguish between different GAGs. In addition, we also demonstrate that the liposomes incorporating the pyranine lipid are able to distinguish between dilute serum from healthy individuals and serum containing elevated chondroitin sulfate (simulated serum from an Alzheimer’s disease patient).
Keywords: glycosaminoglycans, liposomes, Alzheimer’s disease, linear discriminant analysis
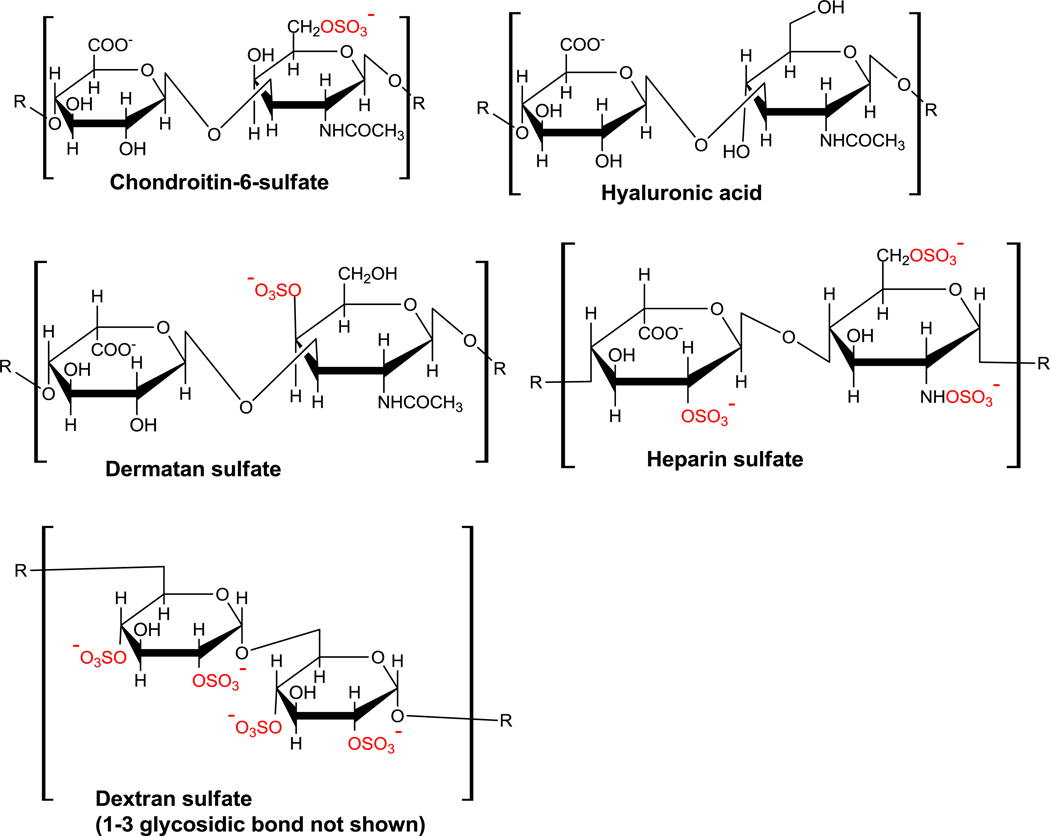
Glycosaminoglycans (mucopolysaccharides) are linear polysaccharides composed of repeating disaccharide units of uronic acid and an amino sugar (Figure 1).1 They may be either sulfated or non-sulfated, and are involved in many physiological functions.2 In several diseases, the serum or urine levels of glycosaminoglycans (GAGs) change relative to that of healthy individuals. For example, abnormal metabolism of the GAGs and glycoproteins present in the blood-brain barrier and neuron receptors contribute to abnormally high levels of GAGs in the serum of schizophrenics,3,4 with a concurrent decrease in urine glycosaminoglycan level.4,5 The serum concentrations of glycosaminoglycans (uronic acids and chondroitin sulfate) increase considerably in Alzheimer’s disease patients relative to that of healthy individuals.6 The urine GAG concentrations are also elevated for patients with various types of metastatic cancers,7–9 and for children with acute urinary tract infections.10
Figure 1.
Structures of the glycosaminoglycans (GAGs). The sulfate groups are shown in red.
Usually, the detection of GAGs involves chemical or enzymatic hydrolysis of the polymers to smaller units and subsequent conjugation with suitable dyes for spectrophotometric or spectrofluorometric detection of the hydrolysis products (often by HPLC).11,12 There are commercially available GAG detection kits based on these principles.* However, these techniques provide the total concentration of the glycosaminoglycans in the sample, and do not provide the identity of the GAG present. Nuclear magnetic resonance (NMR), capillary electrophoresis (CE) and mass spectrometry (MS) have been used to detect the hydrolysis products and to identify the GAGs present in the original samples.11 These techniques are involved, require specialized equipment and purified, known samples of the hydrolysis products for calibration. ELISA-like assays and immunoblotting have been developed for selective detection of GAGs.13,14 Although these methods are successful in detecting the individual GAGs, sensitive biological antibodies are used as the recognition elements.
Herein, we report the synthesis of a lipid containing the pyranine dye as the hydrophilic hear group and demonstrate that liposomes incorporating this lipid show differential modulations of the emission intensity in the presence of different glycosaminoglycans. Linear discriminant analysis of the fluorescence response data demonstrate that the liposomes are able to distinguish between different GAGs. In addition, we also demonstrate that these liposomes (containing the pyranine lipid) are able to distinguish between dilute serum from healthy individuals and serum containing elevated chondroitin sulfate (simulated serum from an Alzheimer’s disease patient). With further development, we anticipate that this fluorescence-based approach to detect the individual GAGs (without prior chemical or enzymatic hydrolysis or without using biological antibodies) will be invaluable for accurate and early diagnosis of these diseases.
MATERIALS AND METHODS
Materials
All reagents were purchased from either TCI America or Alfa-Aesar and were used as received. Table 1 shows the glycosaminoglycans used, and their respective molecular weights.
Table 1.
Glycosaminoglycans used and respective molecular weights
| GAG Used | MW (kDa) |
|---|---|
| Chondroitin Sulfate | 35 |
| Dermatan Sulfate | 30 |
| Dextran Sulfate | 40 |
| Heparin Sulfate | 13.5 |
| Hyaluronic Acid | 1400 |
The dansyl, rhodamine and POPC lipids were purchased from Avanti Polar Lipids. Human serum was purchased from Sigma-Aldrich. Probe sonication was carried out using a Misonix Microson Ultrasonic Cell Disruptor, with a VWR digital heatblock for temperature control. Fluorescence spectra were recorded using a Horiba Jobin Yvonne FluoroMax-4 spectrofluorometer.
Synthesis of the pyranine lipid
The synthetic details are provided in the Supporting Information.
Preparation of liposomes
For pyranine-containing liposomes, 1.2 mL of POPC solution in chloroform (2 mg/mL), and 4.2 mL of pyranine lipid solution in chloroform (0.01 mg/mL) were added to a 10 mL round-bottom flask. For lissamine-rhodamine-containing liposomes 1.2 mL of POPC solution in chloroform (2 mg/mL), and 4 mL of lissamine-rhodamine lipid solution in chloroform (0.01 mg/mL) were added to a 10 mL round-bottom flask. For dansyl-containing liposomes, 1 mL of POPC solution in chloroform (2 mg/mL), and 1.74 mL of dansyl lipid solution in chloroform (1 mg/mL) were added to a round-bottom flask. The solutions were evaporated using a rotary evaporator at 50 °C for 10 minutes. The resulting lipid thin film was stored in a desiccator for 8 hours or overnight. The lipid thin film was hydrated with 2 mL of 25 mM HEPES buffer (pH 8) for 1 hour at 50 °C with rotation and then probe-sonicated at 70 °C for 45 min. The liposomes were stored at room temperature (22 °C) in darkness for 1 hour and then extruded 15 times through a 100 nm filter at 70 °C. The extruded liposomes were allowed to come to room temperature (15 min) before use.
Calculation of fluorophore on outer leaflet
Formula used is as follows:
(60% of lipid on outer leaflet) × (wt. of pyranine lipid added in grams) × (1000)/(Molar mass of fluorophore lipid in grams) × (final volume of preparation in mL).
Therefore, for 1.8 mL final volume of pyranine-containing liposomes, the calculation is as such: (0.6) × (0.000044g) × (1000)/(1329.61g) × (1.8mL) = 1.1 × 10⁻⁵ M, or 11µM stock solution of liposomes. This solution was then diluted for use in the same buffer used for hydration of the thin film (see above). In addition, it is this concentration (that of the fluorophore on the outer liposome leaflet) that was used to express the concentrations of liposomes used during fluorescence emission studies.
Fluorescence spectroscopic studies
To determine the changes in fluorescence emission upon addition of GAGs to each fluorophore-containing liposome, the following sequential additions were made to a quartz fluorimeter cell. Each experiment was repeated six times for the statistical analysis of the data.
193 µL of 25 mM HEPES buffer, pH 8.
5 µL liposomes solution (200 nM solution for pyranine and rhodamine liposomes, and 8 µM for dansyl liposomes (final concentration of 5 nM for pyranine and rhodamine, 200 nM for dansyl liposomes). Following this addition, the solution was excited six times at a wavelength corresponding to the excitation wavelength of the fluorophore present, and each excitation was followed by collection of the emission spectrum.
2 µL GAG solution in 25 mM HEPES (100 nM solution added—final concentration 1 nM).
1.8 µL GAG solution (1 µM solution added—final concentration 10 nM).
8 µL GAG solution (1 µM solution added—final concentration 50 nM).
10 uL GAG solution (1 µM solution added—final concentration 100 nM).
The maximum emission wavelength for each fluorophore was recorded; data at this wavelength for all cycles was collected and used for data analysis.
Experiments with human serum
Normal human serum was diluted 10,000 times using 25 mM HEPES buffer at pH 8. Chondroitin sulfate was added to bring the concentration up to 48 nM from 26 nM. This corresponds to 8.1 mg/dL of uronic acid in the serum without dilution (similar to that observed for Alzheimer’s disease patients). The serum was diluted so that the concentration of chondroitin sulfate is close to 50 nM (the concentration where the pyranine liposomes has the best discriminating ability). An aliquot (1 mL) of each serum mixture was withdrawn and 5 µL solution of the pyranine liposomes (1 µM pyranine concentration in the outer leaflet of the liposomes) was added to each, resulting in final concentration of 5 nM pyranine in the outer lipid layer liposomes. A portion of the liposome-serum mixture (200 µL) was used in the fluorescence experiments.
RESULTS AND DISCUSSION
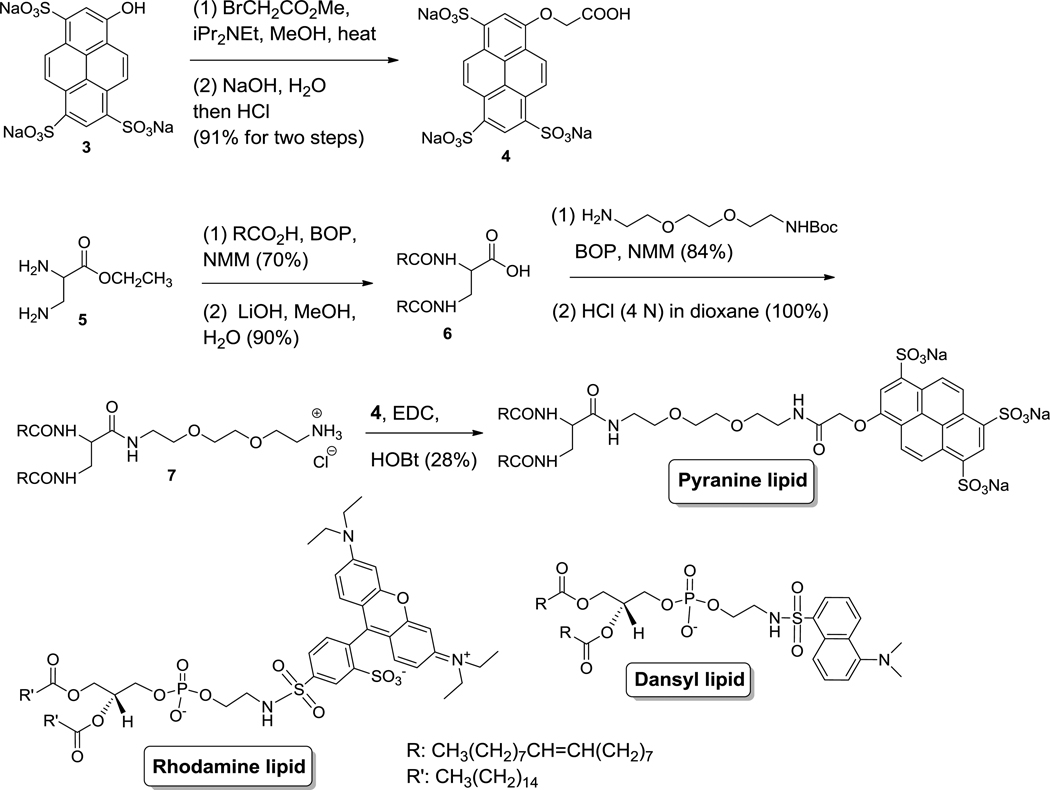
GAGs are known to interact with liposomes and depending on the concentration of the GAG, this leads to liposomal aggregation.15,16 We reasoned that this interaction can be modulated and monitored by incorporating lipids with charged fluorophores (as head groups) in the liposomes. With this goal, we synthesized a lipid with the pyranine dye as the hydrophilic head group (Figure 2). For comparison, we selected two other commercially-available lipids incorporating the lissamine rhodamine and dansyl moieties as the hydrophilic head groups (Figure 2).
Figure 2.
Structures of the lipids with pyranine, lissamine rhodamine and dansyl as the head groups and the synthesis of the pyranine lipid.
The synthesis of the pyranine lipid started with the commercially available pyranine dye (Figure 2). The phenolic hydroxyl group was alkylated to produce the compound 4 containing the carboxylic acid moiety. The compound 4 was subsequently conjugated with the synthesized bis-oleoyl lipid 1 to produce the desired pyranine lipid as a yellow waxy solid. We used the racemic 2,3-diaminopropanoic acid in the synthesis, resulting in the racemic form of the pyranine lipid.
We prepared liposomes with 1-palmitoyl-2-oleoyl-sn-glycero-3-phosphocholine (POPC) as the major lipid and monitored changes in fluorescence intensity in the presence of varying concentrations of five different GAGs (heparin sulfate, dermatan sulfate, chondroitin sulfate, dextran sulfate, and hyaluronic acid, Figure 1). We hypothesized that the presence of different GAGs will cause varying degrees of liposomal aggregation, causing each fluorophore to exhibit different patterns of fluorescence emission intensity changes. This will therefore serve to not only detect GAGs in solution, but also to distinguish between different glycosaminoglycan types.
The liposomes were prepared in 25 mM HEPES buffer (pH = 8.0) by the thin film hydration method.17 Unilamellar vesicles were generated by probe sonication followed by repeated extrusions through membranes of 100 nm pore sizes at 70 °C (Supporting Information).17 The average diameter of the extruded liposomes was observed to be 88 ± 5 nm (by dynamic light scattering). We used 1 mol% of the pyranine lipid or the rhodamine lipid in the liposomes. A significantly higher amount of the dansyl lipid (40 mol%) was required in the liposomes to compensate for its lower quantum yield.18 Differential scanning calorimetric studies revealed that the fluorophore lipids were mixed in the lipid bilayer of the liposomes (data not shown). To conduct fluorescence spectroscopic studies, liposomes from each batch were incubated with four different concentrations (1 nM, 10 nM, 50 nM, and 100 nM) of each of the glycosaminoglycans. The low concentrations of the GAGs in 25 mM HEPES buffer (pH = 8.0) ensure that the molecules are completely ionized and the degree of ionization is not influencing the fluorescence spectra from the liposome-incorporated dyes. Six fluorescence emission spectra were recorded for each concentration of each glycosaminoglycan, and these were compared with the corresponding emission spectra from the liposomes in the absence of GAGs. The ratios of emission intensities from liposomes alone to that in the presence of GAGs (Emlip/EmGAG) were calculated for each spectrum at the peak emission wavelength, and these ratio data were subjected to linear discriminant analysis.19–21
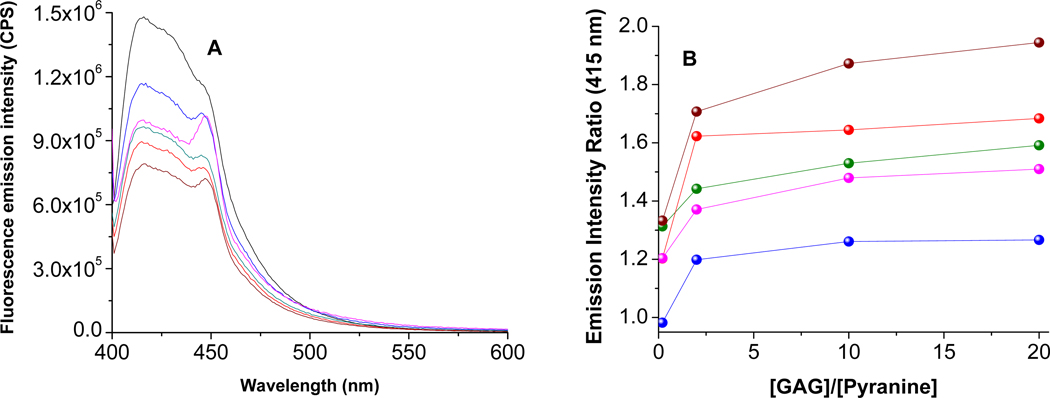
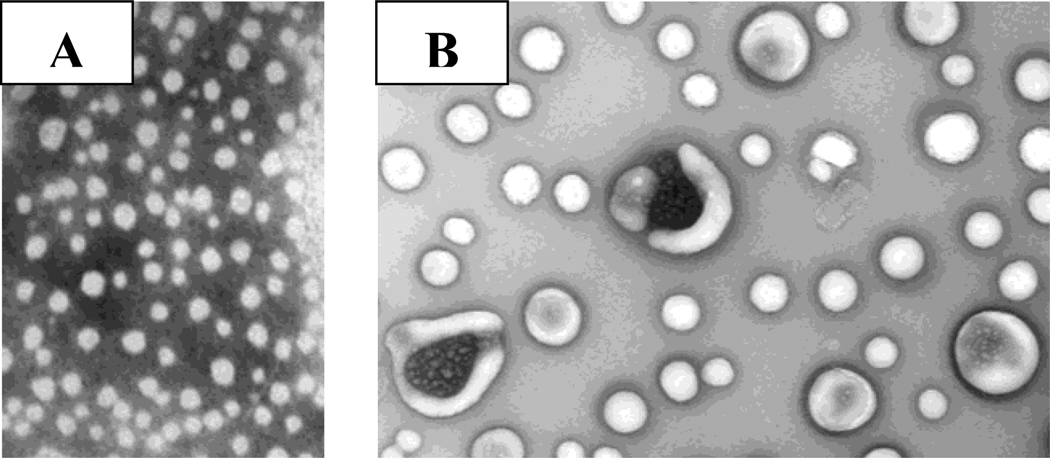
We observed that liposomes containing the selected fluorophores respond differently to the presence of the different GAGs tested. Figure 3A depicts the ratios of the fluorescence emission intensity of the pyranine liposomes for each GAG at 50 nM concentration (λex = 390 nm). Notable from this figure is that each GAG produces a different Emlip/EmGAG ratio (Figure 3B; the plots for the liposomes incorporating the other fluorophores are included in Supporting Information). Transmission electron microscopy of the liposomes after the addition of 50 nM GAGs indicated aggregation leading to increase in size (Figure 4); however, we did not observe any precipitate formation.
Figure 3.
The fluorescence spectra (A) of the liposomes incorporating the pyranine lipid (λex = 390 nm) in the presence of 50 nM of each of the glycosaminoglycans are shown. The emission intensity ratios in the absence and presence of added GAGs are shown in (B). The GAGs include chondroitin sulfate (olive), dextran sulfate (blue), heparin sulfate (red), hyaluronic acid (magenta), and dermatan sulfate (brown). The black trace in (A) is for the liposomes in the absence of any added GAGs. The data points in (B) are connected by straight lines.
Figure 4.
Transmission electron micrographs of the pyranine liposomes in buffer (2A) and in the presence of 50 nM chondroitin sulfate (2B) are shown. The magnification was 79,200 (1 cm in the figures corresponds to 250 nm in size).
To determine whether a change in the molecular weight of the glycosaminoglycan would alter the fluorescence intensity change, we repeated the studies with another sample of chondroitin sulfate with a lower molecular weight (20 kDa) and compared the responses with those from the chondroitin sulfate of molecular weight 35 kDa. We observed that the higher molecular weight chondroitin sulfate caused more pronounced decreases in the emission intensity from the pyranine and dansyl-containing liposomes (Supporting Information). It is likely that the higher molecular weight GAG leads to a greater degree of liposomal aggregation, and a greater decrease in emission intensity from the liposomes. However, the reverse was observed with lissamine-rhodamine-containing liposomes, with the lower molecular weight chondroitin sulfate causing a greater change in emission intensity (Supporting Information). Reasons for this observation are unclear, and further investigation is needed to fully deduce the mechanism responsible for this change.
Linear discriminant analysis (LDA) is used to identify the predictive power of the liposomes (see Supporting Information for details).19–21 Emission intensity data from the liposomes (the predictor variables) and the five GAGs shown in Table 1 (the dependent variables) were replicated a total of six times, yielding a sample of 30 observations with four variables (one for each liposome and one identifying the GAG). All statistical analyses were conducted using the PASW (formerly SPSS) Statistical Package, Version 18.
Table 2 shows means, F-statistics and Wilks’ Lambda values for each liposome, disaggregated by GAGs. We note that smaller values for the Wilks’ Lambda indicate a greater potential for the liposomes to discriminate across GAGs.22 All F-statistics have associated p-values less than 0.05, indicating significant differences exist across group means for each GAG. For the chondroitin sulfate, dextran sulfate, heparin sulfate and hyaluronic acid, the dansyl liposomes have the highest mean fluorescence values. The pyranine liposomes have the second highest mean values, followed by rhodamine liposomes. The remaining GAG (dermatan sulfate) has the highest mean emission ratios when combined with pyranine, followed by dansyl and rhodamine containing liposomes. Wilks’ Lambda values are lowest for pyranine, followed by rhodamine and dansyl liposomes.
Table 2.
Tests of Equality of Group Means
| GAG | Pyranine[a,b] | Rhodamine[a,b] | Dansyl[a,b] |
|---|---|---|---|
| Chondroitin Sulfate(b) | 1.562 | 1.297 | 1.563 |
| Dermatan Sulfate | 1.942 | 1.447 | 1.412 |
| Dextran Sulfate | 1.334 | 1.247 | 1.541 |
| Heparin Sulfate | 1.729 | 1.517 | 1.862 |
| Hyaluronic Acid | 1.487 | 1.124 | 2.243 |
| Wilks’ Lambda | 0.068 | 0.214 | 0.560 |
| F-Statistic | 85.829 | 22.898 | 4.904 |
| P-Value | <0.001 | <0.001 | 0.005 |
first panel provides group-specific means
second panel provides statistics and p-values.
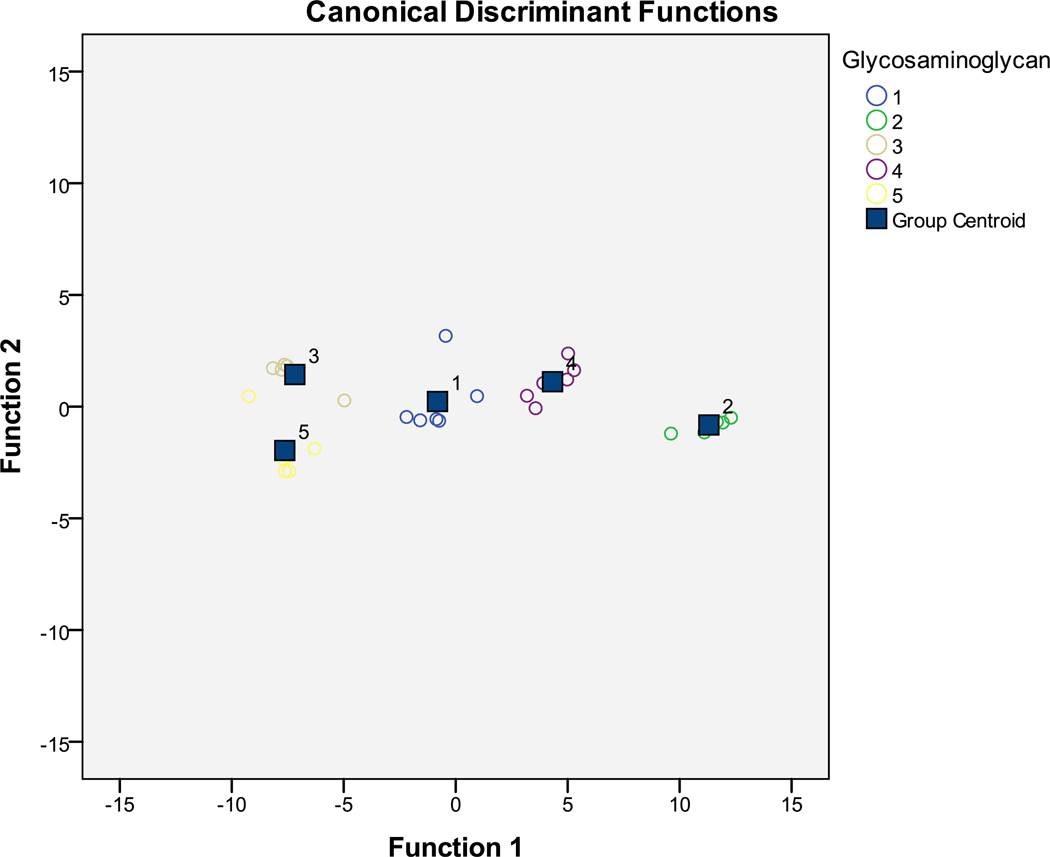
Chi-square tests indicate that three canonical functions are sufficient to explain our 5 GAGs (see Supporting Information). Of these, the first canonical function is most important, as it explains 96.3% of the variation across GAGs. The remaining functions explain 3.0% and 0.7%, respectively. As such, we focus primarily on the first discriminant function. Figure 5 shows a canonical function plot of the first two canonical functions (explaining 99.3% of the variation in the GAGs). Note that each of the GAGs is clearly distinguished as a group in the plot. Moreover, traditional and cross-validated discriminant functions corrected predict 100% and 93.3% of the GAGs, respectively, indicating a high likelihood of interval validity.
Figure 5.
Canonical correlation plot between two largest canonical correlations and each of the five GAGs: chondroitin sulfate (group 1), dermatan sulfate (group 2), dextran sulfate (group 3), heparin sulfate (group 4) and hyaluronic acid (group 5).
To assess the overall contribution of each liposome to the discriminatory power of the LDA, we constructed cumulative potency indices (Supporting Information). The potency indices suggest that pyranine (potency value = 0.215) provides the largest overall contribution to the model’s ability to distinguish emission intensities across GAGs (rhodamine potency index = 0.057; dansyl potency index = 0.012).
The LDA results have a clear and intuitive interpretation; namely, that the pyranine liposomes are the “best” determinant of GAGs. Dansyl liposomes are identified as the least “potent” discriminator, even though its emission intensities are relatively high (Table 2). The Wilks’ Lambda and structure matrices (see Supporting Information for the latter) suggest that this is at least partly attributable to excess variation in dansyl emission intensities, which offsets the high mean values. One possible limitation of the analysis is that we have chosen a specific (50 nM) concentration to conduct our experiments. To check the robustness of our results, we replicated the LDA for the 100 nM concentrations (Supporting Information). The results are qualitatively (but not quantitatively) similar to those at 50 nM.
Subsequently, we proceeded to determine if the pyranine-containing liposomes are capable of distinguishing an increase in GAG concentration in a complex mixture of proteins and other biomolecules, e.g., dilute human serum. According to the National Institute on Aging, currently there is no biochemical test to detect Alzheimer’s disease. Indirect methods are used by physicians for diagnosis.† However, it has been reported that the serum concentrations of glycosaminoglycans (uronic acids) increase in Alzheimer’s disease patients (about 8.4 ± 0.8 mg/dL) relative to that of healthy individuals (about 4.6 ± 0.5 mg/dL).6 Chondroitin sulfate concentration in the serum increases from about 0.58 mg/dL (healthy individuals) to about 2.36 mg/dL for Alzheimer’s disease patients.6 The LDA analysis indicated that the pyranine-containing liposomes are capable of distinguishing different GAGs at 100 nM and 50 nM concentrations. It follows that the pyranine liposomes has the capability to distinguish the GAGs in a very dilute human serum from an Alzheimer’s disease patient (diluted 104 times).
In order to simulate serum from Alzheimer’s disease patients, we spiked commercially available human serum (Sigma Chemical Company) with added chondroitin sulfate (MW: 35 kDa) such that the uronic acid concentration is about 8 mg/dL. We noted, a priori, that it is an increase in not one, but rather several GAGs which contributes to the overall increase in GAG concentration in Alzheimer’s disease patients.6 The use of chondroitin sulfate only as the GAG of choice is to provide a relevant model system to determine if the pyranine liposomes are capable of distinguishing changes in GAG concentration in a complex mixture of other physiological molecules. We noted also that the increase in chondroitin sulfate in Alzheimer’s disease patients from that of healthy patients is among the highest percentage increases of all the GAGs, while also making up one of the highest fractions of the total GAGs present.6 We diluted the simulated disease serum appropriately so that the concentration of the chondroitin sulfate is about 48 nM.
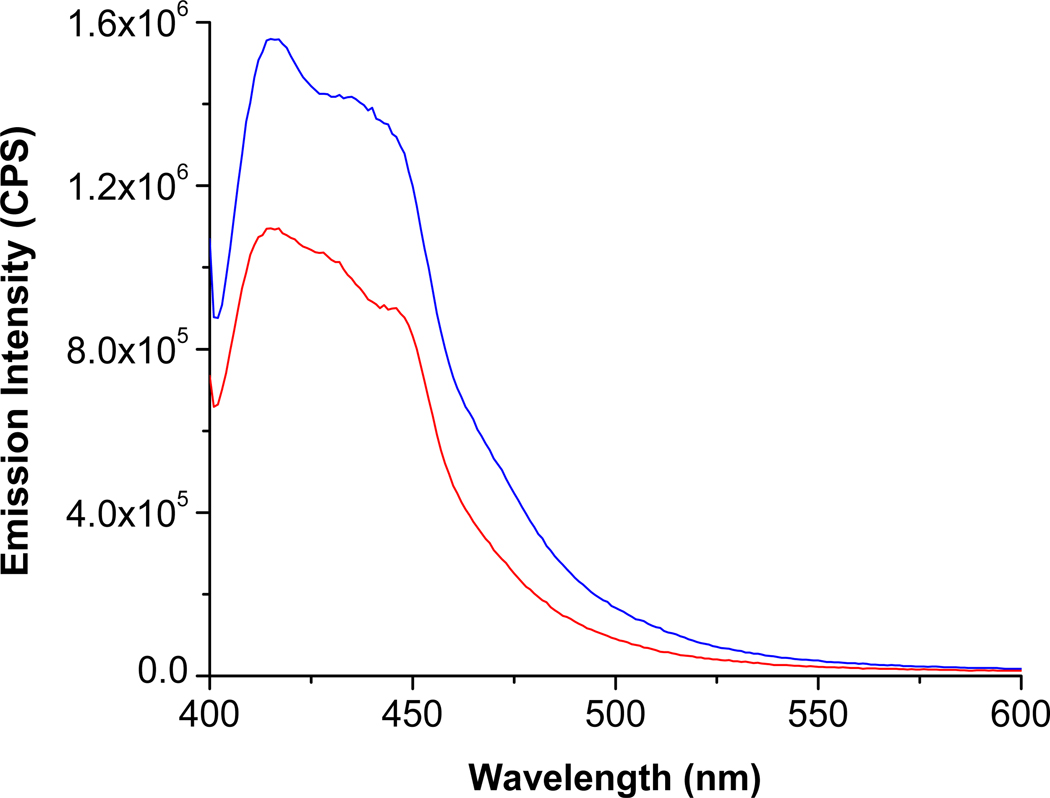
Results from the human serum experiment are shown in Figure 6. We observed a considerable decrease in the emission intensity from the pyranine liposomes in the presence of simulated Alzheimer’s disease serum (Figure 6, red trace). It should be noted that the commercially available kit can detect the total concentrations of the GAGs (after enzymatic hydrolysis) with micromolar detection limits.13 In contrast, the emission intensity from the pyranine liposomes change considerably in the presence of 48 nM chondroitin sulfate (without prior enzymatic hydrolysis of the polymer). These results suggest that the pyranine fluorophore-containing liposomes may be very valuable in the successful diagnosis of Alzheimer’s disease by monitoring the levels of the GAGs in the serum. The utility of such a test could be magnified further if the patient could be tested early in life, and then subsequently over time, monitoring any changes.
Figure 6.
The fluorescence emission spectra for the pyranine liposomes (λex = 390 nm) in the presence of diluted healthy serum (blue) and. simulated Alzheimer’s disease serum (red) are shown.
CONCLUSIONS
We have successfully synthesized a lipid with the pyranine dye as the hydrophilic head group. We have demonstrated (by fluorescence spectroscopy) that liposomes (with POPC as the major lipid component) incorporating suitable dyes will differentially interact with the different glycosaminoglycans. Linear discriminant analysis indicated that the liposomes incorporating the synthesized pyranine lipid have the highest discriminating ability amongst the GAGs. These liposomes are capable of distinguishing different levels of GAGs (e.g., chondroitin sulfate) even in a complex mixture of physiological molecules (human serum).
Supplementary Material
ACKNOWLEDGMENT
This research was supported by NIH grant 1R01 CA 132034 and NSF grant DMR 1005011 to SM. SYQ acknowledges the support from the NIH grants R15CA140833 and P20RR015566.
Footnotes
SUPPORTING INFORMATION AVAILABLE: Synthetic details for the pyranine lipid, emission intensity ratio plots, and details of statistical data analysis. This material is available free of charge via the Internet at http://pubs.acs.org.
GAG detection kits are available from several suppliers. For example: Biocolor Ltd (UK); Kamiya Biomedical Company, Seattle, WA (US); ALPCO Diagnostics, Salem, NH (US) etc.
Reported by the National Institutes of Health, National Institute on Aging; http://www.nia.nih.gov; updated January 10, 2011; accessed on April 18, 2011.
REFERENCES
- 1.Zhang F, Zhang Z, Linhardt RJ. In: The Handbook of Glycomics. Cummings RD, Pierce MJ, editors. London: Elsevier; 2009. [Google Scholar]
- 2.Gandhi NS, Mancera RL. Chem Biol Drug Des. 2008;72:455–482. doi: 10.1111/j.1747-0285.2008.00741.x. [DOI] [PubMed] [Google Scholar]
- 3.Varma R, Michos GA, Gordon BJ, Varma RS, Shirey RE. Biochemical Medicine. 1983;30:206–214. doi: 10.1016/0006-2944(83)90087-x. [DOI] [PubMed] [Google Scholar]
- 4.Varma R, Hoshino AY. Carbohydrate Research. 1980;82:343–351. doi: 10.1016/s0008-6215(00)85708-0. [DOI] [PubMed] [Google Scholar]
- 5.Varma RS, Varma R, Allen WS, Wardi AH. Biochemical Medicine. 1974;11:358–369. doi: 10.1016/0006-2944(74)90135-5. [DOI] [PubMed] [Google Scholar]
- 6.Kurup RK, Kurup PA. Intern. J. Neuroscience. 2003;113:361–381. doi: 10.1080/00207450390162146. [DOI] [PubMed] [Google Scholar]
- 7.Masahiro M, Akiko Y, Yokohama KY, Kokuryo T, Tsunoda N, Oda K, Nagino M, Ishimaru T, Shimoyama Y, Utsunomiya H, Iwata H, Itoh Y, Itoh J, Kannagi R, Kyogashima M. Glycoconjugate J. 2010;27:661–672. doi: 10.1007/s10719-010-9311-4. [DOI] [PubMed] [Google Scholar]
- 8.Corte MD, Gonzalez LO, Junquera S, Bongera M, Allende MT, Vizoso FJ. J. Cancer Res. Clin. Oncol. 2010;136:745–750. doi: 10.1007/s00432-009-0713-2. [DOI] [PubMed] [Google Scholar]
- 9.Platt VM, Szoka FC., Jr Mol. Pharmaceutics. 2008;5:474–486. doi: 10.1021/mp800024g. [DOI] [PMC free article] [PubMed] [Google Scholar]
- 10.Cengiz N, Baskin E, Anarat R, Agras PI, Yildirim SV, Tiker F, Anarat A, Saatci U. Pediatric Nephrology. 2005;20:937–939. doi: 10.1007/s00467-005-1856-2. [DOI] [PubMed] [Google Scholar]
- 11.Korir AK, Larive CK. Anal. Bioanal. Chem. 2009;393:155–169. doi: 10.1007/s00216-008-2412-2. [DOI] [PubMed] [Google Scholar]
- 12.Pan J, Qian Y, Zhou X, Pazandak A, Frazier SB, Weiser P, Lu H, Zhang L. Glycobiol. Insights. 2010;2:1–12. [PMC free article] [PubMed] [Google Scholar]
- 13.Bairstow S, McKee J, Nordhaus M, Johnson R. Anal. Biochem. 2009;388:317–321. doi: 10.1016/j.ab.2009.03.009. [DOI] [PubMed] [Google Scholar]
- 14.de Lima CR, Baccarin RYA, Michelacci YM. Clin. Chim. Acta. 2007;378:206–215. doi: 10.1016/j.cca.2006.11.025. [DOI] [PubMed] [Google Scholar]
- 15.Krumbiegel M, Arnold K. Chem. Phys. Lipids. 1990;54:1–7. doi: 10.1016/0009-3084(90)90053-t. [DOI] [PubMed] [Google Scholar]
- 16.Satoh A, Toida T, Yoshida K, Kojima K, Matsumoto I. FEBS Letters. 2000;477:249–252. doi: 10.1016/s0014-5793(00)01746-4. [DOI] [PubMed] [Google Scholar]
- 17.Lasch J, Weissig V, Brandl M. In: Liposomes. Second Edition. Torchilin VP, Weissig V, editors. New York: Oxford University Press; 2003. [Google Scholar]
- 18.Banerjee J, Haldar MK, Manokaran S, Mallik S, Srivastava DK. New Fluorescent Probes for Carbonic Anhydrases. Chem. Commun. 2007:3377–3379. doi: 10.1039/b701421j. [DOI] [PubMed] [Google Scholar]
- 19.Miranda OR, Creran B, Rotello VM. Curr. Opin. Chem. Biol. 2010;14:728–736. doi: 10.1016/j.cbpa.2010.07.021. [DOI] [PMC free article] [PubMed] [Google Scholar]
- 20.Bunz UHF, Rotello VM. Angew. Chem. Int. Ed. 2010;49:3268–3279. doi: 10.1002/anie.200906928. [DOI] [PubMed] [Google Scholar]
- 21.Bajaj A, Miranda OR, Phillips R, Kim IB, Berry JD, Bunz UHF, Rotello VM. J. Am. Chem. Soc. 2010;132:1018–1022. doi: 10.1021/ja9061272. [DOI] [PMC free article] [PubMed] [Google Scholar]
- 22.Johnson R, Wichern D. Applied Multivariate Data Analysis. 5th Ed. NJ: Prentice Hall; 2002. [Google Scholar]
Associated Data
This section collects any data citations, data availability statements, or supplementary materials included in this article.


