

Abstract
Background
The interaction between apolipoprotein A-II (APOA2) m265 genotype and saturated fat for obesity traits has been more extensively demonstrated than for any other locus, but behavioural and hormonal mechanisms underlying this relationship are unexplored. In this study, we evaluated relationships between APOA2 and obesity risk with particular focus on patterns of eating and ghrelin, a hormonal regulator of food intake.
Design
Cross-sectional study.
Subjects
Overweight and obese subjects (n = 1225) were evaluated at baseline in five weight loss clinics in southeastern Spain.
Methods
Behavioural data were assessed using a checklist of weight loss obstacles. Logistic regression models were fitted to estimate the risk of a specific behaviour associated with APOA2 genotype. Relationships between APOA2 genotype and saturated fat intakes for anthropometric traits and plasma ghrelin were evaluated by analysis of variance. To construct categorical variables to evaluate interactions, saturated fat intake was dichotomized into high and low according to the population median intake or as tertiles.
Results
Homozygous minor (CC) subjects were more likely to exhibit behaviours that impede weight loss (‘Do you skip meals’, odds ratio (OR) = 2.09, P=0.008) and less likely to exhibit the protective behaviour of ‘Do you plan meals in advance’ (OR = 0.64, P=0.034). Plasma ghrelin for CC subjects consuming low saturated fat was lower compared with (1) CC subjects consuming high saturated fat, (2) TT + TC carriers consuming low saturated fat and (3) TT+TC carriers consuming high saturated fat (all P<0.05).
Conclusions
APOA2 m265 genotype may be associated with eating behaviours and dietary modulation of plasma ghrelin. Expansion of knowledge of APOA2 and obesity to include modulation of specific behaviours and hormonal mediators not only broadens understanding of gene–diet interactions, but also facilitates the pragmatic, future goal of developing dietary guidelines based on genotype.
Keywords: apolipoprotein A-II, behaviour, ghrelin, saturated fat, genetics
Introduction
New obesity loci continue to be identified through genome-wide association studies in populations of increasing size and ethnic diversity1-4 but understanding of the mechanisms by which known genetic variants contribute to obesity remains limited. Several well-established obesity candidates encode proteins that appear to modulate obesity risk via energy intake, a key determinant of obesity risk.5-7 However, specific behaviours that underlie increased intakes are largely unexplored from the perspective of genetics.
Although association studies evaluating genes, energy intake and obesity often interpret relationships without the benefit of detailed behavioural data, behavioural scientists have identified a range of specific eating behaviours that contribute to obesity.8-11 Complementing the large number of studies defining obesity–behaviour linkages are those which investigate the heritability of specific behaviours using population and twin data. Patterns of eating including restrained and emotional eating, externally cued overeating and appetitive behaviours appear to be moderately to highly heritable.12-14 Identification of genetic variants that may contribute to the heritability of eating patterns will require focused attention on specific variants with demonstrated roles in energy intake and obesity.
One candidate that alters obesity risk via altered energy intake is apolipoprotein A-II (APOA2), which is encoded by APOA2. APOA2, a major component of high-density lipoprotein (HDL) particles, is a regulator of triglyceride metabolism and postprandial metabolism15,16 for which connections between serum APOA2 concentration, alcohol intake and body mass index (BMI) were initially described nearly two decades ago.17 More recently, relationships between an APOA2 promoter variant and obesity have been clearly demonstrated. First, an association between APOA2 m265T>C, energy intake and obesity was shown in a single population, for which higher energy, macronutrient intake and anthropometric traits were detected in homozygous minor allele (CC) carriers.7 These initial findings were expanded through replication of a gene–diet interaction in three US populations, a Mediterranean population and in Asian Indians in which APOA2 m265 T>C genotype was associated with increased BMI or obesity in the context of high saturated fat intake.18,19
Evidence for APOA2 as a modulator of intake and obesity is robust, but relationships between APOA2 m265 T>C genotype and specific eating behaviours are unexplored. Also unidentified are potential hormonal mediators of the APOA2–nutrient interaction. Understanding the mechanisms underlying the relationships between APOA2, intake behaviours and obesity could facilitate the translation of genetic knowledge to more personalized behavioural approaches to reduce obesity. In this study, we evaluated relationships between APOA2 and obesity risk in a Mediterranean population, with particular focus on patterns of eating and ghrelin, a hormonal regulator of food intake.
Subjects and methods
Study design and subjects
Study subjects (n = 1402) were participants in treatment at five weight loss clinics located in Murcia, in southeastern Spain. All subjects were overweight (BMI≥25 kg m−2) or obese (BMI≥30 kg m−2). Individuals taking anti-lipemic medication, and those with diabetes, severe obesity (BMI≥40 kg m−2), renal failure, liver disease or cancer were excluded.
Anthropometrics, ghrelin and leptin
Weight was measured using a digital electronic balance (SecaAlpha, Igmy, France) and height was measured using a Harpenden digital stadiometer (Holtain Ltd, Crosswell, Wales, UK). Waist circumference was measured at the umbilicus. Anthropometric measurements were obtained according to guidelines of the Spanish Society for the Study of Obesity. Fasting blood samples were collected at 0800 hours for all subjects, centrifuged at 4 °C and stored at −70 °C until analyzed. Plasma leptin and ghrelin samples were measured by radioimmunoassay (Linco Research, St Charles, MO, USA). All samples for leptin and ghrelin were run in duplicate.
Dietary and behavioural data
Baseline nutrient intake was determined by a 24-h dietary recall based on the day before treatment began. Total energy intake and macronutrient composition were determined using Grunumur (version 1, 2006, University of Murcia, Murcia, Spain), a nutritional evaluation program, in conjunction with Spanish food composition tables. The type and duration of physical activity were estimated by the International Physical Activity Questionnaire.20
Behavioural data were assessed at baseline by subject completion of the Barriers to Weight Loss Checklist9,10 after careful explanation was provided by trained staff. The checklist consisted of 29 questions divided into seven sections which included: eating habits, portion size, food and drink choices, patterns of eating and other obstacles to weight loss. Individuals chose from three possible responses to questions about their performance of a particular eating behaviour: ‘Never’, ‘Sometimes’ or ‘Very often’.
Genetics analysis
DNA was extracted from lymphocytes using DNA isolation kits (Qiagen, Valencia, CA, USA). APOA2 single-nucleotide polymorphism APOA2 m265 (rs5082) was genotyped using the ABI TaqMan SNP genotyping system 7900HT (Applied Biosystems, Foster City, CA, USA) using standard procedures. Laboratory procedures in place to detect error include blinded no-template controls and DNA sample replicates. Genotype clusters were re-checked visually to rule-out genotyping error. Genotype data were obtained for 1225 individuals (96–97%). Genotype error rate was estimated at <0.5%.
Statistical analysis
All continuous variables were examined for normal distribution. Plasma ghrelin, leptin and physical activity were log-transformed to improve normality. Relationship between APOA2 genotype and anthropometric and dietary-related traits were evaluated by analysis of variance techniques with adjustment by age, gender, treatment centre and physical activity. Interactions between APOA2 genotype and categorical saturated fat intake for waist circumference and plasma ghrelin were evaluated by analysis of variance techniques. For waist circumference, saturated fat intake was evaluated categorically as grams per day (low: <20.7 g per day and high: ≥20.7 g per day. For plasma ghrelin, intake of saturated fat was expressed as a percentage of total energy intake. To construct categorical variables, saturated fat intake was classified into high and low groups according to the median intake of the population (9.7%). Saturated fat was also evaluated as tertiles for the outcome of plasma ghrelin, which corresponded to <8.1%, ≥8.1 and <13.1% and ≥13.1%. Interactions between dietary macronutrient intakes and the APOA2 polymorphism were tested in a multivariable model that controlled for age, gender and treatment centre. For the outcome of waist circumference, physical activity was added as a covariate.
Behavioural checklist responses consisted of the following three options: ‘Never’, ‘Sometimes’ or ‘Very often’. Responses were dichotomized into two categories in which ‘Never’ or ‘Sometimes’ responses were considered together and compared against ‘Very often’. Logistic regression models were fitted to estimate the risk (odds ratio (OR) and 95% confidence interval) of a given behaviour associated with APOA2 genotype.
SAS (version 9.1 for Windows; SAS Institute, Inc. Cary, North CA, USA) was used to analyze data. A P-value of <0.05 was considered statistically significant.
Results
Subject characteristics including anthropometric, dietary and genotypic data are presented in Table 1. Genotype frequencies for the APOA2 m265 single-nucleotide polymorphism did not deviate from Hardy–Weinberg equilibrium expectations (P = 0.561). Minor allele frequency for APOA2 m265 was 0.35. On the basis of the previous evidence for APOA2 in which associations and interactions were consistently demonstrated using a recessive model,7,18,19APOA2 genotype was evaluated by comparing homozygous minor allele carriers (CC) with combined homozygous major (TT) and heterozygous (TC) subjects. Anthropometric measures did not differ according to APOA2 m265 genotype, but dietary intakes including total energy intake and carbohydrate intake were higher in CC subjects compared with combined heterozygotes (TC) and homozygous major (TT) carriers (P<0.05; Table 2). Total fat intake (P=.050) and saturated fat intake (P=0.085) tended to be higher in CC subjects but these differences did not reach significance. Plasma ghrelin did not differ between the two genotype groups. We re-evaluated associations in Table 2 by adding plasma HDL cholesterol as an additional covariate but did not observe substantial changes in significant relationships.
Table 1.
| Women | Men | |
|---|---|---|
| Age, year | 39±12 | 41±13 |
| BMI, kgm−2 | 30.5±5.2 | 34.3±5.0 |
| BMI≥30 kgm−2, n (%) | 468 (47) | 173 (81) |
| Waist, cm | 99±14 | 116±13 |
| Hip, cm | 113±10 | 117±9 |
| Total energy, kcal per day | 2020±685 | 2368±859 |
| Monounsaturated fat, g per day | 43.6±21.3 | 51.6±23.8 |
| Saturated fat, g per day | 23.6±13.7 | 28.2±16.8 |
| Polyunsaturated fat, g per day | 10.6±5.6 | 12.3±6.4 |
| Current smokers, n (%) | 232 (23.1) | 55 (25.8) |
| APOA2 m265, n (%) | ||
| TT | 408 (40.6) | 99 (46.5) |
| TC | 474 (47.1) | 92 (43.2) |
| CC | 124 (12.3) | 22 (10.3) |
| Minor allele frequency | 0.36 | 0.49 |
Abbreviations: APOA2, apolipoprotein A-II; BMI, body mass index.
Data are means±s.d. or n (%).
Data are shown only for genotyped subjects.
Table 2.
| TT+TC (n=1065) | CC (n=142) | P | Pc | |
|---|---|---|---|---|
| BMI, kg m−2 | 32.3±0.2 | 32.7±0.5 | 0.363 | 0.543 |
| Waist, cm | 106.8±0.6 | 108.2±1.3 | 0.259 | 0.457 |
| Energy intake, kcal per day | 2216.8±47.3 | 2445.7±93.0 | 0.011 | 0.007 |
| Carbohydrate intake, g per day | 232.0± 5.8 | 262.4±11.4 | 0.006 | 0.004 |
| Fat intake, g per day | 104.6±3.0 | 115.7±5.9 | 0.050 | 0.039 |
| Saturated fat intake, g per day | 24.7±0.9 | 27.7±1.8 | 0.085 | 0.077 |
| Polyunsaturated fat intake, g per day | 11.1±0.4 | 12.0±0.7 | 0.178 | 0.145 |
| Monounsaturated fat intake, g per day | 45.4±1.4 | 47.7± 2.8 | 0.383 | 0.335 |
| Protein, g per day | 88.6±2.2 | 92.8±4.3 | 0.308 | 0.269 |
| Ghrelin, pgml−1 | 895.9±1.0 | 871.3±1.1 | 0.669 | 0.546 |
Abbreviations: APOA2, apolipoprotein A-II; BMI, body mass index.
Data are means±s.e.m.
Data are adjusted for age, gender, treatment centre and physical activity.
Data are adjusted for age, gender, treatment centre, physical activity and HDL cholesterol.
APOA2, waist and saturated fat
We evaluated the interaction between saturated fat intake and APOA2 genotype for waist circumference by dichotomizing saturated fat intake into low (<20.7 g per day) and high (≥20.7 g per day) according to the population median intake (Figure 1). A significant interaction term between genotype and saturated fat was obtained (P=0.039) and at high intake of saturated fat, waist circumference was greater in minor allele homozygotes (CC) compared with non-minor allele carriers (TC and TT; P=0.009). Significance was not altered by addition of total grams of fat (polyunsaturated, saturated, monounsaturated and trans) as a covariate to the model. When HDL cholesterol was added as an additional covariate to the model for the outcome of waist circumference, significance of the interaction term was reduced from P=0.039 to P=0.071, indicating that the association was no longer significant.
Figure 1.
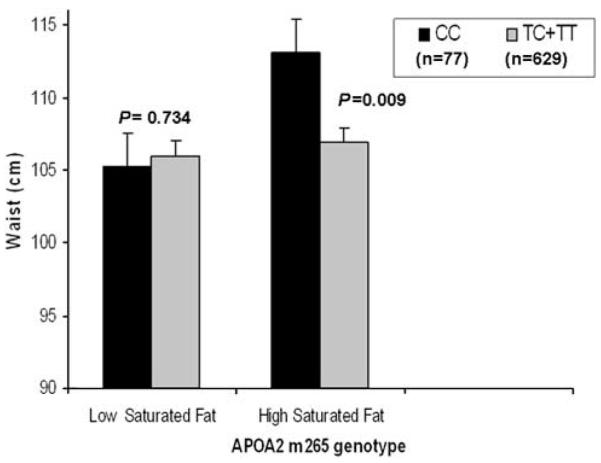
Mean waist circumference by APOA2 m265 genotype and saturated fat intake. Error bars indicate standard error (s.e.) of means. Low saturated fat, <20.7 (grams per day) and high saturated fat, <20.7 (grams per day). Means were adjusted for age, gender, centre and physical activity. P-values were obtained through comparisons of means for genotype according to saturated fat intake. P for interaction was obtained for the interaction between genotype and saturated fat intake.
APOA2 and eating behaviour
Next, we used logistic regression to examine relationships between APOA2 genotype and behavioural traits, which have been previously evaluated as barriers to weight loss. For each behavioural question, subjects quantified their participation in the behaviour as ‘Never’, ‘Sometimes’ or ‘Very often’. Responses were dichotomized into two categories to increase power for logistic evaluation in which ‘Never’ or ‘Sometimes’ responses were considered together and compared against ‘Very often’. Homozygous minor subjects were more likely to exhibit a behaviour identified as an obstacle for weight loss (‘Do you skip meals’, OR=2.09, P=0.008) and less likely to exhibit the protective behaviour of ‘Do you plan meals in advance’ (OR=0.64, P=0.034; Table 3). For two other behaviours patterns of eating relevant to weight loss, homozygous minor subjects tended to be less likely to exhibit the protective behaviour (‘Do you eat vegetables three times a week’, OR=0.61, P=0.109) and more likely to exhibit the obstacle behaviour (‘Do you binge’, OR=0.158, P=0.151) but these differences did not reach significance.
Table 3.
|
Never or sometimes exhibit the behaviour, n |
Very often exhibit the behaviour, n |
Odds ratio |
95% CI lower |
95 % CI upper |
P | ||
|---|---|---|---|---|---|---|---|
| TC+TT | Do you skip meals? | 846 | 81 | 1 | |||
| CC | 102 | 21 | 2.09 | 1.22 | 3.59 | 0.008 | |
| TC+TT | Is your eating planned in advance? | 450 | 457 | 1 | |||
| CC | 68 | 48 | 0.64 | 0.43 | 0.96 | 0.034 | |
| TC+TT | Do you have binges? | 845 | 80 | 1 | |||
| CC | 107 | 15 | 1.58 | 0.85 | 2.94 | 0.151 | |
| TC+TT | Do you eat vegetables three times a week? | 76 | 852 | 1 | |||
| CC | 15 | 108 | 0.61 | 0.34 | 1.12 | 0.109 |
Abbreviations: APOA2, apolipoprotein A-II; CI, confidence interval; OR, odds ratio.
OR represents the likelihood of exhibiting the behaviour for APOA2 m265 CC subjects compared to TT+TC subjects (reference group).
Adjusted by age, gender and treatment centre.
Saturated fat and plasma ghrelin and leptin
Finally, we evaluated interactions between saturated fat intake as a percentage of total energy and APOA2 genotype for plasma ghrelin concentration. When saturated fat was evaluated by dichotomizing into high and low intakes, the interaction term tended towards significance (P=0.074; data not shown). When evaluated according to saturated fat tertiles, the interaction term was closer to significant (P=0.056; Figure 2). Plasma ghrelin for CC subjects consuming saturated fat at the lowest tertile was lower compared with three other groups: (1) CC subjects consuming saturated fat at the highest tertile (P=0.013), (2) TT+TC carriers consuming the lowest saturated fat tertile (P=0.030) and (3) TT+TC subjects consuming the highest saturated fat tertile (P=0.041). When we tested for an association between saturated fat intake and plasma ghrelin subdivided by APOA2 genotype results were nonsignificant in CC subjects (P=0.167) and in TT+TC subjects (P=0.993). We also tested for interaction between dichotomized saturated fat and APOA2 genotype for the outcome of plasma leptin and the interaction was not significant (P=0.462).
Figure 2.
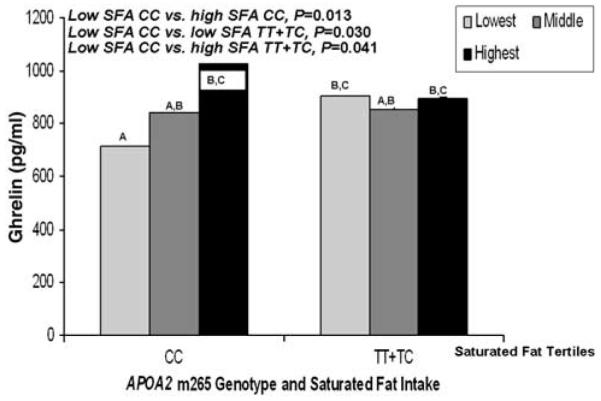
Mean plasma ghrelin (pg ml−1) by APOA2 m265 genotype and tertiles of saturated fat intake (n=425). Lowest saturated fat, <8.1 (percentage of total energy); middle saturated fat, ≥8.1 (percentage of total energy) and <13.1 (percentage of total energy); highest saturated fat, ≥13.1 (percentage of total energy). Means were adjusted for age, gender and centre. P-values were obtained through comparisons of means for genotype according to saturated fat intake. P for interaction was obtained for the interaction between genotype and saturated fat intake. Means marked with different letters differ, P<0.05.
Discussion
We have detected relationships between APOA2 m265 genotype and intake-related behaviours, which may underlie previously reported connections between APOA2, energy and nutrient intake, and obesity. Specifically, eating behaviours that have been identified as related to obesity risk8,11 appear to be associated with APOA2 genotype in a manner consistent with obesity risk. Secondarily, previously reported interactions between APOA2 and saturated fat for obesity may be mediated via modulation of plasma ghrelin. If additional studies confirm these findings, they may present new possibilities for optimizing obesity management through specific behavioural interventions. They also support a relationship between APOA2, saturated fat and hormonal regulation of food intake, which may be relevant to weight control.
The behavioural traits that differed by genotype in this study are established contributors to obesity risk for which relationships to APOA2 have not been previously explored. Responses to the questions ‘Do you skip meals’ and ‘Is your eating planned in advance’ are routinely evaluated in the treatment of patients in the weight loss clinic setting from which the current study subjects are enrolled.9,10 These behaviours have been investigated for obesity risk in other groups as well including Spanish adolescents and African Americans. In African-American women, ‘haphazard planning’ was correlated with both the consumption of fat and with self-reported BMI.11 In Spanish adolescents, the skipping of meals was strongly associated with obesity risk in boys and girls.8 The heritability of these specific traits has not been reported, but genetically modulated behaviours could account, in part, for the large heritability of obesity.12,14 Eating is a complex behaviour, which is strongly modified by environment, but appetitive traits such as ‘slowness in eating’ and ‘responsiveness to food’ were shown to be highly heritable (54–84%) in twins as young as 3 months.13 In this study, the set of altered behaviours appear to represent a logical cluster broadly reflecting ‘planning around food’. For example, a lack of planning could lead to both skipping meals and subsequent binge eating, and fruits and vegetables, as perishable foods, may require more planning to acquire and prepare. Further, ‘lack of planning ahead’ was correlated with percentage of calories from fat in African-American women, suggesting that reduced planning may adversely affect dietary composition.11
Analysis of APOA2 genotype and specific behaviours has not been previously reported, but APOA2 has been previously linked to eating behaviour as reflected by energy intake. Our study is consistent with the work of Corella et al.7 in which homozygotes for the minor allele (CC) exhibited greater energy intake and greater intake of nutrients. Also confirmed in our study is the interaction between saturated fat intake and anthropometric traits. In two previous studies, high saturated fat intake in minor allele homozygotes was associated with higher BMI in three US populations (including Whites and Puerto Ricans), and an elderly Spanish population and with increased obesity risk in Asian Indians living in Singapore.18,19 In this study of a Mediterranean population, we report a similar interaction between genotype and saturated fat for waist circumference such that waist was greater in CC subjects consuming high saturated fat compared with non-CC subjects.
Mechanisms to account for the interaction between saturated fat, APOA2 and obesity-related traits demonstrated in this and previous studies are unknown, but appear to involve altered intakes. Whether fatty acid saturation differentially modulates satiety or energy intake in people is unclear based on studies conducted independently of genotype. In one randomized trial, different proportions of monounsaturated, polyunsaturated and saturated fatty acids supplied in a high fat meal did not alter satiety or energy intake at a subsequent meal.21 However, in a second study in which fat emulsions were infused into the small intestine of human volunteers, triacylglycerols composed of unsaturated fatty acids (C18:2 and C18:1) increased satiety (without altering food intake) whereas those composed of saturated fatty acids (C18:0) affected neither.22 In a third study using infusions of 18 carbon chain fatty acids (C18:0, C18:1 and C18:2), only linoleic acid (C18:2) reduced food intake without affecting appetite.23 The lack of consistency between measures of satiety/appetite and food intake in these studies may reflect difficulties associated with interpretation of subjectively assessed data, but we may also hypothesize that APOA2 genotype modulates the relationship between saturated fat and satiety/appetite, as well as BMI and waist.
In this study, satiety and appetite measures were not collected, but we were able to evaluate other potential mechanisms involving the orexigenic hormone ghrelin. Saturated fat interacted with APOA2 genotype to modulate plasma ghrelin (marginally) as well as waist circumference (significantly). Lower saturated fat was associated with lower ghrelin in CC carriers, which may theoretically be expected to accompany lower energy intake and smaller body size. From the perspective of both ghrelin and waist size, high saturated fat intake is detrimental to minor allele homozygotes (CC). Although no previous studies evaluated macronutrients and ghrelin in light of APOA2, others have investigated the role of macronutrients on ghrelin concentration using either acute (single meal) or longer term dietary exposures. Following single test meals supplied to children24 and adolescents,25 serum ghrelin concentrations and hunger or intake were differentially modified by different macronutrient proportions (for example, total fat, protein and carbohydrate) with somewhat different outcomes. The effect of longer term dietary factors on ghrelin is similarly inconclusive. Ghrelin did not vary according to macronutrient intake in a 6-week crossover intervention.26 However, habitual saturated fat intake was positively associated with plasma ghrelin in overweight or obese women with elevated insulin.27 Our study population also consists of predominantly female overweight and obese individuals whose dietary intakes reflect usual behaviours.
Several limitations for this study must be considered. Behaviours regulating energy intake and obesity reflect complex physiological and cognitive processes, and the physiological role of APOA2 is not yet well understood. We are also limited in our ability to evaluate mechanisms and by our overall sample size, which constrains our ability to detect gene–diet interactions. In particular, although the data support a role for ghrelin in modulating the interaction between nutrient and genotype, the sample size for individuals in which all three measurements are available is small. Additionally, saturated fat intake as estimated through dietary recall may underestimate intake, especially in over-weight and obese individuals,28 which comprise the current population. The consequences of underestimation in gene–nutrient analyses are difficult to assess and may depend on the relative effect sizes of each component (gene and nutrient) as well as whether the nutrient acts in a dose-response fashion or requires a threshold level. Further, although APOA2 is abundant on HDL particles and adjustment by HDL cholesterol caused the interaction term to become insignificant for the outcome of waist circumference (P=0.071), we were unable to demonstrate that adjustment by HDL cholesterol substantially modified APOA2-related outcomes, and cannot establish a relationship between plasma HDL concentration and APOA2 function. Finally, although our study was conducted in the setting of a weight loss clinic, nutrient intake and anthropometric traits were assessed at baseline, before weight loss treatment, representing a cross-sectional analysis. Studies evaluating APOA2, weight loss outcomes, nutrients, ghrelin and behaviour over the course of weight loss treatment would provide an ideal approach for future work.
In summary, we have detected genotype-associated differences in specific intake-related behaviours, which may contribute to obesity risk. Further, we have identified a possible role for ghrelin in modulating APOA2–nutrient interactions, which have been identified in six populations of varying ethnicity and nationality, including this study. Confirmation of gene–nutrient interactions in independent populations is critical to establishing scientific credibility, but is unfortunately not commonly reported in the literature. Demonstration of APOA2 m265–saturated fat relationship represents a rare exception, for which replication of a gene–diet interaction has been more extensively demonstrated than for any other locus. Expansion of our knowledge of APOA2 and obesity to include modulation of specific behaviours and hormonal mediators not only broadens understanding, but also brings us closer to the pragmatic, future goal of developing dietary guidelines based on genotype.
Acknowledgements
This study was supported by the National Institutes of Health, National Institute on Aging, Grant Number 5P01AG 023394-02 and NIH/NHLBI Grant Number HL54776 and NIH/NIDDK DK075030 and contracts 53-K06-5-10 and 58-1950-9-001 from the US Department of Agriculture Research Service.
Footnotes
Conflict of interest The authors declare no conflict of interest.
References
- 1.Scherag A, Dina C, Hinney A, Vatin V, Scherag S, Vogel CI, et al. Two new loci for body-weight regulation identified in a joint analysis of genome-wide association studies for early-onset extreme obesity in French and German study groups. PLoS Genet. 2010;6:e1000916. doi: 10.1371/journal.pgen.1000916. [DOI] [PMC free article] [PubMed] [Google Scholar]
- 2.Heid IM, Jackson AU, Randall JC, Winkler TW, Qi L, Steinthorsdottir V, et al. Meta-analysis identifies 13 new loci associated with waist-hip ratio and reveals sexual dimorphism in the genetic basis of fat distribution. Nat Genet. 2010;42:949–960. doi: 10.1038/ng.685. [DOI] [PMC free article] [PubMed] [Google Scholar]
- 3.Speliotes EK, Willer CJ, Berndt SI, Monda KL, Thorleifsson G, Jackson AU, et al. Association analyses of 249 796 individuals reveal 18 new loci associated with body mass index. Nat Genet. 2010;42:937–948. doi: 10.1038/ng.686. [DOI] [PMC free article] [PubMed] [Google Scholar]
- 4.Sha BY, Yang TL, Zhao LJ, Chen XD, Guo Y, Chen Y, et al. Genome-wide association study suggested copy number variation may be associated with body mass index in the Chinese population. J Hum Genet. 2009;54:199–202. doi: 10.1038/jhg.2009.10. [DOI] [PMC free article] [PubMed] [Google Scholar]
- 5.Cole SA, Butte NF, Voruganti VS, Cai G, Haack K, Kent JW, Jr, et al. Evidence that multiple genetic variants of MC4R play a functional role in the regulation of energy expenditure and appetite in Hispanic children. Am J Clin Nutr. 2010;91:191–199. doi: 10.3945/ajcn.2009.28514. [DOI] [PMC free article] [PubMed] [Google Scholar]
- 6.Stutzmann F, Cauchi S, Durand E, Calvacanti-Proenca C, Pigeyre M, Hartikainen AL, et al. Common genetic variation near MC4R is associated with eating behaviour patterns in European populations. Int J Obes (Lond) 2009;33:373–378. doi: 10.1038/ijo.2008.279. [DOI] [PubMed] [Google Scholar]
- 7.Corella D, Arnett DK, Tsai MY, Kabagambe EK, Peacock JM, Hixson JE, et al. The −256T>C polymorphism in the apolipoprotein A-II gene promoter is associated with body mass index andfood intake in the genetics of lipid lowering drugs and diet network study. Clin Chem. 2007;53:1144–1152. doi: 10.1373/clinchem.2006.084863. [DOI] [PubMed] [Google Scholar]
- 8.Mdel M Bibiloni, Martinez E, Llull R, Juarez MD, Pons A, Tur JA. Prevalence and risk factors for obesity in Balearic Islands adolescents. Br J Nutr. 2010;103:99–106. doi: 10.1017/S000711450999136X. [DOI] [PubMed] [Google Scholar]
- 9.Tutau MD Corbalán, Falo EM Morales, Laliga JC Baraza, Jordana MC, Garaulet M. Major barriers to weight loss in patients attending a Mediterranean diet-based behavioural therapy: the Garaulet method. Revista Española de Obesidad. 2009;7:144–154. [Google Scholar]
- 10.Corbalán MD, Morales EM, Canteras M, Espallardo A, Hernandez T, Garaulet M. Effectiveness of cognitive-behavioural therapy based on the Mediterranean diet for the treatment of obesity. Nutrition. 2009;25:861–869. doi: 10.1016/j.nut.2009.02.013. [DOI] [PubMed] [Google Scholar]
- 11.Schlundt DG, Hargreaves MK, Buchowski MS. The eating behavior patterns questionnaire predicts dietary fat intake in African American women. J Am Diet Assoc. 2003;103:338–345. doi: 10.1053/jada.2003.50049. [DOI] [PubMed] [Google Scholar]
- 12.Sung J, Lee K, Song YM, Lee MK, Lee DH. Heritability of eating behaviour assessed using the DEBQ (Dutch Eating Behaviour Questionnaire) and weight-related traits: the Healthy Twin Study. Obesity. 2010;18:1000–1005. doi: 10.1038/oby.2009.389. [DOI] [PubMed] [Google Scholar]
- 13.Llewellyn CH, van Jaarsveld CH, Johnson L, Carnell S, Wardle J. Nature and nurture in infant appetite: analysis of the Gemini twin birth cohort. Am J Clin Nutr. 2010;91:1172–1179. doi: 10.3945/ajcn.2009.28868. [DOI] [PubMed] [Google Scholar]
- 14.Tholin S, Rasmussen F, Tynelius P, Karlsson J. Genetic and environmental influences on eating behaviour: the Swedish Young Male Twins Study. Am J Clin Nutr. 2005;81:564–569. doi: 10.1093/ajcn/81.3.564. [DOI] [PubMed] [Google Scholar]
- 15.Julve J, Escola-Gil JC, Rotllan N, Fievet C, Vallez E, de la Torre C, et al. Human apolipoprotein A-II determines plasma triglycerides by regulating lipoprotein lipase activity and high-density lipoprotein proteome. Arterioscler Thromb Vasc Biol. 2010;30:232–238. doi: 10.1161/ATVBAHA.109.198226. [DOI] [PubMed] [Google Scholar]
- 16.Delgado-Lista J, Perez-Jimenez F, Tanaka T, Perez-Martinez P, Jimenez-Gomez Y, Marin C, et al. An apolipoprotein A-II polymorphism (−265T/C, rs5082) regulates postprandial response to a saturated fat overload in healthy men. J Nutr. 2007;137:2024–2028. doi: 10.1093/jn/137.9.2024. [DOI] [PubMed] [Google Scholar]
- 17.Hosokai H, Tamura S, Koyama H, Satoh H. Drinking habits influence the relationship between apolipoprotein AII and body mass index. J Nutr Sci Vitaminol (Tokyo) 1993;39:235–242. doi: 10.3177/jnsv.39.235. [DOI] [PubMed] [Google Scholar]
- 18.Corella D, Tai ES, Sorli JV, Chew SK, Coltell O, Sotos-Prieto M, et al. Association between the APOA2 promoter polymorphism and body-weight in Mediterranean and Asian populations. IntJObes. 2010 doi: 10.1038/ijo.2010.187. advance online publication, 26 October 2010, doi:10.1038/ijo.2010.187. [DOI] [PMC free article] [PubMed] [Google Scholar]
- 19.Corella D, Peloso G, Arnett DK, Demissie S, Cupples LA, Tucker KL, et al. APOA2, dietary fat, and body mass index: replication of a gene-diet interaction in 3 independent populations. Arch Intern Med. 2009;169:1897–1906. doi: 10.1001/archinternmed.2009.343. [DOI] [PMC free article] [PubMed] [Google Scholar]
- 20.Hagströmer M, Oja P, Sjöström M. The International Physical Activity Questionnaire (IPAQ): a study of concurrent and construct validity. Public Health Nutr. 2006;9:755–762. doi: 10.1079/phn2005898. [DOI] [PubMed] [Google Scholar]
- 21.Strik CM, Lithander FE, McGill AT, MacGibbon AK, McArdle BH, Poppitt SD. No evidence of differential effects of SFA, MUFA or PUFA on post-ingestive satiety and energy intake: a randomised trial of fatty acid saturation. Nutr J. 2010;9:24. doi: 10.1186/1475-2891-9-24. [DOI] [PMC free article] [PubMed] [Google Scholar]
- 22.Maljaars J, Romeyn EA, Haddeman E, Peters HP, Masclee AA. Effect of fat saturation on satiety, hormone release, and food intake. Am J Clin Nutr. 2009;89:1019–1024. doi: 10.3945/ajcn.2008.27335. [DOI] [PubMed] [Google Scholar]
- 23.French SJ, Conlon CA, Mutuma ST, Arnold M, Read NW, Meijer G, et al. The effects of intestinal infusion of long-chain fatty acids on food intake in humans. Gastroenterol. 2000;119:943–948. doi: 10.1053/gast.2000.18139. [DOI] [PubMed] [Google Scholar]
- 24.Lomenick JP, Melguizo MS, Mitchell SL, Summar ML, Anderson JW. Effects of meals high in carbohydrate, protein, and fat on ghrelin and peptide YY secretion in prepubertal children. J Clin Endocrinol Metab. 2009;94:4463–4471. doi: 10.1210/jc.2009-0949. [DOI] [PMC free article] [PubMed] [Google Scholar]
- 25.Misra M, Tsai PM, Mendes N, Miller KK, Klibanski A. Increased carbohydrate induced ghrelin secretion in obese vs normal-weight adolescent girls. Obesity. 2009;17:1689–1695. doi: 10.1038/oby.2009.86. [DOI] [PMC free article] [PubMed] [Google Scholar]
- 26.Beasley JM, Ange BA, Anderson CA, Miller ER, III, Erlinger TP, Holbrook JT, et al. Associations between macronutrient intake and self-reported appetite and fasting levels of appetite hormones: results from the Optimal Macronutrient Intake Trial to Prevent Heart Disease. Am J Epidemiol. 2009;169:893–900. doi: 10.1093/aje/kwn415. [DOI] [PMC free article] [PubMed] [Google Scholar]
- 27.Kong A, Neuhouser ML, Xiao L, Ulrich CM, McTiernan A, Foster-Schubert KE, et al. Higher habitual intake of dietary fat and carbohydrates are associated with lower leptin and higher ghrelin concentrations in overweight and obese postmenopausal women with elevated insulin levels. Nutr Res. 2009;29:768–776. doi: 10.1016/j.nutres.2009.10.013. [DOI] [PMC free article] [PubMed] [Google Scholar]
- 28.Johansson G, Wikman A, Ahrén AM, Hallmans G, Johansson I. Underreporting of energy intake in repeated 24-h recalls related to gender, age, weight status, day of interview, educational level, reported food intake, smoking habits and area of living. Public Health Nutr. 2001;4:919–927. doi: 10.1079/phn2001124. [DOI] [PubMed] [Google Scholar]