Abstract
The independent trajectory thermodynamic integration (IT-TI) approach (Lawrenz et. al J. Chem. Theory. Comput. 2009, 5:1106-11161) for free energy calculations with distributed computing is employed to study two distinct cases of protein-ligand binding: first, the influenza surface protein N1 neuraminidase bound to the inhibitor oseltamivir, and second, the M. tuberculosis enzyme RmlC complexed with the molecule CID 77074. For both systems, finite molecular dynamics (MD) sampling and varied molecular flexibility give rise to IT-TI free energy distributions that are remarkably centered on the target experimental values, with a spread directly related to protein, ligand, and solvent dynamics. Using over 2 μs of total MD simulation, alternative protocols for the practical, general implementation of IT-TI are investigated, including the optimal use of distributed computing, the total number of alchemical intermediates, and the procedure to perturb electrostatics and van der Waals interactions. A protocol that maximizes predictive power and computational efficiency is proposed. IT-TI outperforms traditional TI predictions and allows a straightforward evaluation of the reliability of free energy estimates. Our study has broad implications for the use of distributed computing in free energy calculations of macromolecular systems.
Keywords: convergence; distributed computing; dTDP-6-deoxy-d-xylo-4-hexopyranosid-4-ulose 3,5-epimerase; hydration; Independent-Trajectory Thermodynamic Integration; microsecond molecular dynamics; neuraminidase; oseltamivir; protein-ligand binding; RmlC
1 Introduction
Alchemical free energy methods often employ molecular dynamics (MD) simulations of unphysical intermediate microstates in order to calculate the free energy difference between two physically relevant canonical ensembles. Examples are the relative binding free energy difference between different ligands to a receptor, or the free energy change upon transferral of a ligand and protein from the unbound to the bound state. The latter is often referred to as the absolute binding free energy described by the thermodynamic cycle in Scheme 1.2–8 Although MD-based free energy calculations rely on rigorous statistical mechanics principles,6,7,9,10 their practical application is still challenging for systems with numerous degrees of freedom. MD sampling may be trapped in confined regions of conformational space due to the frustrated nature of protein and ligand energy landscapes, thus leading to insufficient statistics.
Scheme 1.
Thermodynamic cycle underlying alchemical absolute binding free energy calculations.
The use of independent MD simulations recently proved to be an appealing strategy to alleviate this issue, particularly with the rapid and steady increase of computational power in the form of multiple CPU and GPU clusters. This approach was applied to a number of systems in different flavors. Fujitani et al. employed multiple free energy perturbation (FEP) calculations to estimate absolute free energies of FKBP ligand binding.11 Zagrovic et al. used multiple one-step perturbation runs to calculate relative free energies of PDE5 ligand binding.12 In Mobley et al. and Boyce et al, multiple FEP calculations for different docked ligand binding poses were used to predict relative and absolute binding free energies for ligands to engineered binding sites of T4 Lysozyme.13,14 Lawrenz et al. employed independent trajectory thermodynamic integration (IT-TI) to obtain accurate absolute free energies for peramivir binding to N1 neuraminidase, as well as relative binding free energies of alchemically modified compounds.1 The latter study also emphasized the importance of solvent effects in this context. Accurate free energies are needed for all states of the thermodynamic cycle of interest (see Scheme 1) to achieve high predictive power, as realized since the pioneering applications of alchemical approaches.3,4,15,16 Here, we use IT-TI to compute absolute binding free energies for two ligands to two protein drug targets with different active site structural and chemical properties.
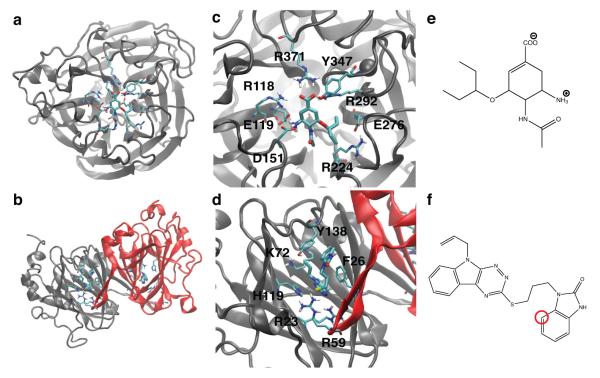
First, we consider the influenza surface protein N1 neuraminidase binding to oseltamivir.17 N1 neuraminidase facilitates viral shedding from infected cells and is a key target for treatment of pandemic flu. The N1 active site is composed of flexible loops1,18 and is highly solvent exposed (see Figure 1a, c). The ligand oseltamivir has zero net charge, but contains one ammonium group and one carboxyl group (Figure 1e); the latter forms salt bridges with the arginine triad binding motif (R118, R292, and R371 in Figure 1c).17 Electrostatic interactions have been characterized as the dominant contribution to ligand binding.1,19 Oseltamivir is flexible due to ten non-stericallly-hindered rotatable bonds, including a branched aliphatic tail that occupies a hydrophobic subpocket.1,20
Figure 1.
Protein-ligand structures of the investigated systems. Overall view of the N1 monomer (a) and RmlC dimer (b) structures are shown, with the RmlC monomers in (b) colored to highlight the interface. The active site residues of the two proteins are labeled for N1 in (c) and for RmlC in (d). Ligand chemical structures are depicted for the N1 ligand oseltamivir (e) and the RmlC inhibitor 77074 (f), the latter with the restrained atom (see Methods) highlighted in red. For oseltamivir, the center of mass was restrained, not a single atom (see Methods).
Second, we study the Mycobacterium tuberculosis enzyme dTDP-6-deoxy-d-xylo-4-hexopyranosid-4-ulose 3,5-epimerase (RmlC), which is crucial for assembly of the mycobacterial waxy, impermeable cell wall, and is a viable drug target.21 In this case, the bound ligand, Compound Identifier (CID) 77074, was a top hit from virtual screening, followed by experimental validation.21 The RmlC binding site is organized into β-sheets and is smaller and narrower than that in N1 (compare Figure 1a, c and b, d). Aromatic residues Y138, F26, and H119 stack against the ligand aromatic rings (see Figure 1d). The ligand itself contains seven rotatable bonds, with limited flexibility due to the presence of two bulky ring groups (Figure 1f).
We investigate to which extent protein, ligand, and solvent dynamics influence the reliability of absolute binding free energies computed with TI. Using IT-TI, we see that finite sampling and varied molecular flexibility of the two investigated protein-ligand systems give rise to distributions of free energy estimates. This observation is in line with previous suggestions for N1 neuraminidase based on more reduced statistics.1 We show that the features of these distributions - while remarkably centered around the target experimental values - are linked to protein, ligand, and solvent dynamic sampling. Additionally, we use statistics from over 2 μs of overall IT-TI simulation time to compare different approaches for optimal distributed computing and alternative protocols for the practical application of TI. We suggest a protocol that is optimal for two systems with different dynamic properties. Future work will investigate whether this protocol might be optimal for protein-ligand binding in general.
2 Materials and Methods
2.1 Molecular Models and Simulations
Initial coordinates were available for N1 bound to the ligand oseltamivir based on X-ray crystallography experiments (PDBID: 2HU0).17 For RmlC, initial coordinates for its complex with CID 77074, or 1-(3-(5-Allyl-5H-[1,2,4]triazino[5,6-b]indol-3-ylthio)propyl)-1H-benzo[d]imidazol-2(3H)-one, were based on the unbound X-ray structure (PDBID:2IXC) and an experimentally-verified computational docking pose.21 A monomer of the natively tetrameric protein N1 was simulated, as in previous studies,1 while the RmlC protein was simulated as a dimer, for half the N1 simulation time, because its active site spans the interface between two monomers (see Figure 1). Thus, RmlC analyses were performed by concatenating two monomer trajectories for identical overall sampling times for each system. See Table 1 for a summary of MD sampling periods.
Table 1.
Protocols for IT-TI calculations
| Reference Name | Elec / vdW No. λ |
Initialization | Non-Bonded | Decoupling | Runs × Time/λ (ns) |
Total Time (ns) |
|---|---|---|---|---|---|---|
| medium cont/simul/14λ a | 9 / 14 | continuous | simultaneous | inter + intra | 20 × 1 | 280 |
| long cont/simul/14λ | 9 / 14 | continuous | simultaneous | inter + intra | 10 × 2 | 280 |
| medium cont/simul/inter/14λ | 9 / 14 | continuous | simultaneous | inter only | 20 × 1 | 280 |
| medium cont/sep/14λ | 9 / 5 | continuous | separate | inter + intra | 20 × 1 | 280 |
| medium cont/sep/19λ b | 9 / 10 | continuous | separate | inter + intra | 20 × 1 | 380 |
| medium parall/simul/14λ | 9 / 14 | parallel* | simultaneous | inter + intra | 20 × 1 | 280 |
| medium parall/simul/19λ | 9 / 19 | parallel* | simultaneous | inter + intra | 20 × 1 | 380 |
| medium parall/simul/inter/14λ | 9 / 14 | parallel* | simultaneous | inter only | 20 × 1 | 280 |
| medium parall/sep/14λ | 9 / 5 | parallel* | separate | inter + intra | 20 × 1 | 280 |
| medium parall/sep/19λ | 9 / 10 | parallel* | separate | inter + intra | 20 × 1 | 380 |
| long parall/sep/19λ | 9 / 10 | parallel* | separate | inter + intra | 10 × 2 | 380 |
For N1, 14 λ =[0, 0.05, 0.1, 0.15, 0.2, 0.25, 0.3, 0,4, 0.5, 0.6, 0.7, 0.8, 0.9, 1]; for RmlC [0, 0.1, 0.2, 0.25, 0.3, 0.37, 0.45, 0.5, 0.65, 0.75, 0.8, 0.9, 0.97, 1].
For N1, 19 λ adds [0.55, 0.65, 0.75, 0.85, 0.95]; for RmlC [0.05, 0.15, 0.6, 0.7, 0.85].
Protocols are well-suited for distributed computing.
Molecular models were based on the AMBER FF99SB force field22 and the compatible TIP3P model for water.23 The cubic simulation box contained N1: 15,126 and RmlC: 24,305 water molecules, added to the system using AmberTools. Both systems were neutralized with (N1: 1 or RmlC: 24) Na+ counter-ions with AMBER rescaled parameters.24 The importance of a protein-bound Ca2+ ion in N1 ligand binding was recently highlighted.25 Ligands were parametrized using the Generalized Amber Force Field (GAFF)26 parameters for angles, bonds, and torsions, and RESP27 fitting of Gaussian0328 calculated electrostatic potentials at the Hartree-Fock/6-31G* level. All simulations were performed using the NAMD software29 (version 2.7b1). A 2 fs timestep was employed, with hydrogen-containing protein bonds constrained using RATTLE30 and water geometries constrained using SETTLE.31 The Particle Mesh Ewald (PME) approximation32 (1 Å−3 grid density) was employed for electrostatics. Short-range non-bonded interactions were evaluated every 2 fs and long-range electrostatics every 4 fs (non-bonded interaction cutoff: 12 Å; switching distance: 10 Å).29 After incremental heating to 300 K, the system was equilibrated for 2 ns in the N,p,T ensemble with Langevin pressure and temperature controls33 before each N,V,T independent simulation was initialized with a random velocity.
2.2 Free Energy Calculations
Free energy changes along the thermodynamic cycle in Scheme 1 were evaluated using thermodynamic integration (TI) as34
| (1) |
where in this study ΔF0→1 is either the or standard Helmoltz free energy in Scheme 1 and U is the total potential energy of the system. The ligand is decoupled from the surrounding environment with the coupling parameter λ that changes from 0 to 1 to linearly scale all ligand non-bonded potential energy terms as
| (2) |
where X denotes the overall system configurational space assuming equilibrium conditions. In all cases the soft-core potential by Zacharias et al. was employed to enhance sampling and eliminate instabilities (shift parameter δ = 5).35 The values of eq. 1 were printed for each λ every 0.1 ps and their forward cumulative average was monitored to evaluate convergence (generally reached within equilibration periods of 500 ps). Numerical integration of eq. 1 was performed using an interpolated cubic spline.
A harmonic restraining potential was applied to restrict ligand sampling rL to a finite volume Vpocket within the active site throughout the TI calculations of . Reasonable kh values were obtained from average fluctuations of the ligand position (⟨δr2⟩) during a free 2 ns N,p,T MD run as ,1,36 with R the molar gas constant and T the absolute temperature of 300 K. A kh of 2.9 kcal·mol−1Å−2 was used for restraint of the oseltamivir center of mass and kh=0.74 kcal·mol−1Å−2 for restraint of a central atom (highlighted in Figure 1f) in 77074.
Then, the standard state free energy was taken into account9,10,37 for through an analytical correction for transferral of the ligand from the restricted volume Vpocket to the bulk V° as
| (3) |
To reflect protein-ligand binding at a standard ligand concentration of 1 M, V° = 1661 Å3, with T = 300 K. Vpocket was explicitly determined from multiple MD trajectories using the VMD VolMap plugin.38 This procedure gave average corrections of −1.25 kcal·mol−1 for the N1 system and −1.07 kcal·mol−1 for the RmlC system. We note that the magnitude of such corrections is significant (up to 10% of the ΔFbind values for both systems) and should not be neglected.10,37 For each RmlC calculation, the was halved to obtain an average value for one active site.
One can obtain IT-TI estimates from all combinations of K independent estimates and J independent estimates as:
| (4) |
Here, a total of N = K · J estimates of are generated and binned in windows of width RT = 0.6 kcal·mol−1. The linear average of the N independent binding free energy estimates, , is reported throughout the article.
2.3 Alternative IT-TI protocols
Alternative approaches for IT-TI distributed computing were investigated by using more, medium independent simulations or fewer, long independent simulations. Effects of varied user-defined inputs for TI were also explored, as summarized in Table 1. For independent TI calculations, the λ intermediate simulations were either initialized continuously (cont protocols) or in parallel (parall protocols). In the first case, simulations at λ =0 started from the configuration (coordinates and velocities) from a 2 ns N,p,T equilibrated system; at each increasing λ value, the end configuration from the previous λ simulation was used. These IT-TI protocols are less-suited for distributed computing because the MD initialization requires information from sequential runs, but this approach does allow more equilibrated starting structures at successive λ values. Instead, for the parall protocols, all λ simulations were independently initialized from the same N,p,T equilibrated structure with a random velocity. This approach is well suited for distributed computing, because the MD initialization is independent among each λ simulation. Ligand electrostatics and van der Waals interactions were perturbed, as in eq. 2, in three alternative ways (see Table 1). First, electrostatic interactions were decoupled for 0 ≤ λ ≤ 0.5 and van der Waals more slowly for 0 ≤ λ ≤ 1 (simul protocol). Second, the same components were scaled separately, with electrostatic interactions for 0 ≤ λ ≤ 0.5, then van der Waals for 0.5 ≤ λ ≤ 1 (sep protocol). Third, only the inter-molecular terms were decoupled (inter protocol).
2.4 Error Analysis of IT-TI predictions
We evaluated the accuracy and precision of our IT-TI estimates. Accuracy is described by the match of with respect to a reference experimental value, here assumed to be characterized by zero uncertainty. Precision is reflected in the spread of the IT-TI estimates and is described by the standard deviation σbind. Here σbind has two components, σwater from the calculations and σprotein from the calculations. Accuracy is limited by systematic errors, which are due to, for example, empirical force field and water models, as well as numerical approximations in the MD algorithms. Both accuracy and precision is affected by random errors from finite sampling. We can capture the statistical uncertainty on the IT-TI due to random errors from N independent calculations with the standard error , as previously suggested.1 Note that this metric approaches zero for large N. We computed this uncertainty for the J estimates of and for K estimates of (eq. 4) and propagate for the uncertainty on as .
2.5 Analysis of Conformational Sampling
MD snapshots were saved every 2 ps for analysis, with all protein backbone atoms first aligned to a reference structure. Active site residues for both systems were identified as those within 5 Å of the ligand.
For each system, Principal Component Analysis (PCA)39,40 of protein fluctuations was performed by calculating the covariance matrix for active site heavy atoms with GROMACS (version 4.0.4 compiled in double precision),41 using all λ simulations in all J = 10 long cont/simul/14λ calculations, for 280 ns of total simulation time (Table 1). Then, projections for independent λ simulations were generated along 20 out of the total 528 principal components (PC) of this matrix, accounting for 75% of the protein fluctuations. Projections for trajectories using other IT-TI protocols for a given system are along these same PC for comparison, with projections along the four most dominant PC described in detail. We also project previously performed λ = 0 apo and holo MD simulations onto these PC for reference, with 400 ns and 10 ns each for apo and holo simulation with N1 and RmlC, respectively. Details of these N1 simulations have been previously reported.25 For a fair comparison of the two systems, all projections were re-weighted as w−1, w being the number of active site atoms (N1: 176; RmlC: 161). For hydration analysis, water-water hydrogen bonds within 5 Å of the ligand in the active site were monitored. Hydrogen bonds were defined to have a maximum hydrogen-acceptor distance of 3.5 Å and a minimum donor-hydrogen-acceptor angle of 120°. The software VMD,38 xmgrace, as well as python scripts based on matplotlib and NumPy libraries were used for analysis and graphical representations.
3 Results and Discussion
3.1 IT-TI Free Energy Distributions and Their Dependence on Biomolecular Flexibility
Because independent TI estimates of vary with the specific set of simulations performed, IT-TI generates distributions of free energy estimates and provides an average value with a reliable measure of uncertainty (δbind).1 We evaluate the accuracy of our predicted values with reference free energies derived from the experimental Ki as ΔFexp = RTln(Ki). For N1-oseltamivir and RmlC-77074 binding, ΔFexp values of −13.7 and −9.9 kcal·mol−1 were reported, respectively.21,42 We compute N IT-TI estimates of from K independent calculations of and J calculations of (eq. 4). The K = 20 results have a much smaller spread relative to the J = 20 results, with σwater = 0.4 and 0.2 kcal·mol−1 compared to σprotein = 4.4 and 3.2 kcal·mol−1 for the medium cont/simul/14λ N1-oseltamivir and RmlC-77074 calculations, respectively. Thus, the shape of the distributions is dominated by the variation of the J results, as expected due to the numerous degrees of freedom and complex energy landscape in this state.
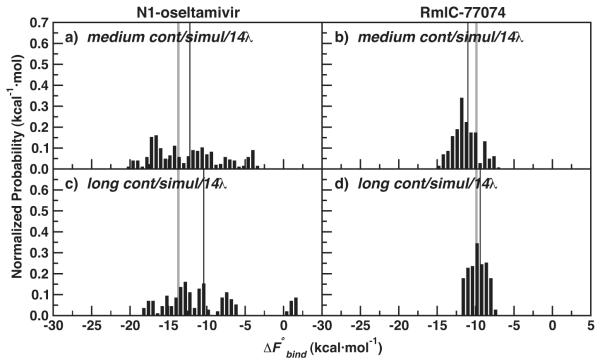
Both J = 20 medium and J = 10 long independent protein simulations were used to compute , to test the computational efficiency of more, shorter runs compared with fewer, longer independent runs. See Table 2 for a summary of all IT-TI predictions. Figure 2 shows distributions of estimates obtained using the cont/simul/14λ protocol in Table 1. The distributions are remarkably different for the two systems investigated. The N1-oseltamivir results in Figure 2a, c have a broad range, from very favorable (−20 kcal·mol−1) to unfavorable (> 0 kcal·mol−1). As reported in Table 2, estimates from medium runs give a of −12.2 ± 1.0 kcal·mol−1. Corresponding results for the long simulations display a marked shift of to 3.3 kcal·mol−1 away from ΔFexp and an increase of δbind, with . The use of more, independent simulations improved the free energy results in this case. In contrast, the RmlC-77074 distributions are centered near ΔFexp (see Figure 2b, d), and the use of fewer, independent runs with longer sampling times gave the most accurate and precise results. A close match with experiment is found for the long simulation results in Figure 2d, with (Table 2). Overall, the δbind of the RmlC-77074 results is significantly smaller than the δbind of the N1-oseltamivir results, due to a much smaller spread σbind.
Table 2.
Summary of IT-TI results with varied protocols
| Reference name | ||
|---|---|---|
| N1 | RmlC | |
| medium cont/simul/14λ | −12.2±1.0 | −11.0±0.4 |
| long cont/simul/14λ | −10.4±1.6 | −9.4±0.4 |
| medium cont/simul/inter/14λ | −14.9±1.2 | - |
| medium cont/sep/14λ | −10.4±1.2 | - |
| medium cont/sep/19λ | −13.7±1.1 | - |
| medium parall/simul/14λ | −10.6±0.6 | - |
| medium parall/simul/19λ | −11.2±0.6 | - |
| medium parall/simul/inter/14λ | −12.2±0.7 | - |
| medium parall/sep/14λ | −11.1±0.6 | - |
| medium parall/sep/19 λ | −14.3±0.5 | −11.8±0.3 |
| long parall/sep/19 λ | −12.8±0.6 | −10.8±0.2 |
Figure 2.
Normalized distributions of N1-oseltamivir (left) and RmlC-77074 (right) IT-TI results for medium and long cont/simul/14λ TI protocols (Table 1). ΔFexp for both systems is also depicted (grey line), along with (thin black line).
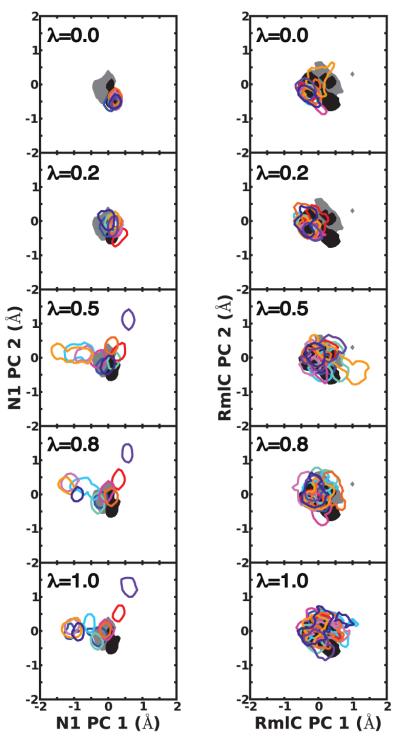
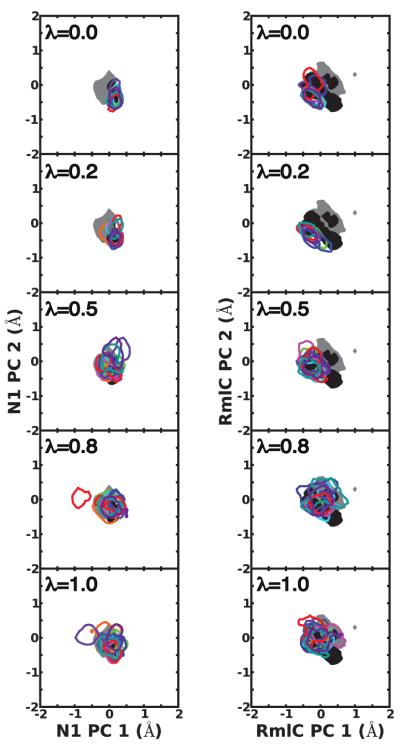
To probe underlying causes of the different free energy results for the two systems, we analyzed protein sampling during the independent simulations with Principal Component Analysis (PCA) of protein fluctuations. Figure 3 shows projections along the two most dominant principal components at 5 λ values, [0, 0.2, 0.5, 0.8, 1], depicting changes in protein sampling along the perturbation in eq. 2. For comparison, the same data for longer apo and holo N1 and RmlC simulations with λ = 0 (see Methods) onto the same PC are reported (Figure 3). For N1, the J simulations slowly equilibrated into varied portions of phase space, resulting in non-overlapping projections at λ = 1. Many of the simulations also exclusively sampled motions that are not visited in the reference holo or apo simulations. Our analysis indicates highly frustrated N1 sampling as the λ simulations are continuously initialized, contributing to varied free energy estimates and a large σprotein component of σbind. A different picture emerges for RmlC-77074, which had a significantly smaller σprotein compared to N1-oseltamivir. In this case, the J independent simulations accessed similar regions of conformational space, as inferred from overlapping projections (see Figure 3). The RmlC projections also significantly overlap with projections from apo and holo reference simulations. These observations hold similarly when analyzing projections along other, less dominant PC from PCA (not shown) and link the varied spreads of IT-TI free energy estimates, and corresponding uncertainties δbind, to protein conformational sampling.
Figure 3.
Receptor flexibility for N1 (left) and RmlC (right) as captured by 2 dominant principal components (PC) of active site residue fluctuations from long cont/simul14λ simulations. Contours depicting projections for 90% of the apo (filled grey) and holo (filled black) MD simulations, as well as each of J = 10 independent trajectories (unfilled color) are shown at λ values [0, 0.2, 0.5, 0.8, 1]. Projections are re-weighted to allow direct comparison between the two systems. See Methods section for details.
Differences in N1 and RmlC dynamics are also revealed in the sampling of specific binding site residue torsions. Comparison of torsion sampling at λ = 0 and at λ = 1 reveals that 9 out of 15 monitored N1 active site residues, but only 2 out of 11 RmlC residues, increased flexibility and sampled multiple conformations upon ligand decoupling. The torsional angles were also sampled in populations that vary among the J=10 independent runs, particularly for charged N1 residues R224, R371, R118, E277, and E119 (SI Figure S1). As seen in the PCA, the N1 system is challenged to access its conformational space within a single simulation, while for RmlC, sampling is more complete within and similar among independent IT-TI simulations. We note that, in addition to protein sampling and σprotein, σwater contributes to the varied σbind for the two systems; the more flexible ligand oseltamivir has more diverse sampling than the sterically hindered 77074, reflected in the larger σwater for this ligand (see above). Altogether, these sampling behaviors yield the different uncertainties δbind on estimates for the two systems (see Table 2).
3.2 IT-TI Free Energy Distributions and Their Dependence on Solvent Effects
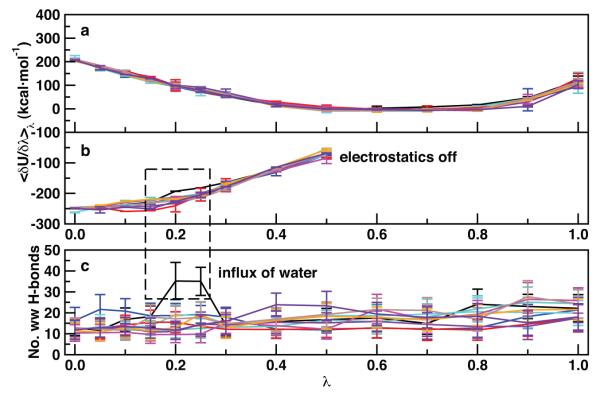
Hydration dynamics and solvent fluctuations also contribute to the spread of the IT-TI free energy distributions, in addition to protein and ligand flexibility described in the previous section. Here we report an example from the N1-oseltamivir IT-TI results in closer detail. In Figure 2c, an outlier, unfavorable estimate was computed (see histogram bars around ). This result can be linked to pronounced solvent fluctuations during the calculation at λ values 0.2 and 0.25. At these intermediate states, water molecules diffuse into the active site, very close to the partially-decoupled ligand carboxyl and ammonium groups, and an increased number of active site water-water hydrogen bonds is observed (Figure 4c). This coincides with a shift in the electrostatics component of (Figure 4b), giving a less positive integrated value and unfavorable estimates (eq. 4).
Figure 4.
N1 active site hydration behavior and corresponding values from the long cont/simul/14λ protocol. J = 10 independent estimates of are color-coded and interpolated for (a) van der Waals and (b) electrostatics components, with (c) the average and standard deviation of water-water hydrogen bonds within 5 Å of oseltamivir at each λ. The black curve in all panels indicates the TI calculation which gave an unfavorable result. See Methods section for details.
These observations are fully consistent with the dynamic nature of protein hydration and dewetting fluctuations in binding cavities recently reported in the literature43–45 and their thermodynamic relevance.46–48 Because timescales of these solvent fluctuations may reach several hundred picoseconds, it is expected that our individual nanosecond TI runs may have diverse solvent behavior among the ten performed. Here, the advantage of using IT-TI is illustrated, as a single TI calculation could yield a falsely unfavorable estimate for N1-oseltmivir. Multiple estimates of allow recovery of the probability distribution from multiple, independent simulations that sample both rare and dominant events. With enough independent estimates, this distribution should reflect that of the true physical system. We also note that the solvent-exposed N1 has a consistent number of water molecules in the active site throughout the TI calculations (Figure 4c), highlighting the importance of water in both the bound and unbound states. Instead, the RmlC binding site has a more abrupt influx of water near λ = 1 (SI Figure S2).
3.3 N1-oseltamivir Protocol Investigation
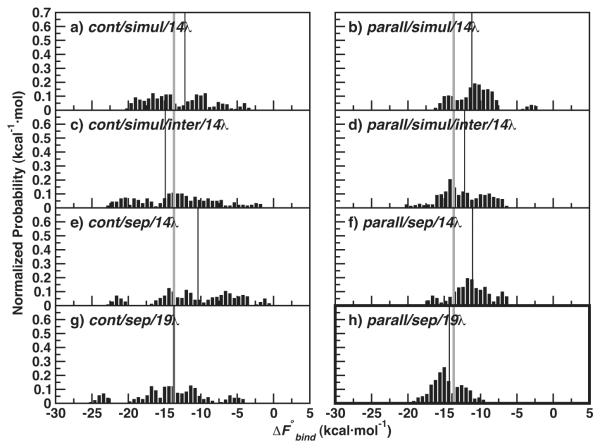
In effort to improve consistency of the N1-oseltamivir values in Figure 4 and the free energy estimates in Figure 2, we conducted a series of IT-TI protocol changes for the N1-oseltamivir system. The varied N1-oseltamivir medium protocols implemented for the IT-TI calculations are described in Table 1, with the corresponding listed in Table 2. Here, we aim for improved precision and accuracy over the medium cont/simul/14λ results (Figure 2a and Figure 5a). We compare the spread, σbind, of the IT-TI distributions in Figure 5, to the σbind = 4.4 kcal·mol−1 of the medium cont/simul/14λ results.
Figure 5.
Normalized distributions for N1-oseltamivir IT-TI results with various medium decoupling protocols. Panels are labeled with the procedures from Table 1, and ΔFexp is depicted (grey line), along with (thin black line). values are reported in Table 2.
All protocols with continuous initialization of λ intermediates gave free energy distributions with a large spread, with 4.4 ≤ σbind ≤ 5.4 kcal·mol−1 (see Figure 5a, c, e, and g). In these cases, the values were also consistently less favorable than ΔFexp, with the exception of protocol cont/sep/19λ in Figure 5g. In the latter case, estimates are shifted to more favorable values and matches the ΔFexp of −13.7 kcal·mol−1 with σbind = 4.8 kcal ·mol−1 (Table 2). PCA of these cont simulations (SI Figure S3) indicated frustrated sampling, with projections similar to those seen in Figure 3. Decoupling of only ligand inter-molecular non-bonded components in both protocols cont/simul/inter/14λ and parall/simul/inter/14λ reduced precision and made little difference in accuracy (Figure 5c, d and Table 2).
Overall, the σbind of the IT-TI distributions is significantly reduced with parallel initialization of each λ simulation. These estimates, in Figure 5b, d, f, and h, had σbind values ≤ 3.0 kcal·mol−1. However, only the protocol parall/sep/19λ gave an accurate , close to ΔFexp at −14.3 kcal·mol−1 with σbind = 2.1 kcal·mol−1 (Table 2). This improvement in accuracy is observed for both the parall and cont protocols with separate decoupling of non-bonded components and 19 λ values (compare Figure 5e, f with g, h). For protocols cont/sep/14λ and parall/sep/14λ, the van der Waals interactions are decoupled with only 5 λ intermediates, while the cont/simul/14λ and parall/simul/14λ protocols employed 14 λ (see Table 1). Five additional λ values for the cont/sep and parall/sep protocols, for 10 van der Waals λ intermediates and 19 total λ values, improved interpolation of the van der Waals values for more accurate integration. These results are highlighted in bold in Figure 5h and Table 2.
The diverse outcomes obtained using alternative IT-TI protocols show that free energy calculations depend on a broad variety of user-defined choices. An optimal protocol was designed for N1-oseltamivir binding and suggests that: i) TI intermediates can be more conveniently placed at target λ values once a preliminary knowledge of the vs. λ curve is known; ii) these λ values may be run in parallel, initialized from a λ = 0 holo configuration - an approach particularly suited for distributed computing; and iii) separate decoupling of both inter- and intra-molecular non-bonded components gives more accurate free energy estimates. We note that the approach described in (ii) may not be optimal for cases when the apo and holo states are separated by large conformational changes.
3.4 Application of Optimized Protocol to Both N1-Oseltamivir and RmlC-77074 Test Systems
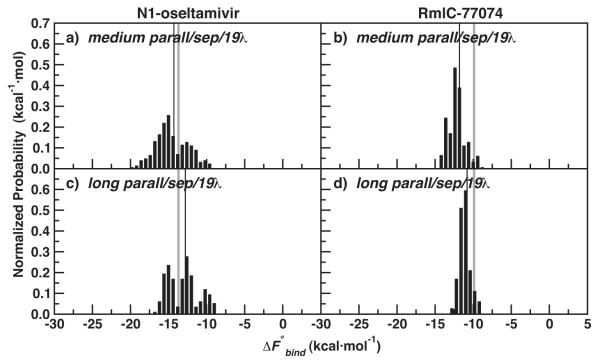
We applied our optimal IT-TI protocol for N1-oseltamivir binding to RmlC-77074, and, again, compared estimates from two approaches for distributed computing. For N1-oseltamivir, both approaches gave more accurate IT-TI results with reduced uncertainty compared to Figure 2. In Figure 6a, we see that more, medium simulations gave a more favorable estimate of −14.3 ± 0.5 kcal·mol−1, compared to computed with fewer, long simulations in Figure 6c. The additional simulations enhanced N1 sampling and improved the reliability of the IT-TI estimates (Table 2). For RmlC-77074, the results in Figure 6b, d reflect similar accuracy and precision compared to Figure 2, particularly for the long simulations. Here the (Table 2), with a very small δbind due to consistent sampling among the independent simulations.
Figure 6.
Normalized distributions of N1-oseltamivir (left) and RmlC-77074 (right) IT-TI results for medium and long parall/sep/19λ protocols (Table 2). ΔFexp for both systems is also depicted (grey line), along with (thin black line).
We can directly compare the 2-D projections of the long parall/sep/19λ simulations for both systems in Figure 7 with those in Figure 3. With the optimized protocol, the highly frustrated N1 sampling of Figure 3 is largely alleviated; the J = 10 projections overlap significantly with each other as well as with the reference apo and holo projections. One N1 simulation sampled outlier motions, but these exchanged with motions near the holo state during the same simulation (red contours in Figure 7 at λ = 0.8). The RmlC projections are similar to those in Figure 3, with consistent overlap among the independent runs and access of both apo and holo motions. In addition to more consistent protein sampling, both systems have reduced fluctuations of water-water hydrogen bonds in the active site when using the parall/sep protocol (SI Figure S2). This is primarily due to parallel initialization, rather than the separate decoupling protocol.
Figure 7.
Receptor flexibility for N1 (left) and RmlC (right) as captured by 2 dominant principal components (PC) of active site residue fluctuations from long parall/sep/19λ simulations. See Figure 3 for color coding.
4 Conclusion
We investigated the (thermo)dynamics underlying two protein-ligand binding processes that involve very different protein, ligand, and water sampling. The distributions of binding free energy estimates produced from Independent-Trajectory Thermodynamic Integration (IT-TI) were remarkably centered on the target experimental values, but had very different spreads for the two protein-ligand systems. The solvent exposed active site of N1, with many flexible, charged binding residues, has a larger population of microstates, with non-trivial barriers, that are easily over- or under-sampled during a single TI calculation. The frustrated sampling observed for this system resulted in a broad range of free energy estimates from IT-TI, and additional independent runs, rather than longer sampling times, gave more reliable results. The RmlC microstates are more accessible, even at short (ns) simulation times. Here, the IT-TI distributions had a smaller spread, and extension of simulation time improved the reliability of the results.
With tests of varied protocols for TI, we find that for both protein systems, each alchemical intermediate may be run in parallel, each initialized with a λ = 0 configuration, for more consistent free energy results with maintained accuracy. This parallel approach also allows faster completion of the calculations compared to calculations with continuously initialized intermediates and is ideal for distributed computing. Additionally, separate decoupling of the inter- and intra-molecular non-bonded terms gave optimal accuracy and precision overall, but only when employed with adequate intermediates for smooth interpolation of both electrostatics and van der Waals values during integration (eq. 1). We suggest an approach for performance of IT-TI calculations that maximizes reliability and computational efficiency with available sampling times.
Supplementary Material
Acknowledgement
The authors thank the members of the McCammon group for useful discussions. This work was supported, in part, by the National Institutes of Health, the National Science Foundation, the National Biomedical Computational Resource, and the Howard Hughes Medical Institute. We thank the Center for Theoretical Biological Physics (NSF Grant PHY-0822283), and the Texas Advanced Computer Center (grant TG-MCA93S013) for distributed computing resources. We also thank Dr. Ross C. Walker at the San Diego Supercomputing Center for additional computational resources.
Footnotes
Supporting Information Available Analysis of torsional angle sampling for N1 and RmlC active site residues, Figure S1; N1 and RmlC active site hydration behavior for varied IT-TI protocols, Figure S2; PCA of N1 active site residue fluctuations from varied IT-TI protocols, Figure S3. This material is available free of charge via the Internet at http://pubs.acs.org.
References
- (1).Lawrenz M, Baron R, McCammon J. J. Chem. Theory Comput. 2009;5:1106–1116. doi: 10.1021/ct800559d. [DOI] [PMC free article] [PubMed] [Google Scholar]
- (2).Tembe B, McCammon J. Comput. Chem. 1984;8:281–283. [Google Scholar]
- (3).Beveridge D, DiCapua F. Annu. Rev. Biophys. Chem. 1989;18:431–492. doi: 10.1146/annurev.bb.18.060189.002243. [DOI] [PubMed] [Google Scholar]
- (4).Kollman P. Chem. Rev. 1993:2395–2417. [Google Scholar]
- (5).Jorgensen W. Science. 2004;303:1813–1818. doi: 10.1126/science.1096361. [DOI] [PubMed] [Google Scholar]
- (6).Pohorille A, Jarzynski C, Chipot C. J. Phys. Chem. 2010:10235–10253. doi: 10.1021/jp102971x. [DOI] [PubMed] [Google Scholar]
- (7).Gilson MK, Zhou H-X. Annu. Rev. Biophys. Biomol. Struct. 2007;36:21–42. doi: 10.1146/annurev.biophys.36.040306.132550. [DOI] [PubMed] [Google Scholar]
- (8).van Gunsteren WF, Beutler TC, Fraternali F, King PM, Mark AE, Smith PE. Computation of Free Energy in Practice: Choice of Approximations and Accuracy Limiting Factors. Vol. 2. ESCOM Science Publishers; Leiden: 1993. [Google Scholar]
- (9).Gilson MK, Given JA, Bush BL, McCammon JA. Biophys. J. 1997;72:1047–1069. doi: 10.1016/S0006-3495(97)78756-3. [DOI] [PMC free article] [PubMed] [Google Scholar]
- (10).Boresch S, Tettinger F, Leitgeb M, Karplus M. J. Phys. Chem. B. 2003;107:9535–9551. [Google Scholar]
- (11).Fujitani H, Tanida Y, Ito M, Jayachandran G, Snow CD, Shirts MR, Sorin EJ, Pande VS. J. Chem. Phys. 2005;123:084108. doi: 10.1063/1.1999637. [DOI] [PubMed] [Google Scholar]
- (12).Zagrovic B, van Gunsteren W. J. Chem. Theory Comput. 2007;3:301–311. doi: 10.1021/ct600322d. [DOI] [PubMed] [Google Scholar]
- (13).Mobley DL, Graves AP, Chodera JD, McReynolds AC, Shoichet BK, Dill KA. J. Mol. Biol. 2007;371:1118–34. doi: 10.1016/j.jmb.2007.06.002. [DOI] [PMC free article] [PubMed] [Google Scholar]
- (14).Boyce SE, Mobley DL, Rocklin GJ, Graves AP, Dill KA, Shoichet BK. J. Mol. Biol. 2009;394:747–763. doi: 10.1016/j.jmb.2009.09.049. [DOI] [PMC free article] [PubMed] [Google Scholar]
- (15).Jorgensen WL, Ravimohan C. J. Chem. Phys. 1985;83:3050–3054. [Google Scholar]
- (16).Wong C, McCammon J. J. Am. Chem. Soc. 1986;108:3830–3832. [Google Scholar]
- (17).Russell RJ, Haire LF, Stevens DJ, Collins PJ, Lin YP, Blackburn GM, Hay AJ, Gamblin SJ, Skehel JJ. Nature. 2006;443:45–49. doi: 10.1038/nature05114. [DOI] [PubMed] [Google Scholar]
- (18).Amaro RE, Minh DDL, Cheng LS, Lindstrom WM, Olson AJ, Lin J-H, Li WW, McCammon JA. J. Am. Chem. Soc. 2007;129:7764–7765. doi: 10.1021/ja0723535. [DOI] [PubMed] [Google Scholar]
- (19).Le L, Lee EH, Hardy DJ, Truong TN, Schulten K. PLoS Comput. Biol. 2010;6:e1000939. doi: 10.1371/journal.pcbi.1000939. [DOI] [PMC free article] [PubMed] [Google Scholar]
- (20).Stoll V, Kent SD, Maring CJ, Muchmore S, Giranda V, Gu YY, Wang G, Chen Y, Sun M, Zhao C, Kennedy AL, Madigan DL, Xu Y, Saldivar A, Kati W, Laver G, Sowin T, Sham HL, Greer J, Kempf D. Biochemistry. 2003;42:718–727. doi: 10.1021/bi0205449. [DOI] [PubMed] [Google Scholar]
- (21).Sivendran S, Jones V, Sun D, Wang Y, Grzegorzewicz AE, Scherman MS, Napper AD, McCammon JA, Lee RE, Diamond SL, McNeil M. Bioorg. Med. Chem. 2010;18:896–908. doi: 10.1016/j.bmc.2009.11.033. [DOI] [PMC free article] [PubMed] [Google Scholar]
- (22).Hornak V, Abel R, Okur A, Strockbine B, Roitberg A, Simmerling C. Proteins. 2006;65:712–725. doi: 10.1002/prot.21123. [DOI] [PMC free article] [PubMed] [Google Scholar]
- (23).Jorgensen WL, Chandrasekhar J, Madura JD, Impey RW, Klein ML. J. Chem. Phys. 1983;79:926–935. [Google Scholar]
- (24).Åqvist J. J. Phys. Chem. 1990;94:8021–8024. [Google Scholar]
- (25).Lawrenz M, Wereszczynski J, Amaro R, Walker R, Roitberg A, McCammon JA. Proteins: Struct., Funct., Bioinf. 2010;78:2523–2532. doi: 10.1002/prot.22761. [DOI] [PMC free article] [PubMed] [Google Scholar]
- (26).Wang J, Wolf RM, Caldwell JW, Case PAKDA. J. Comput. Chem. 2004;25:1157–1174. doi: 10.1002/jcc.20035. [DOI] [PubMed] [Google Scholar]
- (27).Cornell WD, Cieplak P, Bayly CI, Gould IR, Merz KM, Ferguson DM, Spellmeyer DC, Fox T, Caldwell JW, Kollman PA. J. Am. Chem. Soc. 1995;117:5179–5197. [Google Scholar]
- (28).Frisch M, Trucks G, Schlegel H, Scuseria G, Robb M, Cheeseman J, Montgomery J, Vreven T, Kudin K, Burant J, Millam J, Iyengar S, Tomasi J, Barone V, Mennucci B, Cossi M, Scalmani G, Rega N, Petersson G, Nakatsuji H, Hada M, Ehara M, Toyota K, Fukuda R, Hasegawa J, Ishida M, Nakajima T, Honda Y, Kitao O, Nakai H, Klene M, Li X, Knox J, Hratchian H, Cross J, Bakken V, Adamo C, Jaramillo J, Gomperts R, Stratmann R, Yazyev O, Austin A, Cammi R, Pomelli C, Ochterski J, Ayala P, Morokuma K, Voth G, Salvador P, Dannenberg J, Zakrzewski V, Dapprich S, Daniels A, Strain M, Farkas O, Malick D, Rabuck A, Raghavachari K, Foresman J, Ortiz J, Cui Q, Baboul A, Clifford S, Cioslowski J, Stefanov B, Liu G, Liashenko A, Piskorz P, Komaromi I, Martin R, Fox D, Keith T, Laham A, Peng C, Nanayakkara A, Challacombe M, Gill P, Johnson B, Chen W, Wong M, Gonzalez C, Pople J. Gaussian 03. Revision C.02. Gaussian, Inc.; Wallingford, CT: 2004. 2003. [Google Scholar]
- (29).Phillips JC, Braun R, Wang W, Gumbart J, Tajkhorshid E, Villa E, Chipot C, Skeel RD, Kalé L, Schulten K. J. Comput. Chem. 2005;26:1781–1802. doi: 10.1002/jcc.20289. [DOI] [PMC free article] [PubMed] [Google Scholar]
- (30).Andersen H. J. Comput. Phys. 1983;52:24–34. [Google Scholar]
- (31).Shuichi M, Peter A. J. Comp. Chem. 1992;13:952–962. 148324. [Google Scholar]
- (32).Darden T, York D, Pedersen L. J. Chem. Phys. 1993;98:10089–10092. [Google Scholar]
- (33).Feller S, Zhang Y, Pastor R, Brooks B. J. Chem. Phys. 1995;103:4613–4621. [Google Scholar]
- (34).Kirkwood J. J. Chem. Phys. 1935:300–313. [Google Scholar]
- (35).Zacharias M, Straatsma TP, McCammon JA. J. Chem. Phys. 1994;100:9025–9031. [Google Scholar]
- (36).Hamelberg D, McCammon JA. J. Am. Chem. Soc. 2004;126:7683–7689. doi: 10.1021/ja0377908. [DOI] [PubMed] [Google Scholar]
- (37).General IJ. J. Chem. Theory Comput. 2010;6:2520–2524. doi: 10.1021/ct100255z. [DOI] [PubMed] [Google Scholar]
- (38).Humphrey W, Dalke A, Schulten K. J. Mol. Graph. 1996;14:33–38. 27–28. doi: 10.1016/0263-7855(96)00018-5. [DOI] [PubMed] [Google Scholar]
- (39).García AE. Phys. Rev. Lett. 1992;68:2696–2699. doi: 10.1103/PhysRevLett.68.2696. [DOI] [PubMed] [Google Scholar]
- (40).Amadei A, Linssen ABM, Berendsen HJC. Proteins: Struct., Funct., Bioinf. 1993;17:412–425. doi: 10.1002/prot.340170408. [DOI] [PubMed] [Google Scholar]
- (41).Hess B, Kutzner C, van der Spoel D, Lindahl E. J. Chem. Theory Comput. 2008;4:435–447. doi: 10.1021/ct700301q. [DOI] [PubMed] [Google Scholar]
- (42).Kati WM, Montgomery D, Carrick R, Gubareva L, Maring C, McDaniel K, Steffy K, Molla A, Hayden F, Kempf D, Kohlbrenner W. Antimicrob. Agents Chemother. 2002;46:1014–1021. doi: 10.1128/AAC.46.4.1014-1021.2002. [DOI] [PMC free article] [PubMed] [Google Scholar]
- (43).Setny P, Geller M. J. Chem. Phys. 2006;125:144717. doi: 10.1063/1.2355487. [DOI] [PubMed] [Google Scholar]
- (44).Baron R, McCammon J. Biochemistry. 2007;46:10629–10642. doi: 10.1021/bi700866x. [DOI] [PubMed] [Google Scholar]
- (45).Young T, Hua L, Huang X, Abel R, Friesner R, Berne BJ. Proteins. 2010;78:1856–1869. doi: 10.1002/prot.22699. [DOI] [PMC free article] [PubMed] [Google Scholar]
- (46).Baron R, Setny P, McCammon JA. J. Am. Chem. Soc. 2010;132:12091–12097. doi: 10.1021/ja1050082. [DOI] [PMC free article] [PubMed] [Google Scholar]
- (47).Setny P, Baron R, McCammon JA. J. Chem. Theory Comput. 2010;6:2866–2871. doi: 10.1021/ct1003077. [DOI] [PMC free article] [PubMed] [Google Scholar]
- (48).Hummer G. Nature Chem. 2010;2:906–907. doi: 10.1038/nchem.885. [DOI] [PMC free article] [PubMed] [Google Scholar]
Associated Data
This section collects any data citations, data availability statements, or supplementary materials included in this article.


