Abstract
DNA microarray gene expression and microarray based comparative genomic hybridization (aCGH) have been widely used for biomedical discovery. Because of the large number of genes and the complex nature of biological networks, various analysis methods have been proposed. One such method is "gene shaving," a procedure which identifies subsets of the genes with coherent expression patterns and large variation across samples. Since combining genomic information from multiple sources can improve classification and prediction of diseases, in this paper we proposed a new method, "ICA gene shaving" (ICA, independent component analysis), for jointly analyzing gene expression and copy number data. First we used ICA to analyze joint measurements, gene expression and copy number, of a biological system and project the data onto statistically independent biological processes. Next we used these results to identify patterns of variation in the data and then applied an iterative shaving method. We investigated the properties of our proposed method by analyzing both simulated and real data. We demonstrated that the robustness of our method to noise using simulated data. Using breast cancer data, we showed that our method is superior to the Generalized Singular Value Decomposition (GSVD) gene shaving method for identifying genes associated with breast cancer.
Keywords: Clustering Technique, Comparative Genomic Hybridization (CGH), Copy Number Variation (CNV), Generalized Singular Value Decomposition (GSVD), Gene Expression, Gene Shaving, Independent Component Analysis (ICA)
1. Introduction
The human genome is estimated to have about 20,000 to 25,000 protein-coding genes [1]. A variety of techniques for the analysis of gene expression data have evolved to exploit the huge amount of information obtained with oligonucleotide arrays [2] and complementary deoxyribonucleic acid (cDNA) microarrays [3,4]. DNA microarray technology has been proven to be an effective approach for identifying genes which are potential therapeutic molecular targets [5]. This technique lacks the power for detecting regional variations of the genome. On the other hand, array comparative genomic hybridization (aCGH) allows assessment of changes in chromosomal DNA sequence copy numbers across the genome and provides valuable information regarding genetic alternations in diseases such as cancers [6, 7]. The aCGH technology is an invaluable tool in oncology, which uses microarrays to perform high resolution and genome-wide screening of DNA copy number changes. Several important applications of aCGH have been reported in cancer research [8], and clinical genetics [9].
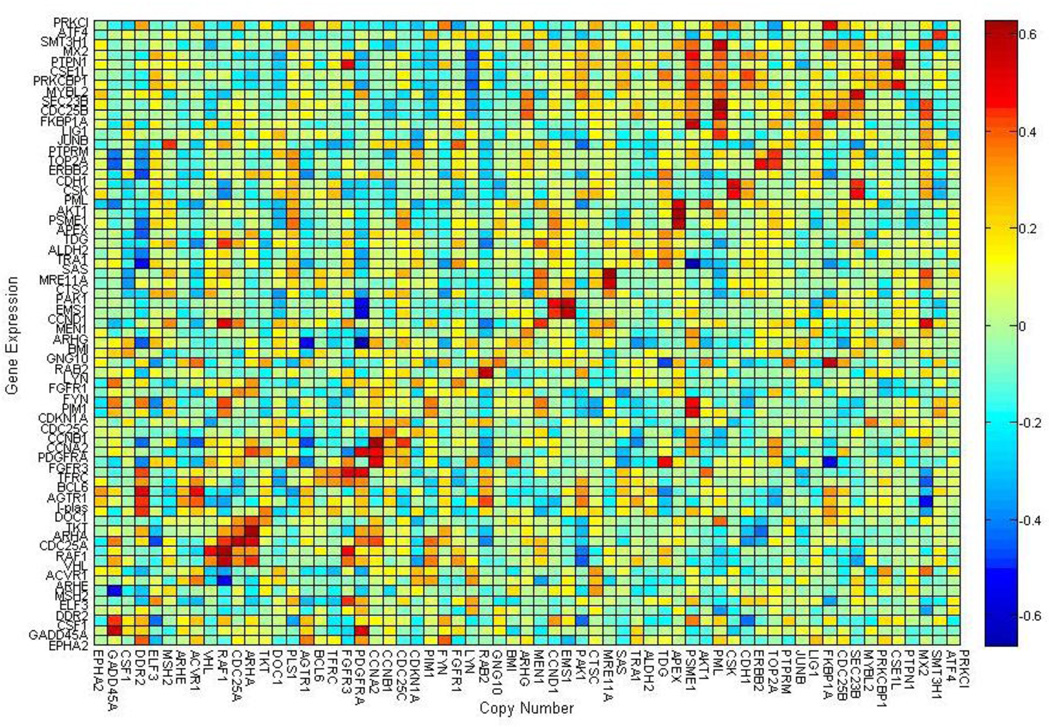
With the vast increase in biological information, the problem of integrating different types of genomic measurements has become a great challenge. The integration of chromosomal copy number variation (CNV) with gene expression will probably identify new therapeutic targets that could not be identified by analysis of independent platforms alone [10]. Recent investigations [11–14] have shown the promise of integrated analysis of CNV and gene expression. Most studies demonstrate that copy number variation affects the expression levels of those genes contained within that CNV. Copy number variations are both directly and indirectly correlated with changes in expression and it is beneficial to examine the indirect effects of CNVs [11]. Optimal power to find such associations can only be achieved if analyzing copy number and gene expression jointly [12]. By combining genomic data from different sources, it is possible to obtain an integrated genome-wide view of gene aberration and their effects on gene expression [13, 14]. Gene over or under-expressions usually correspond to increased or decreased copy numbers, respectively (e.g., see Fig. 1). An integrated analysis of gene expression data with copy number data can reveal their intrinsic connections.
Figure 1.
Display of the Pearson’s correlation analysis between copy number and gene expression level across the NCI-60 cell lines. This indicates correlations existed along the diagonal line where the copy number variations cause the corresponding gene expression changes.
Combined analysis of copy number and gene expression microarrays of the same or similar tumor samples has revealed a major and direct effect of allelic imbalance on gene expression in a variety of cancer types, including breast [15,16], pancreatic [17], colorectal [18], prostate [19], and lung [20] cancer. On a global level, 40–60% of the genes at higher level of amplification showed elevated expression, while 10% of highly over-expressed genes were amplified. In low-level copy number aberrations, only about 10% of the genes have been reported to show coherent changes in gene expression [21]. Fig. 1, displays the Pearson correlation coefficients for all possible combinations of gene expression and copy number changes from the NCI-60 cell lines [22], indicating that a correlation exists between the expression levels of genes and copy number changes around the same locations of the genome (along the diagonal line). Variations in gene expression and gene copy number are strongly linked to diseases such as breast cancer and have a bit positive over negative correlations [23]. Genes in tumorigenesis show associations between copy numbers and expression levels. Some copy number changes extend over larger chromosomal regions.
Integrating data from different sources such as gene expression and copy number can increase the reliability of the analysis results and the prediction of prognosis. Association between copy number changes and gene expression levels have been studied in [16, 21, 22], and ~ 12% of gene expression variation can be explained by differences in copy numbers [19]. Integration of DNA copy number alterations and gene expression profiling may also result in improved classification and prognosis in breast cancer. For example, Chin et al. [24] found that the accuracy of risk stratification according to the outcome of breast cancer disease can be improved by joint analyses of gene expression and DNA copy number. Several approaches have been described to identify a subset of genes, whose expression levels are most significantly associated with copy number changes in the corresponding genomic region [25]. The singular value decomposition (SVD) or the principal component analysis (PCA) has been a popular method for analyzing and reducing the dimension of gene data [26, 27]. The SVD model describes the overall observed genome-scale molecular biological data as the outcome of a simple linear network. However, the gene expression and copy number data are separately analyzed using the SVD method. The generalized singular value decomposition (GSVD) model describes the two genome-scale molecular biological datasets as the outcome of a simple linear comparative network, where a few independent sources, some common to both datasets whereas some are exclusive to one dataset or the other, affect all the genes in both datasets. In 2006, Berger et al. [28] applied an iterative shaving method based on the GSVD of their joint data sets to identify subsets of genes with similar gene expression or copy number patterns. The SVD and GSVD models are usually used to model DNA microarray data. The GSVD is already a trusted method for analyzing and reducing the dimension of gene data in two breast cancer cell line and tumor datasets for the identification of gene subsets that are biologically validated. The independent component analysis (ICA) and PCA are very similar in some respects; however, the goals of the two methods are different. The ICA finds the statistically independent components and is more suitable for separating mixed signals and uncovering hidden biological processes from the observed measurements.
The GSVD based approach assumes that gene expression or gene copy number data is generated by the linear combination of a set of biological processes. However, this assumption might not be realistic. The ICA uses a more general statistical assumption (as described in Sec. 2.2), which is more appropriate for modeling and analysis of genomic data. ICA has been recently successfully used for the joint analysis of fMRI, EEG and genomic imaging data [29, 30]. Motivated by these facts, we used the ICA technique to jointly analyze gene expression and copy number data and the preliminary results were encouraging [31]. In this paper, we present our recent results on the development of an ICA based iterative dimension reduction method and apply it to analyze both gene expression and copy number data in order to identify subsets of genes with coherent expression patterns and large variation across subjects. We examine the robustness of the method to noise and its convergence properties using simulated data. We apply the method to breast cancer cell line and breast cancer tumor studies and demonstrate the effectiveness of the method. With our proposed algorithm, we can identify a list of variant genes and select genes that correspond to functionally related groups. When compared with the GSVD based method, improved performance is obtained in identifying genes that are known to contribute to the progression of breast cancers.
2. Method
We introduce our ICA based method for the integrated analysis of gene expression and copy number change data and then apply it to the identification of gene subsets in the breast cancer cell and breast tumor data in combination with a gene shaving method.
2.1 Gene shaving
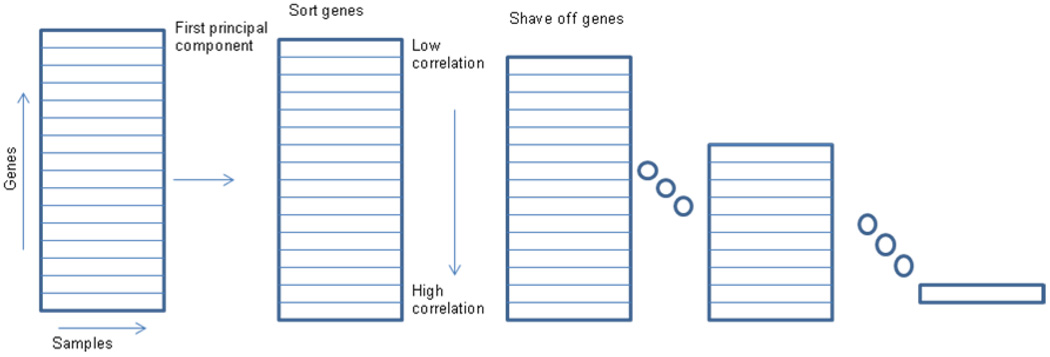
Large scale gene expression studies, such as those conducted using cDNA arrays, often provide millions of data points. A PCA based statistical method called 'gene shaving' was introduced in [27] to identify groups of genes that have coherent patterns of expression with large variance across samples, or groups of genes that optimally separate the sample into predefined classes. Gene shaving differs from hierarchical clustering and other widely used methods for analyzing gene expression studies in that genes may belong to more than one clusters, and the clustering may be supervised by an outcome measure. Fig. 2 shows a schematic procedure of the gene shaving process based on the PCA. The goal of gene shaving is to extract coherent and typically small clusters of genes that vary as much as possible across the samples. The first principal component of the current cluster of genes is computed. This eigen-gene is the linear combination of genes with largest the variance across samples. We compute the correlation of each gene with the eigen-gene, and shave off the genes having lowest correlation. The process is then repeated on the reduced cluster of genes.
Figure 2.
The procedure of the “gene shaving” method for isolating interesting genes from a set of DNA microarray experiments as used in [27].
The shaving process shown here requires repeated computation of the largest component of a large set of variables and retains the typically 90–95% of genes with the highest variance at each iteration until all clusters (such as the top 5–10% highest variant genes) are found. The gene shaving method is a potentially useful tool for the exploration of gene expression data and for identification of interesting clusters of genes whose expressions are highly predictive of certain cancers and patient survival.
2.2 ICA approach
Independent component analysis (ICA) is a recently developed method in which the goal is to find a linear representation of unknown non-Gaussian data so that the components are statistically independent, or as independent as possible. Such a representation seems to capture the essential structure of the data in many applications, including feature extraction and signal separation. The ICA is becoming an increasingly popular tool for analyzing biomedical data. Liebermeister [32] proposed using the linear ICA for microarray analysis to extract expression modes, where each mode represents the linear influence of a hidden cellular variable. However, to our knowledge, no results have been reported to use ICA for the combined analysis of gene expression and copy number datasets.
Consider an observed m-dimensional random vector denoted by X = (x1,…,xm)T, which is generated by the source signals S with an unknown process [33]:
| (1) |
where S = (s1, …,sn)T is an n-dimensional vector, and is not observable; Amxn is an unknown mixing matrix; and Nt is Gaussian noise. Typically m >= n, so A is usually of full rank. A typical ICA model assumes that the elements in the source signal S are statistically independent, and are mostly non-Gaussian, with an unknown but linear mixing process.
The goal of ICA model is to estimate a separation matrix Wnxm such that Y is a good approximation to the true sources S.
| (2) |
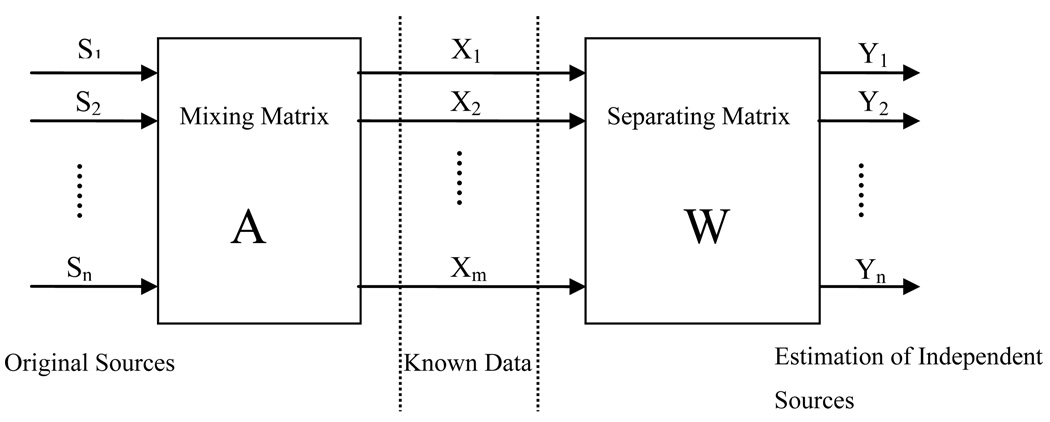
The separation matrix W is the approximate inverse of the mixing matrix A and can be estimated from the observed data to ensure independent coefficients S, with non-Gaussian distributions. Therefore, ICA is an approach for solving the blind source separation (BSS) problem. This approach has been used to solve the cocktail party problem, where several people are speaking simultaneously in the same room. The problem is to separate the voices of different speakers from their mixed voices recorded by a few microphones in the room. The ICA model for blind source separation (BSS) is shown in Fig. 3.
Figure 3.
A basic ICA model for blind source separation.
Some classical approaches to solving BSS problem include the maximization of information transformation, maximization of non-Gaussianity, mutual information minimization, and tensorial methods. Some of the most commonly used ICA algorithms are the FastICA [34], Infomax [35] and joint approximate diagonalization of eigen-matrices (JADE) [36]. In this paper, the FastICA algorithm was utilized, which has been proven to be effective for our data. It performs centering and whitening as a preprocessing step.
We now apply the ICA model to our gene expression or gene copy number change data and Eq. 1 can be generalized as:
| (3) |
where the input matrix Rmxp contains gene expression or gene copy number data; Unxp is an n×p matrix containing all unknown source signals; p is the number of genes and m is the number of experiments.
We project each input set onto the kth column of A corresponding to the direction of the highest variance to find the highest parallel contribution from data R
| (4) |
where ak is a m×1 vector, i.e., the kth column of A, and T denotes matrix transposition.
The projection direction, the kth column of A can be sought, corresponding to the maximum value of the sum of the kth row of matrix AT˙A.
2.3 Joint ICA
The common technique used to analyze the input data is to project the original data on a lower-dimensional subspace expanded by orthogonal components of the decomposition and find clusters that are tight and far away from other clusters. Instead of the orthogonal ones, here we get a subspace spanned by statistically independent components based on the ICA We apply the ICA model to uncover the complex biological process that lead to two different measurements, e. g., gene expression and gene copy number variations. Based on the ICA analysis of these two joint datasets, we accomplish the goal of “gene shaving”. An iterative dimension reduction method based on ICA is proposed to analyze both gene expression and copy number data in order to locate functionally related gene subsets.
Joint ICA [29, 30] is an approach that enables us to jointly analyze data from multiple modalities collected in the same set of subjects. The gene expression and copy number data can be better analyzed in a unified framework in which the two set of data are fused. We assume the independence of gene expression and copy number data respectively, using the following generative models for the data:
| (5) |
where: RA and RB represent the matrix of gene expression and copy number changes, respectively; UA and UB represent their source signals, and AA and AB are their mixing matrices. Our idea is motivated by the algorithm for fusion of fMRI and ERP data proposed by Calhoun et al. [29, 30], but applied to gene expression and copy number separately. When the ICA is applied to the union of gene expression and copy number, it is similar to the algorithm by Calhoun et al. [30].
Because aberrations in gene expression and gene copy number are correlated, the elements of the mixing matrices should be correlated. The idea of creating snapshots of the ERP and fMRI data can be translated into fusing the mixing matrices of gene expression and copy number in our case. Both mixing matrixes can be interacted to find the direction of the highest variance on both data sets. The joint contribution from RA and RB can be computed as:
| (6) |
We compute top the 5% percent of genes with the highest parallel contribution from RA and RB corresponding to the highest variances. We project the original data in the kth direction as:
| (7) |
where mAk and mBk are the kth column of MA and MB, corresponding to the direction of the largest variance from the matrix pair RA and RB, respectively.
2.4 Joint ICA based Gene shaving algorithm
The genes are iteratively projected onto the vector corresponding to the independent component with highest variance. The projection corresponds to the direction of highest variation in the original data. The joint ICA method can be extended to accomplish the goal of “shaving” based on the chosen direction. We proposed the following algorithm and its two variants for clustering genes where the genes may be of different significance in both data sets. 90–95% of the genes are retained from data sets with joint ICA in the direction of the highest variance, from which the corresponding genes that contribute to cancer progression are identified.
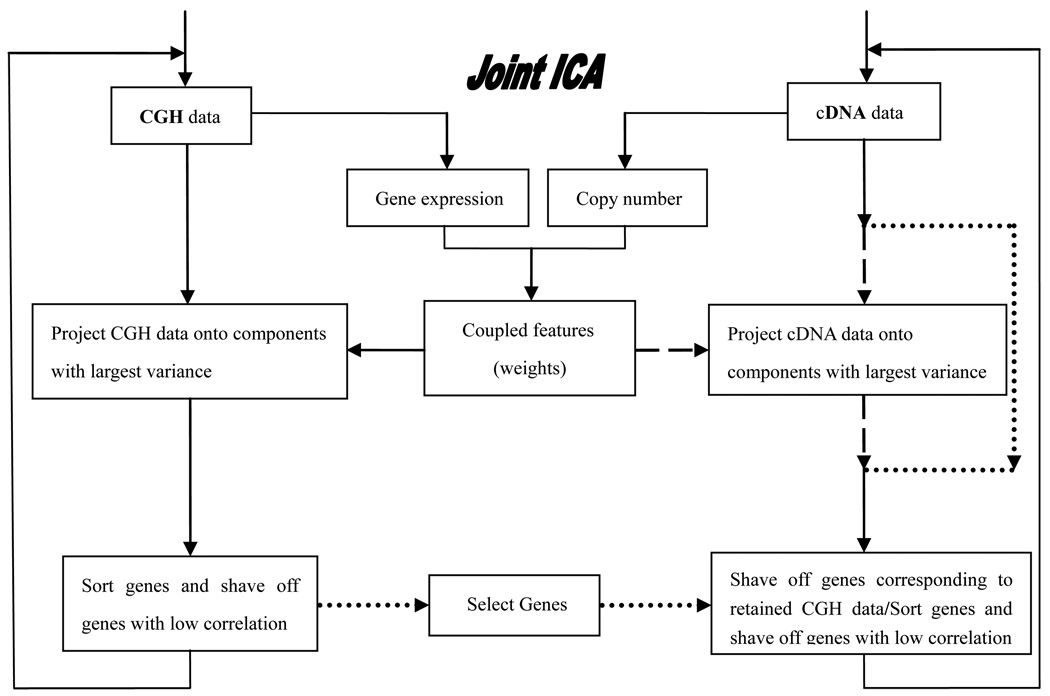
Algorithm 1. Gene shaving based on the selection of genes from the aCGH data. The schematic procedure of this algorithm is shown in Fig. 4, where each individual procedure is connected with solid lines.
Figure 4.
The schematic procedure of joint ICA gene shaving to identify gene subsets.
Given the matrix RA of aCGH and the matrix RB of gene expression for the same organisms or the same clones of the same samples, we perform the following steps:
Preprocess microarray data; quality filtering, normalization, and data transformation.
Form the matrix .
Compute the mixing matrix MA using the FastICA algorithm, analyze and select the direction of projection.
Project R onto the independent component according to the chosen direction, which corresponds to largest variance.
Retain the top η = 95% of genes with the highest contribution from RA and select the related genes from RB corresponding to retained aCGH data.
Reform the matrix R after shaving.
Repeat Steps 3–6 if the number of genes is greater than or equal to the set number of samples.
Analyze the clusters with the top 5 percent highest variant genes through visualization and functional assessment.
There are two variants of Algorithm 1, depending on the selection of genes in terms of aCGH and/or cDNA data.
Algorithm 2. Joint ICA gene shaving based on the selection of genes from cDNA data. Algorithm 2 is similar to algorithm 1, but genes are selected in terms of cDNA data. The schematic procedure of this algorithm is shown in Fig. 4, in which each individual procedure is connected through solid and dotted lines.
Algorithm 3. Joint ICA gene shaving based on the selection of genes from both the matrix RA of aCGH and the matrix RB of cDNA. The genes with the lowest correlation from RA or RB are all shaved off. The schematic procedure of this algorithm is shown in Fig. 4, in which each individual procedure is connected through solid and dashed lines.
These algorithms are appropriate for different data sets, which is similar to the GSVD method when using different project angle parameters [28]. Algorithm 1 depends more on copy number data; Algorithm 2 depends more on gene expression; and Algorithm 3 depends on both of them. We apply these iterative procedures in the following section to locate functionally related gene subsets, corresponding to similar and dissimilar patterns of variations in gene expression and/or gene copy number changes.
3. Results and Discussion
We applied the ICA gene shaving method for dimension reduction and clustering analysis of combined aCGH and cDNA expression data. In order to test the robustness of the method to noise, we generated simulation data as described in Berger et al. [28] and compared ICA gene shaving and GSVD gene shaving when the data contain noise. Our proposed algorithms were applied to demonstrate efficacy to real data from breast cancer cell lines and a breast cancer tumors, which were preprocessed by normalization and log2-transformation. The algorithms were implemented in Matlab and the codes and data are available for download on the website [37].
3.1 Test on Simulation Data
Copy number data were generated using the model proposed by Wang et al [38], which defined three states: amplified (a), deleted (d) and normal (z). Gene expression data were generated based on the model of Attoor et al [39]. Gene expression was defined as: over (o), under (u) and constant (c) expression state. The relation between copy number and gene expression states was modeled using a simple state flow. The connection between the data was modeled by the transition probability matrix [22]:
| (8) |
In our simulations, we assumed a strictly correlative model between copy number and gene expression states using the transition probability matrix, P=I3×3.
By increasing the noise variance, different groups of genes were observed after the shaving iterations were completed. In order to evaluate the robustness of the method to noise, the gene list percentage similarity (PS) was computed by counting the number of genes obtained from noisy data (ND) intersecting with that obtained from the original data (OD) [28].
| (9) |
where Tot is the number of total genes in the list.
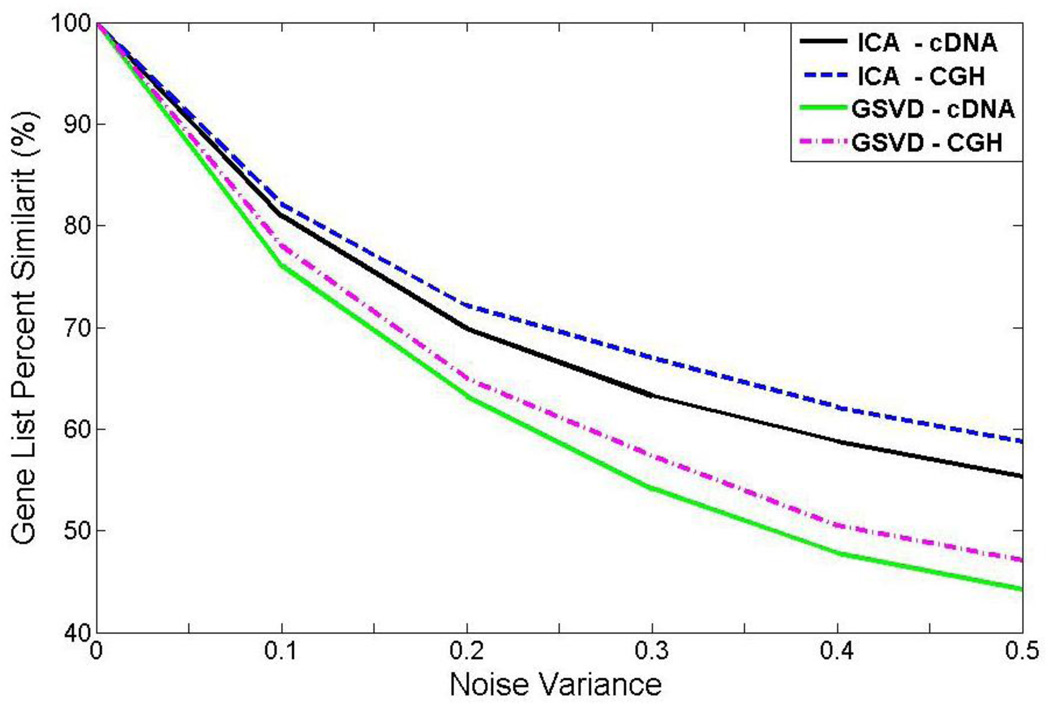
We compared our proposed ICA gene shaving method with the GSVD gene shaving by analyzing of an ensemble of 1,000 expression and copy number data sets in a simulation study. Each set has N = P = 1,500 genes in 3 samples. We analyzed 75 remaining genes. Additive random noise was generated 1,000 times for each variance level. We compared the two methods based on the percentage similarity (PS) index. The results were shown in Fig. 5.
Figure 5.
The effects of additive noise on PS value in cDNA and aCGH data using GSVD gene shaving and ICA gene shaving algorithm, respectively.
The results in Fig. 5 show that the ranges of PS for both gene expression and gene copy numbers decrease with the increase of noise level, regardless of the shaving method used. The PS value with ICA gene shaving method is always higher than that of GSVD gene shaving, which indicates that the ICA gene shaving method is more robust to the noise.
3.2 Cell Line Case Study
After the proposed ICA gene shaving method has been proven to be effective on simulated data, it was then tested on real biological data. Three breast cancer cell lines with similar copy number profiles on chromosome 17 were analyzed [40]. The SKBR3, BT474 and UACC812 cell lines all have amplified regions around the ERBB2 gene, which is known to play roles in the progression of breast cancers [15].
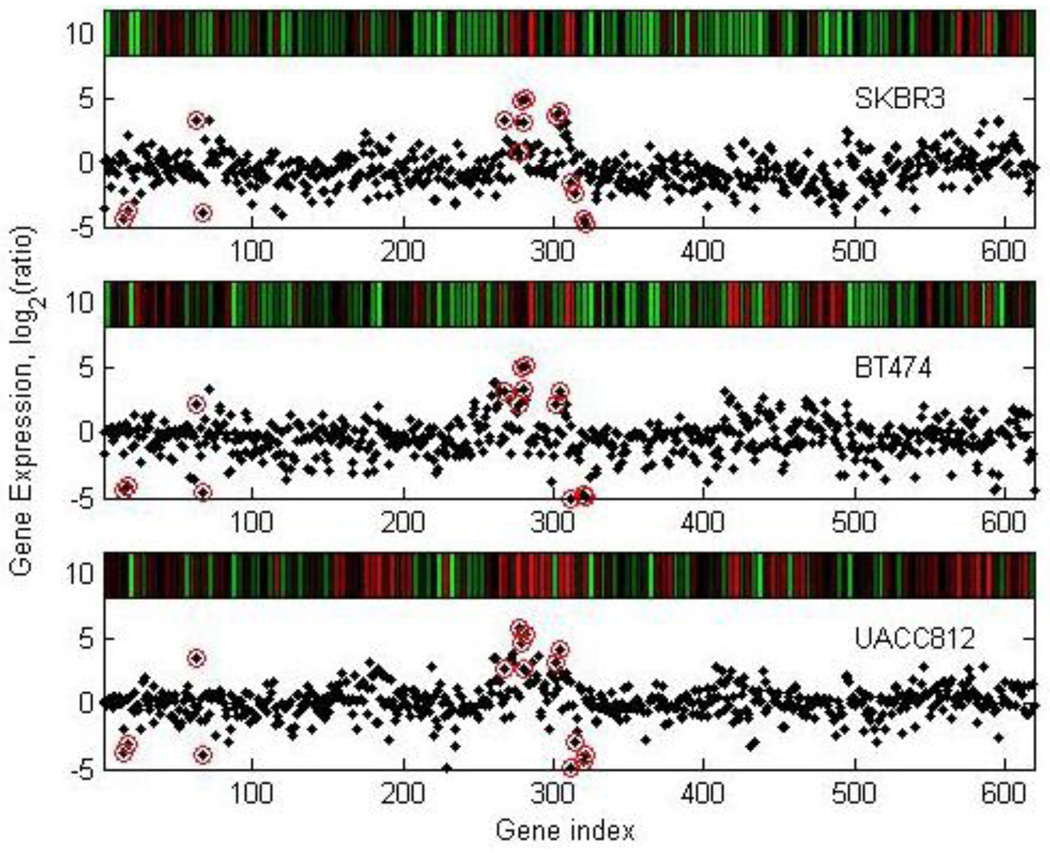
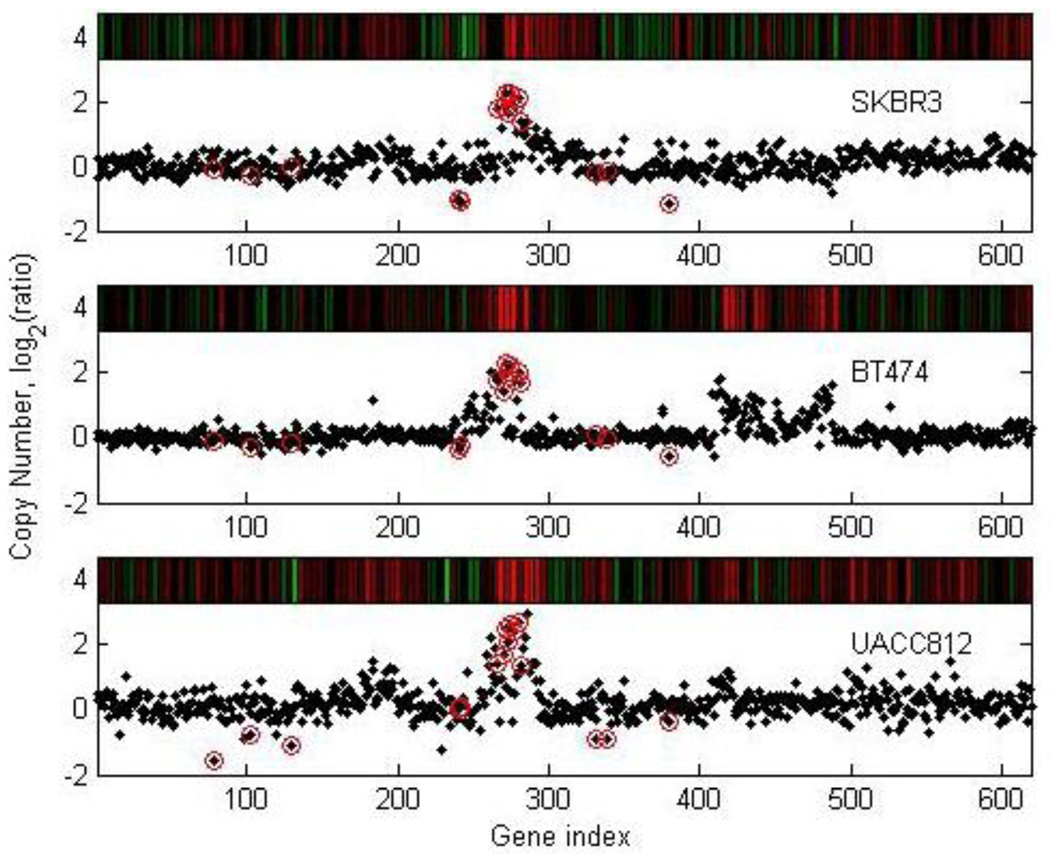
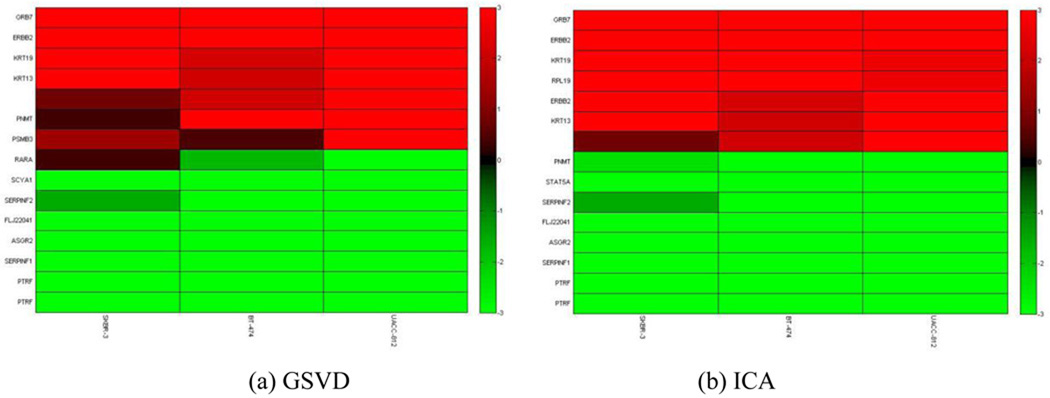
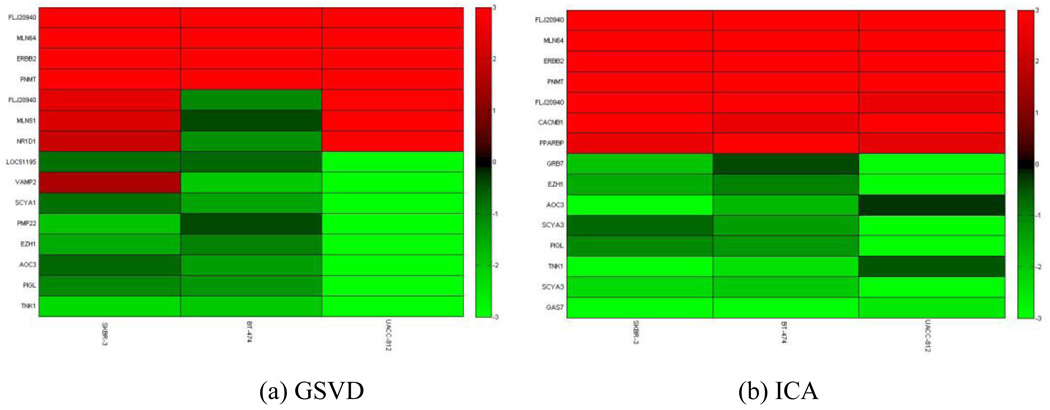
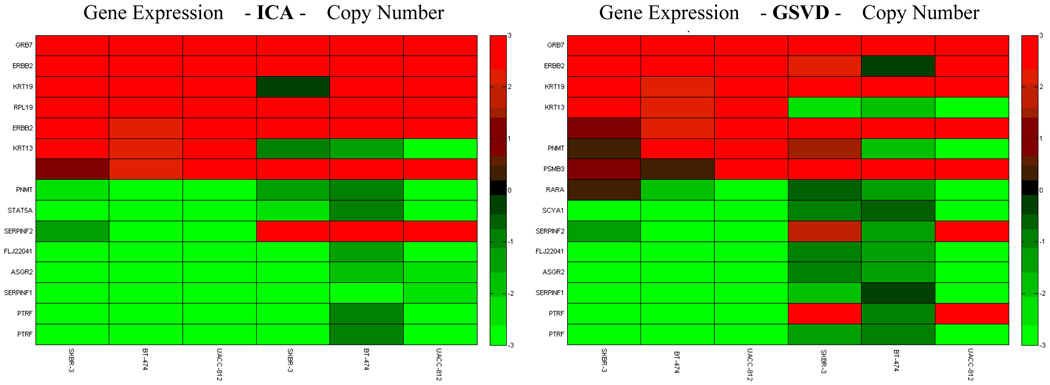
From the original dataset from Hyman et al [15], we parse out genes from chromosome 17. Each set has N = P = 619 genes in 3 samples. We retained the top 5 percent of the most interesting genes in chromosome 17. We detected genes and genomic locations from gene expressions and copy numbers with high variations, as shown in Fig. 6 and Fig. 7, respectively. We obtained a list of genes and copy numbers that captured the highest shared variation with our proposed method. Fig. 8 shows the list of gene subsets from the ICA and GSVD gene shaving respectively based on gene expression data, while Fig. 9 displays the list of gene subsets based on gene copy number changes. Fig. 10 displays the top 15 highest variant genes from combined gene expression and copy number changes using the ICA and GSVD methods respectively.
Figure 6.
Plot of selected genes from cDNA gene expression data. This plot shows the original cell line expression data for the SKBR3, BT 474 and UACC812 cell lines over chromosome 17. The circled genes were selected using our ICA gene shaving method.
Figure 7.
Plot of selected genes from aCGH copy number data. This plot shows the original cell line copy number data for the SKBR3, BT 474 and UACC812 cell lines over chromosome 17. The circled genes were selected using our ICA gene shaving method.
Figure 8.
These plots show the selected genes using (a) the GSVD gene shaving method and (b) the ICA gene shaving method respectively, based on cDNA gene expression.
Figure 9.
These plots show the selected genes using (a) the GSVD gene shaving method and (b) the ICA gene shaving method respectively, based on aCGH copy number data.
Figure 10.
We retain the gene expression values of the top 15 highest variant genes from combined gene expression and copy number changes using the ICA and GSVD methods respectively.
From the gene list provided, we observe that all ERBB2 genes were successfully extracted using our ICA gene shaving method while one ERBB2 gene was extracted using the GSVD gene shaving method. Our method was also able to uncover several HOX family genes (HOXB3, HOXB6 and HOXB7), which have been found to contribute to the progression of several cancer types [41]. Thus, our ICA gene shaving method found more genes related to breast cancers than the GSVD gene shaving method.
3.3. Analyzing Breast Cancer Cell Lines and Breast Cancer Tumors
We present another case study using the data from breast cancer cell lines [15] and breast tumors [42].
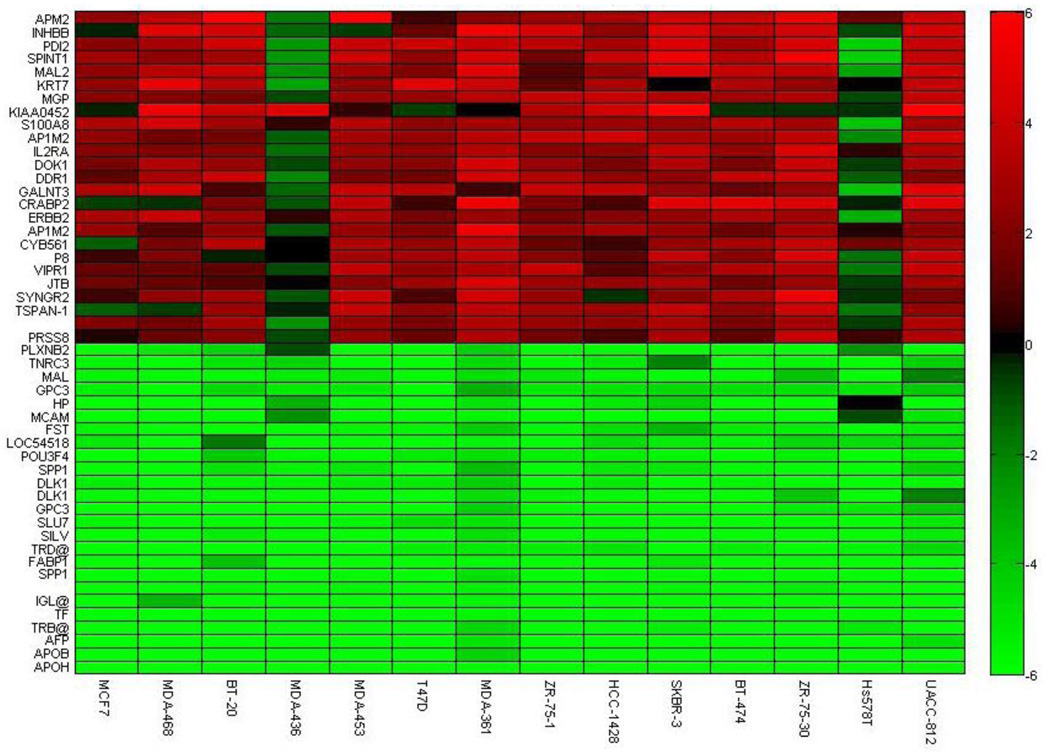
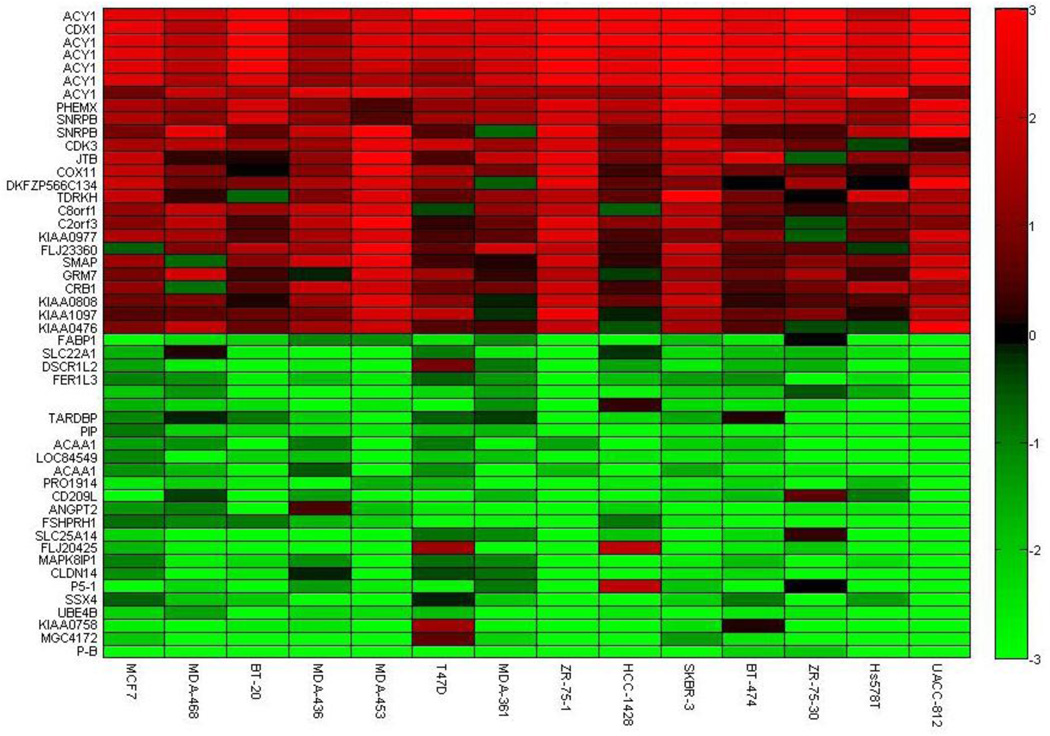
Our ICA gene shaving method was applied to the breast cancer cell lines [15] with Algorithms 1–3. We report the top 50 of the highest variant genes corresponding to algorithm 3 in Fig. 11 and Fig. 12 in terms of gene expression and copy number ratios, respectively. We can observe the correlation across the samples for over- or under-expressed genes, in addition to amplified or deleted genes. The genes in Fig. 11 capture the highest expression variations, which represent extremely over- and under-expression with similar transcriptional responses. Similarly, the genes in Fig. 12 capture the highest variation in the copy number changes. We can isolate the groups of genes that have similar and dissimilar patterns of gene expression and copy number. The genes with high copy number changes show highly similar expression characteristics. Fig. 11 and Fig. 12 demonstrate the ability of our algorithms to locate genes with highest variation and with the strongest correlation across all the samples.
Figure 11.
The top highest variant genes of gene expression in 14 samples are retained using algorithm 3 in the study of breast cancer cell lines [15]. The pattern shows the highest parallel contributions to the iterative projections with gene shaving.
Figure 12.
The top highest variant genes with gene copy number changes in 14 samples are retained using algorithm 3 in the study of breast cancer cell line [15].
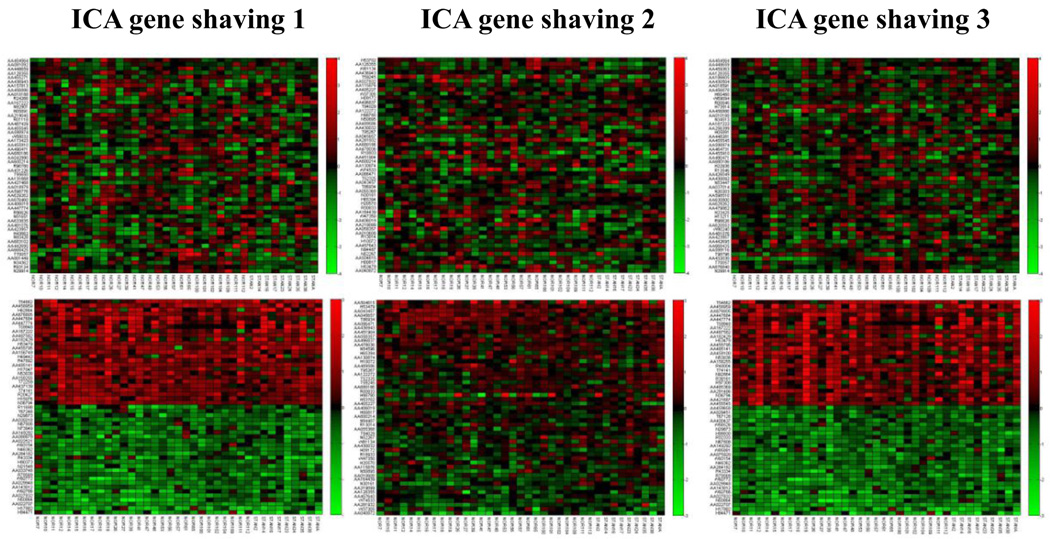
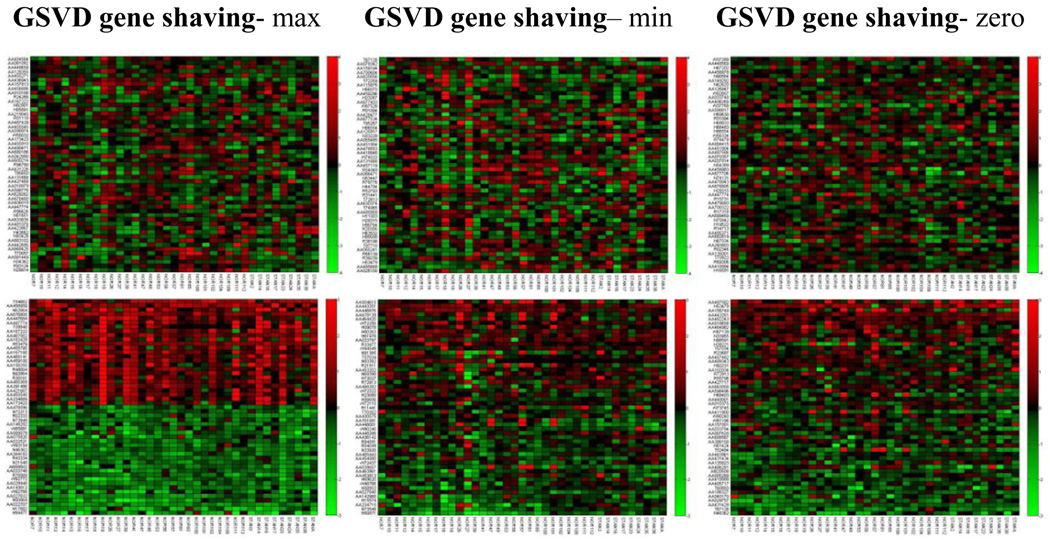
In the study of 37 breast tumors conducted by Pollack et al. [42], it was reported that the copy number changes played a direct role in the transcriptional program of human breast tumors [42]. Based on the analysis of breast tumor data, we show the top 50 highest variant genes using the ICA gene shaving (Algorithm 1–Algorithm 3) respectively on both gene expression and copy number data as shown in Fig. 13. We also compared with the GSVD gene shaving method of different relative significance as shown in Fig. 14.
Figure 13.
The top three pictures are the lists of genes with the top 50 highest variant gene expression using three ICA gene shaving methods, respectively. The bottom three pictures are the list of genes with the top 50 highest variant copy numbers using three ICA gene shaving methods, respectively. The subsets of genes which have similar gene copy number changes can be identified. The data is from the study of breast tumors [42].
Figure 14.
The top three pictures are the lists of genes with the top 50 highest variant gene expression using three GSVD gene shaving methods, respectively. The bottom three pictures are the lists of genes with the top 50 highest variant copy numbers using three GSVD gene shaving methods, respectively. “Max” indicates no significance in the copy number data set relative to the gene expression data set; “Min” indicates no significance in the gene expression data set relative to the gene copy number data set; “zero’ indicates that genes may be of equal significance in both data sets. The data is from the study of breast tumors [42].
From Fig. 13 and Fig. 14, our ICA gene shaving method has better ability to locate genes with highest variation in copy numbers than using the GSVD gene shaving method. The subsets of genes with similarly higher and lower gene copy number changes can be identified with the ICA gene shaving method. No patterns of similar gene expressions were observed in the list of genes with the top 25 highest (positive or negative) variant gene expression using either the GSVD gene shaving or the ICA gene shaving method.
We summarize parameters such as p-values in selecting genes used in the ICA and GSVD based gene shaving methods, as in Table 1 and Table 2. They are for analyzing both gene expression and copy number data, and for analyzing breast cancer cell lines and breast cancer tumors respectively. The lower P-value is, the more statistically significant the detected cluster is. Table 2 and Fig. 13–14 all show that even though ICA gene shaving method has better quality in detecting the clusters than the GSVD method, it is still not good enough to distinguish clearly the top highest gene expressions for the study of breast cancer tumors [42].
Table 1.
A comparison of parameters used for the study of breast cancer cell lines [15]
| Methods | Parameter/Algorithm | P-value(gene expression) | P-value(copy number) |
|---|---|---|---|
| θmax | < 0.001 | < 0.001 | |
| GSVD | θmin | < 0.001 | < 0.001 |
| θ0 | < 0.001 | < 0.001 | |
| algorithm 1 | < 0.001 | < 0.001 | |
| ICA | algorithm 2 | < 0.001 | < 0.001 |
| algorithm 3 | < 0.001 | < 0.001 | |
Table 2.
A comparison of parameters used for the study of breast cancer tumors [42]
| Methods | Parameter/Algorithm | P-value(gene expression) | P-value(copy number) |
|---|---|---|---|
| θmax | 0.7748 | <0.001 | |
| GSVD | θmin | 0.8766 | < 0.001 |
| θ0 | 0.8968 | < 0.001 | |
| algorithm 1 | 0.4156 | < 0.001 | |
| ICA | algorithm 2 | 0.5321 | < 0.001 |
| algorithm 3 | 0.3432 | < 0.001 | |
We also applied our method to identify gene subsets that contribute to breast cancer tumors. Genes with the highest statistical significance include ERBB2, MUC1, and GRB7 with concomitant changes in copy number and expression levels. For the tumor samples, our ICA gene shaving method was able to locate known or candidate oncogenes successfully. The GSVD gene shaving method obtained all three oncogenes (ERBB2, CCND1 and MYC) and two candidate oncogenes (GRB2 and TPD51) corresponding to projection angle “max”; two oncogenes (ERBB2 and MYC) and two candidate oncogenes (TPD52 and GRB7) corresponding to “min”; and two oncogenes (ERBB2 and MYC) and a candidate oncogenes (GRB7) corresponding to “zero”. Our ICA gene shaving method obtained all three oncogenes (ERBB2, CCND1 and MYC), and three candidate oncogenes (GRB2, TPD52 and GRO1) corresponding to “Algorithm 1”; two candidate oncogenes (GRB2 and GRO1) corresponding to “Algorithm 2”; and three candidate oncogenes (GRB2, TPD52 and GRB7) corresponding to “Algorithm 3”. These genes were known to contribute to the progression of breast cancer tumors but were missed by the GSVD gene shaving method.
Our method was successfully used to locate important genes that exhibit patterns of similar and dissimilar variations. All three oncogenes and more candidate oncogenes are obtained by the three algorithms of the ICA gene shaving method, even if no patterns of similar gene expressions are observed. “Algorithm 1” depends more on the gene copy number data set, and “Algorithm 2” depends more on the gene expression data set. “Algorithm 3” uses both the gene expression and copy number data sets equally. These algorithms are appropriate for different data sets, which is similar to the GSVD method when using different projection angles [28].
4. Conclusion
Combining genomic data from different sources promises to be a very robust, reliable and efficient technique. In this paper, we integrate gene copy number changes with gene expression for locating subsets of genes with similar and dissimilar patterns of variations. The combined datasets result in more accurate identification of gene subsets associated with cancers and diseases. We compared the ICA based gene shaving method with the GSVD based one. When tested on simulated data, the ICA gene shaving method increased performance by about 10% over that of the GSVD gene shaving in terms of the gene list percentage similarity value, which indicates the improved robustness of the method to noise. Statistical analysis was performed using both copy number and expression data to identify genes, showing differential expressions associated with copy number alterations.
The SVD method has been used for the analysis of gene expression and copy number data [26], which are, however, not analyzed in an integrated manner. The GSVD based gene shaving method was proposed in [28] to integrate the two datasets. It has been used to identify gene subsets in breast cancer cell lines and breast cancer tumors, but also has limitations. Our proposed ICA gene shaving method improves this method by using a more realistic model, as demonstrated in our simulation study. Furthermore, testing on real breast cancer cell and breast tumor data shows that the ICA gene shaving method can identify genes that were missed by the GSVD gene shaving method, which are known to contribute to the progression of breast cancers. All three oncogenes and more candidate oncogenes can be obtained with our ICA gene shaving method. This method will contribute to better medical diagnosis and prognosis with improved identification of gene subsets associated with diseases and cancers.
The ICA method appears to be useful for gene data analysis, but it also has some inherent limitations. If gene component processes exhibit saturation or other nonlinear properties, it may not be appropriate for analysis using a wholly linear model. The ICA algorithm assumes that the distribution for each signal component is statistically independent. This criterion provides an essentially unique decomposition of the data, but it may not necessarily be the desired representation for all purposes. There are new developments or other variants of ICA methods such as the group ICA [29] and we are currently exploring their use in integrated genomic data analysis.
Acknowledgements
This work has been supported by both NSF and NIH.
Biographies

Jinhua Sheng (IEEE, SM’2006) received the Bachelor and Master’s degree in electronic engineering from Hefei University of Technology, China, and the Ph. D degree in Nuclear Electronics from University of Science and Technology of China, respectively.
Dr. Sheng joined China Academy of Telecommunications Technology as an associate professor, and an associate dean of graduate school in 1997. From 2001, he works in the Department of Electrical and Computer Engineering at University of Illinois at Chicago, Rush University, University of Wisconsin and University of Missouri as a Postdoctoral Fellow, Research Associate and Research Scientist. He has published about forty papers and been granted two U. S. patents. His research works have been reported in some professional journals or media, such as 《Science Daily》; 《eBioNews》; 《BIO ON NEWS》. His research interests include Image Processing, Medical Imaging, Nuclear Electronics, Bioinformatics, and Genomic Signal Processing.
Dr. Sheng is an active reviewer for many peer-reviewed journals such as 《Medical Engineering & Physics》, 《Neurocomputing》, 《BioMed Central Bioinformatics》, IEEE Transactions on 《Systems, Man and Cybernetics》, IEEE Transactions on 《Signal Processing》, EURASIP Journal on 《Advances in Signal Processing》, etc., and some International Conferences.

Hong-Wen Deng received his bachelor's degree in ecology and environmental biology and his master’s degree in ecology and entomology from Peking University. He received his master’s in mathematical statistics and a Ph.D. in quantitative genetics from the University of Oregon. Dr. Deng was a postdoctoral fellow in the Human Genetics Center at the University of Texas in Houston where he conducted postdoctoral research in molecular and statistical population/quantitative genetics. He also served as a Hughes Fellow in the Institute of Molecular Biology at the University of Oregon.
Dr. Deng previously served as professor of medicine and biomedical sciences at Creighton University Medical Center. He is currently a professor of orthopaedic surgery and basic medical science and the Franklin D. Dickson/Missouri Endowed Chair in Orthopaedic Surgery at the School of Medicine of University of Missouri-Kansas City. He is the holder of multiple NIH RO1 awards and recipients of multiple honors for his research. He is widely published with over 300 peer-reviewed articles, 10 book chapters, 3 books. His area of interest is in the genetics of osteoporosis and obesity.

Vince D. Calhoun (S’88–M’02–SM’05) received the Bachelor’s degree in electrical engineering from the University of Kansas, Lawrence, in 1991, the Master’s degrees in biomedical engineering and information systems from John’s Hopkins University, Baltimore, MD, in 1993 and 1996, respectively, and the Ph.D. degree in electrical engineering from the University of Maryland Baltimore County, Baltimore, in 2002.
He was a Senior Research Engineer at the Psychiatric Neuro-Imaging Laboratory, John’s Hopkins, from 1993 until 2002. He then became the Director of Medical Image Analysis at the Olin Neuropsychiatry Research Center and an Associate Professor at Yale University. He is currently Director of Image Analysis and MR Research at the Mind Research Network and is an Associate Professor in the Department of Electrical and Computer Engineering, Neurosciences, and Computer Science at the University of New Mexico, Albuquerque. He is the author of more than 80 full journal articles and over 200 technical reports, abstracts, and conference proceedings. Much of his career has been spent on the development of data-driven approaches for the analysis of functional magnetic resonance imaging (fMRI) data. He has multiple NSF and NIH grants on the incorporation of prior information into independent component analysis (ICA) for fMRI, data fusion of multimodal imaging and genetics data, and the identification of biomarkers for disease. He has participated in multiple NIH study sections.
Dr. Calhoun is a Senior Member of the Organization for Human Brain Mapping and the International Society for Magnetic Resonance in Medicine. He has worked in the organization of workshops at conferences including the Society of Biological Psychiatry (SOBP) and the International Conference Of Independent Component Analysis And Blind Source Separation (ICA). He is currently serving on the IEEE Machine Learning for Signal Processing (MLSP) Technical Committee and has previously served as the General Chair of the 2005 meeting. He is a reviewer for a number of international journals and is on the Editorial Board of the Human Brain Mapping and Neuroimage journals and an Associate Editor for the IEEE Signal Processing Letters and the International Journal of Computational Intelligence and Neuroscience.
Yu-Ping Wang (SM’2006) received the BS degree in applied mathematics from Tianjin University, China, in 1990, and the MS degree in computational mathematics and the PhD degree in communications and electronic systems from Xi’anJioatong University, China, in 1993 and 1996, respectively. After his graduation, he had visiting positions at the Center for Wavelets, Approximation and Information Processing of the National University of Singapore and Washington University Medical School in St. Louis. From 2000 to 2003, he worked as a senior research engineer at Perceptive Scientific Instruments, Inc., and then Advanced Digital Imaging Research, LLC, Houston, Texas. In the Fall of 2003, he returned to academia as an assistant professor of computer science and electrical engineering at the University of Missouri-Kansas City. He is currently an associate professor of Biomedical Engineering and Biostatistics at Tulane University. His research interests lie in the interdisciplinary biomedical imaging and bioinformatics areas, where he has about 100 publications. He has served on numerous program committees and NSF/NIH review panels. He was a guest editor for the Journal of VLSI Signal Processing Systems on a special issue on genomic signal processing and is a member of Machine Learning for Signal Processing technical committee of the IEEE Signal Processing Society.
Contributor Information
Jinhua Sheng, Email: j.sheng@yahoo.com.
Hong-Wen Deng, Email: dengh@umkc.edu.
Vince Calhoun, Email: vcalhoun@unm.edu.
Yu-Ping Wang, Email: wyp@tulane.edu.
References
- 1.Int’l Human Genome Sequencing Consortium. Finishing the Euchromatic Sequence for the Human Genome. Nature. 2004 Oct;vol. 431:931–945. doi: 10.1038/nature03001. [DOI] [PubMed] [Google Scholar]
- 2.Lockhart DJ, Dong H, Byrne MC, Follettie MT, Gallo MV, Chee MS, Mittmann M, Wang C, Kobayashi M, Horton H, Brown EL. Expression Monitoring by Hybridization to High-Density Oligonucleotide Arrays. Nature Biotechnology. 1996 Dec;vol. 14:1675–1680. doi: 10.1038/nbt1296-1675. [DOI] [PubMed] [Google Scholar]
- 3.Schena M, Shalon D, Davis RW, Brown PO. Quantitative Monitoring of Gene Expression Patterns with a Complementary DNA Microarray. Science. 1995 Oct;vol. 270:467–470. doi: 10.1126/science.270.5235.467. [DOI] [PubMed] [Google Scholar]
- 4.Bezerra GB, Cançado GMA, Menossi M, de Castro LN, Von Zuben FJ. Recent advances in gene expression data clustering: a case study with comparative results. Genetics and Molecular Research. 2005;vol. 4:514–524. [PubMed] [Google Scholar]
- 5.Chen J, Wang Y-P. A statistical model-based approach for the identification of DNA copy number changes in array CGH datasets. IEEE Trans. Computational Biology and Bioinformatics, Oct–Dec issue. 2009;vol. 6(4):529–541. doi: 10.1109/TCBB.2008.129. [DOI] [PMC free article] [PubMed] [Google Scholar]
- 6.Pomeroy SL, Tamayo P, Gaasenbeek M, Sturla LM, Angelo M, McLaughlin ME, Kim JYH, Goumnerova LC, Black PM, Lau C, Allen JC, Zagzag D, Olson JM, Curran T, Wetmore C, Biegel JA, Poggio T, Mukherjee S, Rifkin R, Califano A, Stolovitzky G, Louis DN, Mesirov JP, Lander ES, Golub TR. Prediction of central nervous system embryonal tumor outcome based on gene expression. Nature 2002. 2002;vol. 41:436–442. doi: 10.1038/415436a. [DOI] [PubMed] [Google Scholar]
- 7.Kallioniemi OP, Kallioniemi A, Piper J, Isola J, Waldman FM, Gray JW, Pinkel D. Optimizing comparative genomic hybridization for analysis of DNA sequence copy number changes in solid tumors. Genes Chromosomes Cancer. 1994;vol.10:231–243. doi: 10.1002/gcc.2870100403. [DOI] [PubMed] [Google Scholar]
- 8.Kallioniemi A. CGH Microarrays and Cancer. Curr. Opin. Biotech. 2008;vol.19:36–40. doi: 10.1016/j.copbio.2007.11.004. [DOI] [PubMed] [Google Scholar]
- 9.Shinawi M, Cheung SW. The Array CGH and its Clinical Applications. Drug Discov.. Today. 2008;vol.13:760–770. doi: 10.1016/j.drudis.2008.06.007. [DOI] [PubMed] [Google Scholar]
- 10.Speicher MR, Carter NP. The New Cytogenetics: Blurring the Boundaries with Molecular Biology. Nature Reviews Genetics. 2005;vol. 6:782–792. doi: 10.1038/nrg1692. [DOI] [PubMed] [Google Scholar]
- 11.Lee H, Kong SW, Park PJ. Integrative Analysis Reveals the Direct and Indirect Interactions between DNA Copy Number Aberrations and Gene Expression Changes. Bioinformatics. 2008;vol. 24:889–896. doi: 10.1093/bioinformatics/btn034. [DOI] [PMC free article] [PubMed] [Google Scholar]
- 12.Menezes RX, Boetzer M, Sieswerda M, Ommen GB, Boer JM. Integrated Analysis of DNA Copy Number and Gene Expression Microarray Data using Gene Sets. BMC Bioinformatics. 2009;vol. 10:203–217. doi: 10.1186/1471-2105-10-203. [DOI] [PMC free article] [PubMed] [Google Scholar]
- 13.Schäfer M, Schwender H, Merk S, Haferlach C, Ickstadt K, Dugas M. Integrated Analysis of Copy Number Alterations and Gene Expression: a Bivariate Assessment of Equally Directed Abnormalities. Bioinformatics. 2009;vol. 25:3228–3235. doi: 10.1093/bioinformatics/btp592. [DOI] [PubMed] [Google Scholar]
- 14.Soneson C, Lilljebjörn H, Fioretos T, Fontes M. Integrative analysis of gene expression and copy number alterations using canonical correlation analysis. BMC Bioinformatics. 2010;vol. 11:191–211. doi: 10.1186/1471-2105-11-191. [DOI] [PMC free article] [PubMed] [Google Scholar]
- 15.Hyman E, Kauraniemi P, Hautaniemi S, Wolf M, Mousses S, Rozenblum E, Ringne´r M, Sauter G, Monni O, Elkahloun A, Kallioniemi OP, Kallioniemi A. Impact of DNA amplification on gene expression patterns in breast cancer. Cancer Research. 2002;vol. 62:6240–6245. [PubMed] [Google Scholar]
- 16.Pollack JR, Sørlie T, Perou CM, Rees CA, Jeffrey SS, Lonning PE, Tibshirani R, Botstein D, Børresen-Dale AL, Brown PO. Microarray analysis reveals a major direct role of DNA copy number alteration in the transcriptional program of human breast tumors. Proceedings of the National Academy of Sciences of the United States of America. 2002;vol. 99:12963–12968. doi: 10.1073/pnas.162471999. [DOI] [PMC free article] [PubMed] [Google Scholar]
- 17.Aguirre AJ, Brennan C, Bailey G, Sinha R, Feng B, Leo C, Zhang Y, Zhang J, Gans JD, Bardeesy N, Cauwels C, Cordon-Cardo C, Redston MS, DePinho RA, Chin L. High-resolution characterization of the pancreatic adenocarcinoma genome. Proceedings of the National Academy of Sciences of the United States of America. 2004;vol. 101:9067–9072. doi: 10.1073/pnas.0402932101. [DOI] [PMC free article] [PubMed] [Google Scholar]
- 18.Tsafrir D, Bacolod M, Selvanayagam Z, Tsafrir I, Shia J, Zeng Z, Liu H, Krier C, Stengel RF, Barany F, Gerald WL, Paty PB, Domany E, Notterman DA. Relationship of Gene Expression and Chromosomal Abnormalities in Colorectal Cancer. Cancer Research. 2006;vol. 66:2129–2137. doi: 10.1158/0008-5472.CAN-05-2569. [DOI] [PubMed] [Google Scholar]
- 19.Phillips JL, Hayward SW, Wang Y, Vasselli J, Pavlovich C, Padilla-Nash H, Pezullo JR, Ghadimi BM, Grossfeld GD, Rivera A, Linehan WM, Cunha GR, Ried T. The Consequences of Chromosomal Aneuploidy on Gene Expression Profiles in a Cell Line Model for Prostate Carcinogenesis. Cancer Research. 2001;vol. 61:8143–8149. [PubMed] [Google Scholar]
- 20.Tonon G, Wong KK, Maulik G, Brennan C, Feng B, Zhang Y, Khatry DB, Protopopov A, You MJ, Aguirre AJ, Martin ES, Yang Z, Ji H, Chin L, DePinho RA. High-resolution genomic profiles of human lung cancer. Proceedings of the National Academy of Sciences of the United States of America. 2005;vol.102:9625–9630. doi: 10.1073/pnas.0504126102. [DOI] [PMC free article] [PubMed] [Google Scholar]
- 21.Mao R, Wang X, Spitznagel EL, Frelin LP, Ting JC, Ding H, Kim JW, Ruczinski I, Downey TJ, Pevsner J. Primary and secondary transcriptional effects in the developing human Down syndrome brain and heart. Genome Biology. 2005;vol. 6:R107.1–R107.20. doi: 10.1186/gb-2005-6-13-r107. [DOI] [PMC free article] [PubMed] [Google Scholar]
- 22.Bussey KJ, Chin K, Lababidi S, Reimers M, Reinhold WC, Kuo WL, Gwadry F, Ajay, Kouros-Mehr H, Fridlyand J, Jain A, Collins C, Nishizuka S, Tonon G, Roschke A, Gehlhaus K, Kirsch I, Scudiero DA, Gray JW, Weinstein JohnN. Integration Data on DNA Copy Number with Gene Expression Levels and Drug Sensitivities in the NCI-60 Cell Line Panel. Molecular Cancer Therapeutics. 2006;vol. 5:853–867. doi: 10.1158/1535-7163.MCT-05-0155. [DOI] [PMC free article] [PubMed] [Google Scholar]
- 23.van Wieringen WesselN, van de Wiel MarkA. Nonparametric testing for DNA copy number induced differential mRNA gene expression. Biometrics. 2009;vol. 65:19–29. doi: 10.1111/j.1541-0420.2008.01052.x. [DOI] [PubMed] [Google Scholar]
- 24.Chin K, Vries SD, Fridlyand J, Spellman PT, Roydasgupta R, Kuo W-L, Lapuk A, Neve RM, Qian Z, Ryder T, Chen F, Feiler H, Tokuyasu T, Kingsley C, Dairkee S, Meng Z, Chew K, Pinkel D, Jain A, Ljung BM, Esserman L, Albertson DG, Waldman FM, Gray JW. Genomic and transcriptional aberrations linked to breast cancer pathophysiologies. Cancer Cell. 2006;vol.10:529–541. doi: 10.1016/j.ccr.2006.10.009. [DOI] [PubMed] [Google Scholar]
- 25.Horlings HM, Lai C, Nuyten DSA, Halfwerk H, Kristel P, Beers E, Joosse SA, Klijn C, Nederlof PM, Reinders MJT, Wessels LFA, Vijver MJ. Integration of DNA Copy Number Alterations and Prognostic Gene Expression Signatures in Breast Cancer Patients. Clinical Cancer Research. 2010;vol. 16:651–663. doi: 10.1158/1078-0432.CCR-09-0709. [DOI] [PubMed] [Google Scholar]
- 26.Alter O, Brown PO, Botstein D. Singular Value Decomposition for Genome-Wide Expression Data Processing and Modeling. Proc. Nat’l Academy of Science USA. 2000 Aug;vol. 97:10 101–10 106. doi: 10.1073/pnas.97.18.10101. [DOI] [PMC free article] [PubMed] [Google Scholar]
- 27.Hastie T, Tibshirani R, Eisen MB, Alizadeh A, Levy R, Staudt L, Chan WC, Botstein D, Brown P. 'Gene shaving' as a method for identifying distinct sets of genes with similar expression patterns. Genome Biology. 2000;Vol. 1(no. 3):1–20. doi: 10.1186/gb-2000-1-2-research0003. [DOI] [PMC free article] [PubMed] [Google Scholar]
- 28.Berger JA, Hautaniemi S, Mitra SK, Astola J. Jointly Analyzing Genes Expression and Copy Number Data in Breast Cancer using Data Reduction models. IEEE Transactions on Computational Biology and Bioinformatics. 2006;vol. 3(no.1):2–16. doi: 10.1109/TCBB.2006.10. [DOI] [PubMed] [Google Scholar]
- 29.Calhoun V, Liu J, Adali T. A Review of Group ICA for fMRI Data and ICA for Joint Inference of Imaging, Genetic, and ERP Data. NeuroImage. 2009;vol. 45:S163–S172. doi: 10.1016/j.neuroimage.2008.10.057. [DOI] [PMC free article] [PubMed] [Google Scholar]
- 30.Calhoun VD, Adali T, Pearlson GD, Kiehl KA. Neuronal Chronometry of Target Detection Fusion of Hemodynamic and Event-related Potential Data. NeuroImage. 2006;vol. 30:544–553. doi: 10.1016/j.neuroimage.2005.08.060. [DOI] [PubMed] [Google Scholar]
- 31.Wang Y-P. Integration of gene expression and gene copy number variations with independent component analysis. Conf Proc IEEE Eng Med Biol Soc.; 2008. pp. 5700–5703. [DOI] [PubMed] [Google Scholar]
- 32.Liebermeister W. Linear Modes of Gene Expression Determined by Independent Component Analysis. Bioinformatics. 2002;vol. 18:51–60. doi: 10.1093/bioinformatics/18.1.51. [DOI] [PubMed] [Google Scholar]
- 33.Hyvärinen A. Independent Component Analysis: Algorithms and Applications. Neural Networks. 2000;13(4–5):411–430. doi: 10.1016/s0893-6080(00)00026-5. [DOI] [PubMed] [Google Scholar]
- 34.Bell AJ, Sejnowski TJ. An Information Maximization Approach to Blind Separation and Blind Deconvolution. Neural Comput. 1995;vol. 7(no. 6):1129–1159. doi: 10.1162/neco.1995.7.6.1129. [DOI] [PubMed] [Google Scholar]
- 35.Hyvärinen A, Oja E. A Fast Fixed-point Algorithm for Independent Component Analysis. Neural Comput. 1997;vol. 9(no. 7):1483–1492. [Google Scholar]
- 36.Cardoso JF, Souloumiac A. Blind Beamforming for non-Gaussian Signals. IEE-Proc.-F. 1993;vol. 140(no. 6):362–370. [Google Scholar]
- 37.Sheng J, Deng H-W, Calhoun V, Wang Y-P. webpage: Integrated Analysis of Gene Expression and Copy Number Data on Gene Shaving using Independent Component Analysis. doi: 10.1109/TCBB.2011.71. http://sites.google.com/site/geneticimaging/file-cabinet. [DOI] [PMC free article] [PubMed]
- 38.Wang P, Kim Y, Pollack J, Narasimhan B, Tibshirani R. A Method for Calling Gains and Losses in Array CGH Data. Biostatistics. 2005 Jan;vol. 6:45–58. doi: 10.1093/biostatistics/kxh017. [DOI] [PubMed] [Google Scholar]
- 39.Attoor S, Dougherty ER, Chen Y, Bittner ML, Trent JM. Which Is Better for cDNA-Microarray-Based Classification: Ratios or Direct Intensities. Bioinformatics. 2004 Nov;vol. 20:2513–2520. doi: 10.1093/bioinformatics/bth272. [DOI] [PubMed] [Google Scholar]
- 40.Monni O, Bärlund M, Mousses S, Kononen J, Sauter G, Heiskanen M, Paavola P, Avela K, Chen Y, Bittner ML, Kallioniemi A. Comprehensive Copy Number and Gene Expression Profiling of the 17q23 Amplicon in Human Breast Cancer. Proc. Nat’l Academy of Science USA. 2001 May;vol. 98:5711–5716. doi: 10.1073/pnas.091582298. [DOI] [PMC free article] [PubMed] [Google Scholar]
- 41.Kauraniemi P, Hautaniemi S, Autio R, Astola J, Monni O, Elkahloun A, Kallioniemi A. Effects of herceptin treatment on Global Gene Expression Patterns in HER2-Amplified and Non-amplified Breast Cancer Cell Lines. Oncogene. 2004 Jan;vol. 23:1010–1013. doi: 10.1038/sj.onc.1207200. [DOI] [PubMed] [Google Scholar]
- 42.Pollack JR, Sørlie T, Perou CM, Rees CA, Jeffrey SS, Lonning PE, Tibshirani R, Botstein D, Børresen-Dale AL, Brown PO. Microarray analysis reveals a major direct role of DNA copy number alteration in the transcriptional program of human breast tumors. The National Academy of Sciences, USA. 2002;vol. 99:12963–12968. doi: 10.1073/pnas.162471999. [DOI] [PMC free article] [PubMed] [Google Scholar]


