

Abstract
Dynamic regulation of the localization and function of NMDA receptors (NMDARs) is critical for synaptic development and function. The composition and localization of NMDAR subunits at synapses are tightly regulated and can influence the ability of individual synapses to undergo long-lasting changes in response to stimuli. Here, we examine mechanisms by which EphB2, a receptor tyrosine kinase that binds and phosphorylates NMDARs, controls NMDAR subunit localization and function at synapses. We find that, in mature neurons, EphB2 expression levels regulate the amount of NMDARs at synapses, and EphB activation decreases Ca2+-dependent desensitization of NR2B-containing NMDARs. EphBs are required for enhanced localization of NR2B-containing NMDARs at synapses of mature neurons; triple EphB knock-out mice lacking EphB1–3 exhibit homeostatic upregulation of NMDAR surface expression and loss of proper targeting to synaptic sites. These findings demonstrate that, in the mature nervous system, EphBs are key regulators of the synaptic localization of NMDARs.
Introduction
The NMDA receptor (NMDAR) is essential for neuronal development and function, synaptic plasticity, and adaptive responses to sensory experience (Cull-Candy and Leszkiewicz, 2004; Pérez-Otaño and Ehlers, 2005; Lau and Zukin, 2007). These functions require glutamate-dependent calcium influx into neurons through the NMDAR. The NMDAR is a heteromeric protein complex of two obligate NR1 subunits and typically two NR2 subunits, which each convey distinct functional properties to the receptor (Cull-Candy and Leszkiewicz, 2004). NR2A is the principal subunit at mature cortical and hippocampal synapses. Although NR2B subunits are more prevalent at these synapses during development, they are still expressed in the mature brain (Monyer et al., 1994; Sheng et al., 1994; Tovar and Westbrook, 1999). NR2B-containing NMDARs have a slower inactivation rate and longer decay times compared with NR2A subunits (Cull-Candy and Leszkiewicz, 2004). Thus, synapses with higher proportions of NR2B can integrate synaptic currents across broader time intervals than those with more NR2A. In addition, NR2B-containing NMDA receptors carry more Ca2+ current per unit charge (Sobczyk et al., 2005), are preferentially tethered to the plasticity protein CaMKII (calcium/calmodulin-dependent protein kinase II) (Barria and Malinow, 2005), and exhibit a lower threshold to undergo potentiation of synaptic responses (Philpot et al., 2007; Philpot and Zukin, 2010). Thus, understanding the molecular mechanisms that direct trafficking of NR2B subunits to and from synapses will provide insights into synaptic plasticity.
NMDARs are recruited to and retained at synapses through well studied mechanisms (Pérez-Otaño and Ehlers, 2005; Lau and Zukin, 2007), including postsynaptic density-95/Discs large/zona occludens-1 (PDZ) binding domain interactions and phosphorylation of the receptor itself (Kim and Sheng, 2004; Prybylowski et al., 2005; Chen and Roche, 2007). Activation of EphB leads to a Src kinase-dependent phosphorylation of the NR2B subunit at three tyrosine residues (Takasu et al., 2002; Antion et al., 2010). One of these residues, Y1472, is important for regulating NMDAR surface and synaptic localization (Salter and Kalia, 2004), suggesting that EphBs might play a role in the synaptic targeting/retention of NMDARs.
The EphB family of receptor tyrosine kinases is enriched at excitatory synapses and is important during synapse and spine formation and maintenance (Aoto and Chen, 2007; Tolias et al., 2007; Klein, 2009; Shi et al., 2009). Triple knock-out mice lacking EphB1–3 have fewer excitatory synapses (Henkemeyer et al., 2003; Kayser et al., 2006), whereas animals lacking only EphB2 have reduced NMDAR content at synapses (Henderson et al., 2001). In addition to modulating NMDAR-mediated calcium influx, activation of EphBs leads to a direct association between EphB and the NMDAR NR1 subunit (Dalva et al., 2000); EphBs also associate with and regulate trafficking of AMPA receptors (AMPARs) (Irie et al., 2005; Kayser et al., 2006). We examined whether EphBs impact synaptic NMDAR function and contribute to subunit-specific synaptic localization of NMDARs. We find that expression levels of EphB2 control the amount of NMDAR at synapses, and that EphB2 kinase activity regulates the calcium inactivation rate of NR2B-containing NMDARs. EphB2 activation also preferentially targets and stabilizes NR2B-containing NMDARs at synapses. These results suggest that EphBs may be important regulators of NMDAR targeting, subunit composition, and function at mature synapses.
Materials and Methods
Cell culture and transfection.
Dissociated cortical neurons were prepared from embryonic day 17 (E17) to E18 rats of either sex and cultured as described previously (Kayser et al., 2006). Briefly, neurons were cultured in Neurobasal (Invitrogen), B27 supplement (Invitrogen), glutamine (Sigma-Aldrich), and penicillin–streptomycin (Sigma-Aldrich) on poly-d-lysine (BD Biosciences or Sigma-Aldrich) and laminin (BD Biosciences)-coated glass coverslips (12 mm; Bellco Glass) in 24-well plates (Corning Life Sciences). Cells were plated at 150,000 per well and maintained in a humidified incubator with 5% CO2 at 37°C. Neurons were transfected with Lipofectamine 2000 (Invitrogen) at 14 d in vitro (DIV) using methods described previously (Kayser et al., 2008).
HEK-293 cell culture and transfection.
HEK-293 cells were maintained as described (Lin et al., 2004). For transfection, HEK-293 cells were plated at a density of 1 × 10⁶ cells per milliliter on 12 mm glass coverslips coated with poly-d-lysine (10 μg/ml) in 24-well culture plates and transfected with NR1, NR2A, or NR2B and green fluorescent protein (GFP) or EphB2-YFP plasmid (1 μg of plasmid cDNA per 12 mm coverslip in 1:1:1 ratio) using the calcium phosphate method according to the manufacturer's protocol (Invitrogen). For the EphB2-KD experiment, we transfected YFP-NR1, NR2B, and EphB2-KD into HEK-293 cells in 1:1:1 ratio.
Immunocytochemistry.
Cultures were fixed in 4% paraformaldehyde/2% sucrose for 8 min at room temperature. Cells were washed three times in PBS and blocked and permeabilized in 1% ovalbumin (Sigma-Aldrich)/0.2% coldwater fish scale gelatin (Sigma-Aldrich)/0.1% saponin (Sigma-Aldrich) for 1 h at room temperature. Antibody incubations were conducted overnight at 4°C for primary antibody and 1 h at room temperature in secondary antibody diluted in blocking reagents. Antibodies used were as follows: chicken anti-GFP (Millipore; 1:2500), guinea pig anti-VGlut1 (Millipore Bioscience Research Reagents; 1:5000), and mouse anti-NR1 (Millipore Bioscience Research Reagents; 1:1000). Cy2, Cy3, and Cy5 secondary antibodies were obtained from Jackson ImmunoResearch and used at 1:250.
cDNA and short hairpin RNA constructs.
EphB2 short hairpin RNA (shRNA) was described previously (Kayser et al., 2006). The EphB2 rescue construct was generated and described previously (Kayser et al., 2006, 2008). Full-length FLAG-tagged EphB2 and FLAG-tagged kinase inactive EphB2 were described previously (Dalva et al., 2000).
Imaging and analysis.
Images of primary neuronal cultures were acquired by confocal scanning microscopy (Leica) using methods described previously (Kayser et al., 2006, 2008). Briefly, all images were acquired using a 63×, numerical aperture 1.4, oil-immersion objective with z-steps of 0.5 μm and subsequently analyzed with custom-designed NIH ImageJ macros blind to experimental condition. Images were collected from at least three independent experiments. For puncta analysis, images were converted from maximum projections to binary scale, and puncta were identified as continuous groups of pixels corresponding to 0.5–7.5 μm2. Colocalization between puncta was defined as >1 pixel overlap between channels. To determine amount of NR1 at the synapse, images were collected for each condition with the same gain values. Intensity of NR1 staining at the synapse was then calculated for each condition. Amounts for each condition were normalized to the maximum intensity observed from all three conditions.
Electrophysiology.
Whole-cell recordings were made from 21–23 DIV rat cortical neurons. Coverslips were moved into a recording chamber and bathed in a HEPES-buffered artificial CSF (ACSF) solution (in mm: 140 NaCl, 5 KCl, 2 CaCl2, 20 glucose, and 10 HEPES, pH 7.2). GFP-positive pyramidal neurons were chosen for recording. The internal solution contained the following (in mm): 125 CsGlu, 5 EGTA, 2 MgCl2, 1 CsCl2, 2 K2-ATP, 10 HEPES, and 0.42 Na-GTP, pH 7.2. Pipettes were pulled to a 6–9 MΩ resistance, and recordings were made for 2–5 min at −65 mV before bath application of APV. After application of APV, the cell was again recorded for 2–5 min. For experiments conducted at +50 mV, similar recording conditions were used except that coverslips were moved into a recording chamber and bathed in a HEPES-buffered ACSF solution (in mm: 140 NaCl, 5 KCl, 2 CaCl2, 1 MgCl2, 20 glucose, and 10 HEPES, pH 7.2). Tetrodotoxin (TTX) and picrotoxin were used at 1 and 10 μm, respectively (Sigma-Aldrich). Bicuculline was used at 50–100 μm, APV was used at 10 μm, and (αR,βS)-α-(4-hydroxyphenyl)-β-methyl-4-(phenylmethyl)-1-piperidinepropanol maleate (Ro25-6981) was used at 1–2 μm (Tocris Bioscience). All data were collected at 5 kHz and filtered at 1 kHz; events were detected in Clampfit 9.2 (Molecular Devices). Event analysis and statistics were performed using Matlab (The MathWorks) and Clampfit software (Molecular Devices). Decay time was calculated as the time from peak amplitude of the current to 30% of the peak amplitude.
Whole-cell recording from HEK-293 cells.
Electrophysiological recordings were performed 1–2 d after transfection. Once whole-cell-recording configuration was obtained, NMDA plus glycine was applied several times for 5 s periods separated by ∼25 s recovery intervals. Rapid agonist application was achieved by placing cells in a laminar solution stream that was delivered from a multibarrel array fed by gravity. Currents activated by NMDA (300 μm) in the presence of glycine (10 μm) were recorded in the whole-cell mode at a holding potential of −60 mV, filtered at 2 Hz, and digitized on-line at 1 kHz. Importantly, we did not observe an increase in desensitization during the few minutes of recording. Electrodes with open-tip resistances of 2–5 MΩ were used. Data were acquired and analyzed using pClamp 9 software and AxoPatch-1D amplifier (Molecular Devices). The internal pipette solution was composed of the following (in mm): 145 KCl, 4 Mg-ATP, 10 HEPES, and 5.5 EGTA, adjusted to pH 7.25 with KOH. External solution contained the following (in mm): 145 NaCl, 5.4 KCl, 2 CaCl2, 11 glucose, and 10 HEPES, adjusted to pH 7.3 with NaOH.
Cultured neuron biotinylation.
After treatment with clustered ephrin-B2-Fc or Fc control, cortical neuron cultures were placed on ice and rinsed twice with ice-cold rinsing solution (PBS, pH 7.5, containing 0.1 mm CaCl2 and 1 mm MgCl2). Clustering of ephrin-B2-Fc and human-Fc control proteins (R&D Systems) was achieved by incubation with anti-human IgG (Jackson ImmunoResearch) using methods described previously (Dalva et al., 2000). Cells were incubated in rinsing solution containing 1 mg/ml Sulfo-NHS-SS-Biotin (Pierce Protein Research Products; Thermo Fisher Scientific) with gentle agitation at 4°C for 30 min. Cells were then washed in quenching solution (rinsing solution with 100 mm glycine) and incubated in this solution with gentle agitation at 4°C for 30 min to quench unbound biotin. Cells were washed in rinsing solution, and then agitated at 4°C for 60 min using radioimmunoprecipitation assay (RIPA) buffer containing protease inhibitors for cell lysis. Cell lysates were harvested and centrifuged at 13,000 rpm for 20 min at 4°C. Aliquots were taken for total lysate fraction, for Bradford protein assay analysis (Bio-Rad), and for incubation with monomeric avidin agarose (Pierce Protein Research Products; Thermo Fisher Scientific) at 25°C for 60 min. After incubation, lysates were centrifuged at 13,000 rpm for 15 min, and the supernatant (intracellular fraction) was removed. The 4× sample solubilizing buffer was added to the total and intracellular fractions. Avidin beads were then washed three times with RIPA buffer, before incubation in 2× solubilizing buffer at 37°C for 30 min. Samples were then centrifuged for 5 min at 14,000 rpm, and the supernatant (surface fraction) was extracted. Five to 10 μg of surface and total lysate fraction were subjected to SDS-PAGE and Western blot analysis. Experiments were excluded from additional analysis if Western blots of the biotinylated fractions were positive for the cytosolic protein β-actin. Band intensities were quantified by densitometric analysis using NIH ImageJ software, and comparisons were made between total and biotin labeled fractions.
Biotinylation assay for surface NMDARs from slices.
Hippocampal or cortical slices were prepared from postnatal day 21 (P21) to P28 mice of either sex. After washing twice in ice-cold ACSF, slices were incubated in 1 mg/ml NHS-SS-biotin (Pierce) for 30 min at 4°C to biotinylate surface proteins as described previously (Huang et al., 2009). After removing nonspecifically bound NHS-SS-biotin, the tissue was homogenized and sonicated in PBS-based lysis buffer containing proteinase and phosphatase inhibitors (in mm: 1 EDTA, 1 EGTA, and 1% Triton X-100, 0.1% SDS, pH 7.4), followed by end-to-end rotating for 30 min at 4°C. After centrifugation at 13,000 rpm for 30 min at 4°C, the supernatant was incubated with Neutravidin beads (Thermo Fisher Scientific) to capture biotinylated surface proteins. After washing three times with lysis buffer, the surface proteins were eluted with protein sample buffer containing DTT and subjected to Western blotting. Membranes were probed with polyclonal anti-NR2A (1:1000; Millipore), with monoclonal anti-NR2B (1:2000; Millipore), monoclonal anti-NR1 (1:2000; 54.1; a generous gift from J. Morrison, Mount Sinai School of Medicine, New York, NY), and with anti-β-actin (1:5000; Sigma-Aldrich). Samples with actin labeling in the surface fraction were excluded from additional analysis. Membranes were stripped with Restore reagent (Thermo Fisher Scientific) to reprobe the membranes with a different antibody. Band intensities were quantified by densitometric analysis using NIH ImageJ software.
Synaptosome preparation.
This protocol was adapted from previous work (Blackstone et al., 1992; Lau et al., 1996). Briefly, whole brains from male and female P30 wild type (WT), EphB double knock-out (DKO), and triple knock-out (TKO) mice were homogenized in HEPES-buffered sucrose [0.32 m sucrose, 4 mm HEPES, pH 7.4, and protease inhibitor mixture (Sigma-Aldrich)]. The nuclear fraction was removed from the homogenate by centrifugation at 1000 × g for 15 min. The resulting supernatant (S1) was then centrifuged at 10,000 × g for 15 min to yield the crude membrane fraction (P1). The P1 pellet was resuspended in 10 vol of HEPES-buffered sucrose and spun again at 10,000 × g for 15 min to yield washed crude synaptosomal fraction (P2). The P2 fraction was layered onto 4 ml of 1.2 m sucrose containing protease inhibitors (Sigma-Aldrich) and centrifuged at 230,000 × g for 15 min. The interface was collected and diluted into final volume of 6 ml with HEPES-buffered 0.32 m sucrose and layered onto 0.8 m sucrose containing protease inhibitors. The sample was centrifuged at 230,000 × g for 15 min to obtain a pure synaptosomal (Syn) pellet. The intensities of glutamate receptors from each fraction were determined by densitometric analysis using ImageJ software. The raw intensities were then normalized to actin intensities in each fraction. The relative levels of synaptic versus membrane-associated glutamate receptors were calculated by taking a ratio of normalized synaptic fraction values (Syn) to normalized crude membrane fraction values (P1). Statistical significance was assessed by ANOVA.
Results
Early in development, the EphB receptor couples filopodia motility to synaptogenesis (Kayser et al., 2008). As neurons and synapses mature, EphB is no longer required to maintain normal numbers of established synapses (Kayser et al., 2008). However, EphB2 is still highly expressed in the adult nervous system (Bouvier et al., 2008), suggesting that it likely has an active role in mature neurons. We examined the impact of EphB2 on NMDAR surface and synaptic localization in the mature nervous system. We used an shRNA that targets EphB2 and has been extensively characterized previously in the following ways: (1) it has no detectable effects on neurons from EphB1-3 triple knock-out mice; (2) it causes selective inhibition of EphB2-dependent synapse formation; (3) it knocks down EphB2 expression with high efficacy in neurons and non-neuronal cells; and (4) the effects of expressing it can be reversed with expression of EphB2 constructs rendered insensitive to the shRNA by the introduction of silent mutations (Kayser et al., 2006, 2008). Previous work using this shRNA has shown that knockdown of EphB2 in cortical neurons at either 3 or 10 DIV leads to a robust decrease in synapse number at 21 DIV, whereas later knockdown of EphB2 from 14–21 or 14–24 DIV has no effect on synapse number (Kayser et al., 2008). Importantly, knockdown at each of these times leads to similar decreases in EphB2 expression.
To selectively determine how changes in EphB2 expression later in neuronal development affect NMDAR localization in mature neurons, we first used immunohistochemical methods in cultured cortical neurons. Neurons were transfected with enhanced green fluorescent protein (eGFP) and shRNA vector (control), EphB2.1 shRNA, or EphB2.1 shRNA with rescue at 14 DIV. We rescued EphB2 knockdown with a shRNA-insensitive EphB2 construct—an approach that generates functional overexpression (McClelland et al., 2009, 2010). We used this approach to control the amount of EphB2 expressed in neurons. At 21 DIV, neurons were processed to determine the amount of NR1 labeling at synapses. In these experiments, we focused on NR1 immunolabeling because (1) this subunit is present in all NMDARs (Cull-Candy and Leszkiewicz, 2004), (2) EphB directly binds NR1 through an interaction involving extracellular domains (Dalva et al., 2000), and (3) the anti-NR1 antibody most reliably colocalizes with other presynaptic and postsynaptic marker proteins (data not shown). Synapses were defined as locations where NR1 puncta (red) colocalized with GFP-positive dendrites (green) within <1 μm of anti-vGlut1-positive puncta (blue) (Fig. 1A–C). We determined the size and intensity of NMDAR staining at each synapse. Although there were no effects on the size of the NMDAR puncta, functional overexpression and knockdown of EphB2 did alter the amount of NMDAR localized at synapses as measured by the normalized intensity of synaptic puncta. We plotted the cumulative probability distribution of the amount of NMDAR staining at synaptic sites and found that knockdown of endogenous EphB2 caused a decrease in the amount of NR1 at synapses, whereas functional overexpression of EphB2 in the context of EphB2 knockdown resulted in a marked increase in synaptic NR1 (Fig. 1D) [Kolmogorov–Smirnov (K-S) test, p < 0.001]. More specifically, EphB2 knockdown caused a preferential reduction in the number of synapses with large amounts of NR1. Conversely, functional overexpression of EphB2 resulted in a preferential increase in the number of synapses with smaller amounts of NR1. We next determined whether there were any differences between the effects of EphB2 manipulation on shaft and spine synapses. Analysis revealed that EphB2 knockdown or overexpression resulted in similar changes in the amount of NMDAR content at both shaft and spine synapses (Fig. 1E,F) (K-S test, p < 0.001). Consistent with the role of EphB2 in control of dendritic spine shape in mature neurons, changes in the amount of NR1 at spine synapses were larger after EphB2 overexpression than the changes seen at shaft synapses. Together, these results suggest a role for EphB2 in directing or maintaining NMDARs at mature synapses.
Figure 1.

EphB2 regulates localization of NMDAR receptors to synapses in mature cortical neurons. A–C, Confocal microscopy maximum projection images of cultured cortical neurons at 21 DIV expressing eGFP and shRNA vector (control), EphB2.1 shRNA, or EphB2.1 shRNA plus “rescue” EphB2 (functional EphB2 OE), immunostained for GFP (green), NR1 (red), and the presynaptic marker vGlut (blue). The magnified sections (top) of high-contrast image with arrows show spine (yellow arrows) and shaft (white arrows) synapses, defined as the locations where NR1, GFP, and vGlut immunostaining colocalize. The bottom panels show same region with anti-NR1 staining in red. D–F, Cumulative probability histograms of synaptic NR1, NR1 at spine synapses, and NR1 at shaft synapses. Functional EphB2 OE using a rescue construct in the context of endogenous EphB2 knockdown caused a significant increase in the amount of NR1 colocalizing with vGlut, whereas knockdown of EphB2 resulted in a decrease (Kolmogorov–Smirnov test, p < 0.001). Amount of NR1 for each condition is normalized to the maximum intensity observed from all three conditions. Control, n = 27 cells, 432 synapses; EphB2.1 shRNA, n = 27, 359; functional EphB2 OE, n = 21, 319.
To examine the functional significance of these immunohistochemical findings, we next measured spontaneous miniature EPSC (mEPSC) frequency in cultured cortical neurons at 21 DIV after endogenous EphB2 knockdown with or without expression of our EphB2 rescue construct at 14 DIV. As expected from previous work (Kayser et al., 2008), knockdown or functional overexpression of EphB2 at 14–21 DIV resulted in no change in mEPSC frequency (Fig. 2A,C), confirming that EphBs are not likely to be important for the maintenance of overall excitatory synapse number in mature neurons. To determine whether modulation of EphB2 expression levels impacts synaptic receptor content, we studied mEPSC amplitude. To isolate glutamatergic mEPSCs, whole-cell patch-clamp recordings were conducted in Mg2+-free solutions to increase NMDAR-mediated currents in the presence of tetrodotoxin and blockers of GABAergic channels (see Materials and Methods). Although neither knockdown nor functional overexpression of EphB2 changed excitatory synapse number, functional overexpression of EphB2 did result in a significant increase in mEPSC amplitude (Fig. 2B,D,E) (control, −15.45 ± 0.14 pA; EphB2, −22.79 ± 0.37; K-S test, p < 0.001). Similar changes in mEPSC amplitude were found in an independent series of experiments in which we overexpressed wild-type EphB2 without knockdown, in the presence of the endogenous protein (Fig. 3). The small size of the NMDAR-dependent component of mEPSCs in cultured neurons (2–3 pA) prevents reliable isolation of this current alone. Therefore, to examine whether EphB-dependent changes in mEPSC amplitude are attributable to increased recruitment of NMDARs to synapses, we recorded from neurons in the presence or absence of the NMDAR antagonist APV (50–100 μm), applied via the bath perfusate. We found that NMDAR blockade significantly reduced mEPSC amplitude in all conditions (control, EphB2.1 shRNA, or functional EphB2 overexpression). To estimate the average NMDAR component of the mEPSC, we measured the difference between mean mEPSC amplitude before and after APV blockade. The estimated NMDAR component was ∼60% larger than control when EphB2 was functionally overexpressed [control, 3.13 pA; EphB2 overexpression (OE), 4.98 pA] (Fig. 2B,D), indicating that the level of EphB2 expression might determine the amount of NMDARs at synapses. These findings were confirmed by cumulative probability histograms of mEPSC amplitude demonstrating that functional overexpression of EphB2 results in an increase in the NMDAR-dependent component of mEPSCs (Fig. 2E). Functional overexpression of EphB2 also appeared to increase the AMPAR-dependent component of mEPSCs, assessed by measuring mEPSCs in the presence of APV for all three conditions. These findings are consistent with previous work showing that EphB2 can regulate AMPAR retention in the recycling pool through its PDZ binding domain (Kayser et al., 2006). Although there appears to be a change in the AMPAR component, we focused on the role of EphB2 in the regulation of the NMDAR in this study because of the importance of this interaction in human disease (Cissé et al., 2011).
Figure 2.

EphB2 expression regulates mEPSC amplitude but not frequency in mature cortical neurons. Whole-cell patch-clamp recordings were made from 21–23 DIV cultured rat cortical neurons expressing eGFP and shRNAi vector (control; blue), EphB2 shRNA (EphB2.1 shRNA; red), or EphB2.1 shRNA plus “rescue” EphB2 (functional EphB2 OE; green). Recordings were at −65 mV in Mg2+-free solution. A, Example whole-cell patch-clamp recordings from cortical neurons in each condition; functional EphB2 OE neurons (row 3) show occasional miniature synaptic events at higher amplitude (left) that are blocked by the NMDAR antagonist APV (right). B, Mean traces of mEPSCs after NMDAR blockade with APV. Control: n = 5 cells without APV, 2298 mEPSCs; n = 5 cells with APV, 2490 mEPSCs; EphB2 shRNA: n = 5 cells without APV, 2528 mEPSCs; n = 5 cells with APV, 2040 mEPSCs. Functional EphB2 OE: n = 3 cells without APV, 1037 mEPSCs; n = 3 cells with APV, 1052 mEPSCs. C, No change in mEPSC frequency was observed for any condition (ANOVA, p > 0.05). D, Quantification of mean mEPSC amplitude before and after application of 50–100 μm APV. An increase in mEPSC amplitude was observed with functional overexpression of EphB2, whereas NMDAR blockade with APV significantly reduced mEPSC amplitude for all conditions (ANOVA, *p < 0.01, **p < 0.001). E, Cumulative probability histograms of mEPSC amplitude for each condition. Error bars indicate SEM.
Figure 3.
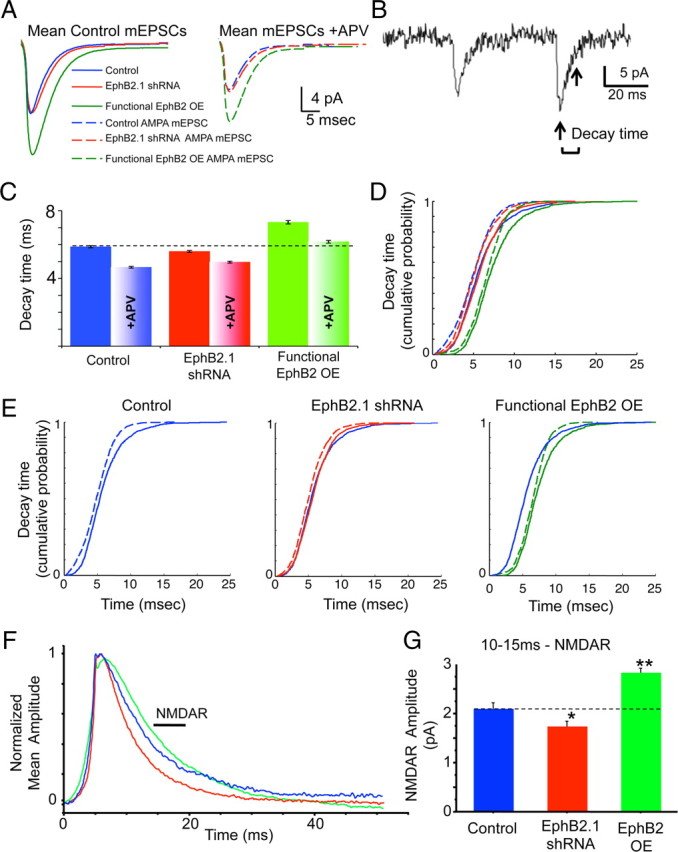
EphB2 regulates synaptic localization of functional NMDARs in mature cortical neurons. Whole-cell patch-clamp recordings were made from 21–23 DIV cultured rat cortical neurons expressing eGFP and shRNA vector (control; blue), EphB2 shRNA (EphB2.1 shRNA; red), or EphB2 shRNA plus “rescue” EphB2 (functional EphB2 OE; green) (A–E). A, Mean traces of EPSCs for each condition. B, Sample trace of whole-cell patch-clamp recording illustrating decay time. Decay time was calculated as the time from peak amplitude of the current to 30% of the peak amplitude, indicated by the arrows. C, Quantification of average decay time for each condition. D, E, Cumulative probability histograms of mEPSC decay times for each condition, plotted together (D) and individually for clarity (E). Control/EphB2.1 shRNA, p < 0.05; EphB2.1 shRNA/functional EphB2 OE, p < 0.0001; without APV/with APV, p < 0.0001 for all conditions; control with APV/functional EphB2 OE with APV, p < 0.0001; EphB2.1 shRNA with APV/functional EphB2 OE with APV, p < 0.0001; K-S tests; N as in Figure 1. These findings indicate that the slow NMDAR component of mEPSCs is reduced by EphB2 knockdown (EphB2.1 shRNA) and increased when EphB2 is functionally overexpressed (EphB2.1 shRNA plus “rescue” EphB2). F, Whole-cell patch-clamp recordings were made from 21–23 DIV cultured rat cortical neurons expressing eGFP and vector (control; blue), EphB2.1 shRNA (red), or EphB2 (EphB2 OE; green). Normalized amplitude plot of the mean mEPSCs recorded at +50 mV in control, EphB2 shRNA, and EphB2 OE neurons. G, Quantification of NMDAR component of the mEPSCs recorded at +50 mV in the presence of Mg2+ (control, n = 368 events/6 cells; EphB2 shRNAi, n = 744/11; EphB2 OE, n = 1247/9). *p < 0.05, **p < 0.001, ANOVA. Error bars indicate SEM.
NMDARs contribute significantly to the decay component of synaptic currents, and thus measuring changes in these currents provides a sensitive measure for the presence of these channels at synapses. We found that, compared with controls, the average decay time (from peak to 30% amplitude) in neurons where EphB2 was functionally overexpressed was significantly longer, whereas knockdown of EphB2 resulted in a significant shortening of the average decay time. After blocking NMDARs with the antagonist APV, significantly shorter decay times were seen for all conditions (Fig. 3C) (control, 5.88 ± 0.06 ms; control plus APV, 4.66 ± 0.05; EphB2.1 shRNA, 5.60 ± 0.06; EphB2.1 plus APV, 4.96 ± 0.06; functional EphB2 OE, 7.32 ± 0.10; functional EphB2 OE plus APV, 6.17 ± 0.08; ANOVA, p < 0.001). To further examine these data, we plotted cumulative probability distributions of the decay times for mEPSCs in control, knockdown, and functional overexpression conditions that represent all the measured decay times in our data set (Fig. 3D,E). We found that before blocking NMDARs with the antagonist APV, control and EphB2-overexpressing cells exhibit a larger proportion of mEPSCs with longer decay times, whereas EphB2 knockdown substantially reduces the fraction of events with longer decay times (Fig. 3C–E). Specifically, in neurons expressing EphB2 shRNA, ∼5% of events have decay times of >10 ms; in control neurons, ∼10% fall into this group; in neurons overexpressing EphB2, ∼15% of events have decay times of >10 ms (Fig. 3D,E). The difference between decay times in the control and EphB2 knockdown conditions were mostly eliminated by pharmacologic NMDAR blockade. Interestingly, the decay times of mEPSCs recorded from neurons functionally overexpressing EphB2 were longer than those of events in control or EphB2 knockdown neurons even in the presence of NMDAR blockade. These effects are most consistent with a change in AMPAR subunit composition at synapses, although additional work will be needed to determine whether this is the case. Regardless, our findings indicate that EphB2 expression levels might bidirectionally modulate the synaptic localization of NMDARs.
To further examine the role of EphB2 in the control of NMDAR trafficking, we recorded from neurons held at +50 mV to remove Mg2+ voltage-dependent blockade of the NMDAR. In these experiments, we overexpressed EphB2 alone, without expression of shRNAs targeting EphB2. Consistent with our findings from functional overexpression of EphB2 in the presence of EphB2 shRNA (Fig. 2), overexpression of EphB2 without knockdown resulted in a significant increase in mEPSC amplitude, whereas knockdown resulted in a reduction in mEPSC amplitude (control, 12.35 ± 0.23 pA, n = 957 events/9 neurons; EphB2 shRNA, 11.53 ± 0.19 pA, n = 1189/11; EphB2 OE, 15.44 ± 0.29 pA, n = 795/5; ANOVA, p < 0.01). To isolate the NMDAR component, neurons were held at +50 mV in the presence of TTX (1 μm), bicuculline (50 μm), and picrotoxin (10 μm). Using established methods (Myme et al., 2003), we examined the NMDAR component of mEPSCs by taking the average current 10–15 ms after the initial rise phase of each mEPSC (a time when the AMPAR-dependent current has already decayed). We found that knockdown of EphB2 resulted in a significant decrease in the NMDAR-dependent component of the mEPSCs, whereas overexpression of EphB2 resulted in a significant increase (Fig. 3F,G) (control, 2.09 ± 0.13 pA, n = 368 events/6 cells; EphB2 shRNAi, 1.74 ± 0.11 pA, n = 744/11; OE, 2.83 ± 0.08 pA, n = 1247/9; ANOVA, p < 0.01). To test whether the effects of EphB2 overexpression might be linked to the recruitment of a specific NMDAR subunit, we treated neurons with an NR2B-selective NMDA receptor antagonist, Ro25-6981 (1–2 μm), and measured the percentage change in mEPSC amplitude. The NMDAR-dependent component of mEPSCs was reduced significantly (∼25%) by the selective antagonist in neurons transfected with EphB2 compared with control transfected neurons (control, n = 5 cells; EphB2 OE, n = 5 cells; ANOVA, p < 0.03) (data not shown), suggesting that EphB2 overexpression increases the amount of NR2B-containing NMDARs found at synapses. We also conducted analysis of the decay times of mEPSCs recorded at +50 mV. Consistent with the effects observed at −65 mV, we found that EphB2 knockdown reduces the decay time, whereas overexpression of EphB2 causes a marked increase in the decay time of mEPSCs (control, 6.36 ± 0.19; EphB2.1 shRNA, 5.52 ± 0.14; EphB2 OE, 7.35 ± 0.16; ANOVA, p < 0.001) (data not shown). Together, our experiments demonstrate that, in mature neurons, EphB2 expression levels regulate the localization of NMDARs at synapses and their contribution to synaptic currents.
We investigated whether EphB signaling might modulate NMDAR function and localization in a subunit-specific manner. Activation of endogenous EphB receptors with soluble ephrin-B ligand results in an interaction between EphBs and NMDARs, followed by phosphorylation of the NR2B subunit and increased NMDAR-dependent Ca2+ influx (Takasu et al., 2002). The mechanism through which this increased calcium influx occurs is unknown. To both test whether this functional modification is subunit specific and determine the underlying mechanism, we coexpressed EphB2 with NR1-1a and either NR2A or NR2B subunits in HEK-293 cells (Zukin and Bennett, 1995). We examined whether the EphB–NMDAR interaction specifically alters NMDAR channel function by recording NMDA-evoked currents from transfected HEK-293 cells using the whole-cell patch-clamp method described in detail previously (Zheng et al., 1997; Skeberdis et al., 2006). Briefly, in control cells held at −60 mV, application of NMDA (300 μm) with glycine (10 μm) for 5 s by laminar flow elicited an inward current that rapidly declined to a steady-state value (Zorumski et al., 1989; Legendre et al., 1993; Tong et al., 1995; Zheng et al., 1997; Skeberdis et al., 2006). Measurements were made from the average of two to three trials per cell. In cells transfected with EphB2, NR1-1a, and NR2B, the peak amplitude was not significantly altered but the desensitization/inactivation in the NMDA response was greatly reduced (Fig. 4A). These effects required EphB kinase activity, as NMDAR currents in HEK-293 cells cotransfected with a kinase-dead form of EphB2 were normal. The absence of an effect with the kinase-dead mutant is not simply attributable to a disrupted interaction between EphB and NMDARs, as previous work has shown this mutant and the NMDAR still interact through their extracellular domains (Dalva et al., 2000). In cells transfected with EphB2, NR1-1a, and NR2A, we found no significant difference in NMDA-evoked currents compared with control cells transfected with only NR1 and NR2A (Fig. 4B). These results suggest that EphB2 preferentially modulates desensitization/inactivation of NMDARs containing NR2B subunits, and that the enhanced Ca2+ influx through NMDARs occurs by altering the kinetics of the channel in a kinase-dependent manner.
Figure 4.

EphB2 attenuates Ca2+-dependent desensitization of NR2B- but not NR2A-containing NMDARs. A, Top, NMDA-elicited currents recorded from HEK-293 cells expressing NR1-1a/NR2B receptors in the absence (left) or presence of EphB2 (center), or the kinase-dead mutant EphB2-KD (right). Recordings at −60 mV in Mg2+-free solution. Bottom, Summary data showing peak current, steady-state current, and Ca2+-dependent desensitization of NMDA current (quantified as 1 − steady-state current/peak current × 100) (n = 8, 9, and 7 for cells in the absence of cotransfected EphB2, presence of EphB2, or EphB2-KD, respectively). B, Top, NMDA-elicited currents recorded from HEK-293 cells expressing NR1-1a/NR2A receptors in the absence (left) or presence (right) of EphB2. Bottom, Summary data showing peak current, steady-state current, and Ca2+-dependent desensitization of NMDA current [n = 10 and 8 cells (3 independent experiments) in the absence or presence of EphB2, respectively]. *p < 0.05, **p < 0.01. Error bars indicate SEM.
Activation of EphBs results in phosphorylation of the NR2B subunit at Y1472 (Takasu et al., 2002), which in turn controls the internalization and localization of NR2B-containing NMDARs (Lavezzari et al., 2003; Prybylowski et al., 2005; Chen and Roche, 2007). Given the subunit-specific modulation of Ca2+ desensitization/inactivation in NR2B-containing NMDARs by EphB2, we examined whether EphB2 activation might preferentially control NR2B surface localization. We studied NMDAR subunit trafficking/localization with surface biotinylation experiments in cultured cortical neurons after treatment with control or activated ephrin-B2 at different times during development. Biotinylated surface proteins were pulled down and the fraction of the total protein labeled with biotin determined by Western blot analysis. Only samples lacking detectable actin in the biotinylated fraction were included for additional analysis. We conducted these experiments at 7, 14, and 21 DIV—times when cultured cortical neurons have just entered a period of rapid EphB-dependent synapse addition (7 DIV), just ended the period of rapid synapse addition (14 DIV), or when synapses have matured (21 DIV) (Kayser et al., 2008). At each time point, NR2B was found on the cell surface under control conditions (Fig. 5). We then asked whether 45 min to 1 h of ephrin-B2 treatment might alter the surface localization of the NMDAR. We compared the fraction of total NR2B with biotin before and after ephrin-B2 treatment. At 7 DIV, ephrin-B2 treatment failed to induce a significant increase in the surface localization of NR2B. In contrast, at 14 and 21 DIV, when EphB is no longer required for synapse addition or to maintain normal numbers of functional synapses, ephrin-B2 treatment induced a significant increase in NR2B surface expression (Fig. 5). These results show that activation of EphB2 increases NR2B on the cell surface of neurons and confirm that EphB2 undergoes an age-dependent change in the control of NR2B trafficking.
Figure 5.

Ephrin-B2 activation of EphB2 increases NR2B surface localization. A–C, Cortical neurons at 7 DIV (A), 14 DIV (B), or 21 DIV (C) were treated for 45 min with control Fc (C) or activated ephrin-B2-Fc (eB2). Biotinylated (surface) and total NR2B protein was visualized by immunoblotting with specific antibodies (top gels). β-Actin was used as a loading control for total protein (bottom gels). Absence of actin in surface (biotinylated) gels indicates validity of surface labeling. Representative immunoblots show no actin immunolabeling in the biotinylated surface fraction. The bottom bar graphs show the ratio of amount of surface NR2B to total NR2B at 7 DIV (n = 5 experiments), 14 DIV (n = 6 experiments), or 21 DIV (n = 6 experiments). Ephrin-B2-Fc versus Fc (control) conditions were analyzed by an unpaired t test. *p < 0.05. Error bars indicate SEM.
To determine whether EphB also controls the localization of specific NMDAR subunits in organized neural tissue, we examined the surface expression of the NMDAR in acute brain slices from TKO mice lacking EphB1–3. We chose to examine TKO animals because the presence of any EphB family members often masks the effects of genetic loss of one or two EphBs (Henkemeyer et al., 2003; Kayser et al., 2006). Indeed, throughout our experiments, we failed to detect effects on NMDAR localization in DKO mice lacking EphB1 and 3, which maintain normal EphB2 function (Figs. 6–9). To investigate if the trafficking and localization of NMDARs is disrupted after the loss of EphB expression, we made hippocampal or cortical brain slices from wild-type, DKO, or TKO mice. The brain slices were then incubated live with Sulfo-NHS-SS-biotin (Pierce Protein Research Products; Thermo Fisher Scientific) on ice, and tissue was processed to determine the surface fraction of the NMDAR using methods similar to those for the cultured cortical neurons.
Figure 6.

Surface and total NR2B expression levels are increased in the cortex of EphB1−/−, 2−/−, 3−/− TKO mice. A, Representative Western blots depicting NR2A and NR2B surface expression (left) and total expression (right) in WT, EphB1−/−, 3−/− DKO, and TKO mice. B–D, Quantification of NR2A surface, total, and surface/total expression. E–G, Quantification of NR2B surface, total, and surface/total expression. Values were normalized to DKO (n = 6, 9, and 7 animals for WT, DKO, and TKO, respectively). *p < 0.05, **p < 0.01. Error bars indicate SEM.
Figure 7.

NR2B surface expression is increased and total NR2A levels are decreased in the hippocampus of TKO mice. A, Left, Representative Western blots depicting NR2A and NR2B surface expression in WT, EphB DKO, and EphB TKO mice. Right, Western blots showing total expression of NR2A and NR2B in WT, EphB DKO, and EphB TKO mice. Actin was used as a loading control in total protein fraction and as a control for surface staining in surface fraction. B, Quantification of NR2A and NR2B surface, total, and surface/total expression. Values are normalized to DKO (n = 6, 9, and 7 animals for WT, DKO, and TKO, respectively). *p < 0.05, **p < 0.01, ANOVA. Error bars indicate SEM.
Figure 8.

NR1 surface expression is decreased in hippocampus of TKO mice. Top left, Western blot illustrating surface and total NR1 expression in cortex of WT, EphB DKO, and EphB TKO mice. Top right, Western blot depicting surface and total NR1 levels in hippocampus of WT, EphB DKO, and EphB TKO mice. Actin is shown as a loading control in total protein fraction and as a control for surface staining in surface fraction. Below, Quantification of NR1 surface, total, and surface/total levels in cortex and hippocampus of WT, EphB DKO, and EphB TKO mice. Values are normalized to WT (n = 2 animals each for WT, DKO, and TKO, samples were then divided and labeled with two independent reactions). *p < 0.05, ANOVA. Error bars indicate SEM.
Figure 9.

EphB TKO brains exhibit reduced synaptic expression of NR2A and NR2B. A, Lysates from brains of WT, EphB DKO, and EphB TKO animals were fractionated to isolate supernatant (S1), crude membrane (P1), and pure synaptosome (Syn) fractions. Western blots were probed with indicated antibodies and show enrichment of glutamate receptor subunits in the synaptosome fraction of all animals. PSD-95 and EphB2 are enriched in the same fraction. B–E, Syn/P1 ratio was used to compare synaptic versus nonsynaptic expression of NMDA and GluR2 glutamate receptors subunits. Compared with the WT and EphB DKO brains, EphB TKO animals exhibit reduced synaptic expression of NR2A (C) and NR2B (D) subunits of the NMDAR. There is no change in synaptic expression the GluR2 subunit (E) of AMPA receptors between different genotypes. ANOVA, *p < 0.005; n = 3 animals for each condition. Error bars indicate SEM.
Cortical and hippocampal brain slices were collected and labeled in parallel. Surprisingly, surface and total expression of the NR2B subunit of the NMDAR was increased significantly in TKO mice compared with controls (Fig. 6A,E–G). NR2A and NR1 expression were unchanged in cortex in the absence of EphBs, although the variability in this data set was large for NR1 (Figs. 6A–D, 8). These findings were not mirrored in hippocampus, where total NR2A levels were reduced and surface NR2B increased in TKO compared with WT (Fig. 7); surface levels of NR1 were also significantly reduced in hippocampus of TKO mice (Fig. 8). These effects suggest that the role of EphBs may differ between different brain regions and that the interaction between EphBs and NMDARs is more complex than simple recruitment or retention of NMDARs on the cell surface, in which case we would expect NR2B surface localization to be decreased in the absence of EphBs.
One possible explanation for the paradoxical increase in NR2B total and surface expression in the absence EphBs is that homeostatic mechanisms lead to upregulated expression and surface delivery because of a specific deficiency of NR2B at synapses. EphBs are localized to the postsynaptic complex at mature synapses, and we have shown that increased expression or activation of EphB2 increases the amount of NR2B on the cell surface and NMDARs at the synapse in vitro (Figs. 1–3). Thus, we tested whether EphBs might help to direct NMDARs to synaptic sites in vivo. Using fractionation experiments, we compared the normalized amount of NMDAR found in the crude membrane fraction (P1) and at synaptosomes (Syn) from EphB DKO, TKO, and control WT mice by quantifying the amount of specific proteins by Western blot. The P1 fraction is enriched for all membranes, whereas the synaptosomal fraction is enriched for synaptic components. As expected, synaptic proteins such as NR1, GluR1, PSD-95, and EphB2 were enriched in the Syn versus the P1 fraction from WT mice (Fig. 9A). We then asked whether loss of the EphB proteins would disrupt the synaptic localization of the NMDAR. In the DKO mice lacking EphB1 and 3, NR2B expression and synaptic localization did not differ from wild-type animals, and we did not detect changes in the other synaptic proteins examined. However, TKO brains showed a significant decrease in the fraction of NR2B subunits at synapses (Fig. 9A,D). Interestingly, there was also reduced localization of NR2A subunits at synapses in TKO brains (Fig. 9A,C). Consistent with the direct nature of the EphB–NMDAR interaction, the loss of EphBs did not alter the localization of other synaptic components such as PSD-95 and GluR2 (Fig. 9A,E). Together with the biotinylation experiments, these findings suggest that EphBs direct the NR2B subunit to synaptic sites, and in the absence of EphBs, neurons unsuccessfully attempt to compensate, resulting in increased overall expression and nonsynaptic surface expression of the NR2B subunit.
Discussion
Multiple mechanisms contribute to the tightly regulated yet dynamic control of NMDAR trafficking. Here, we provide evidence that the EphB2 receptor tyrosine kinase is also an important regulator of synaptic NMDAR localization, but preferentially at mature contacts. Our results indicate that expression levels of EphB2 in mature cells can determine NMDAR content at synapses without impacting synapse number. We also find that EphB2 kinase activity specifically reduces the temporal decline of the NR2B subunit-mediated currents, resulting in prolonged currents and increased Ca2+ influx. In the absence of EphBs, total NR2B abundance and surface NR2B expression is increased, whereas synaptic expression is decreased, indicating mistargeting of this subunit without EphB signaling. These findings extend previous work demonstrating that EphB2 binds, clusters, and increases Ca2+ flux through NMDARs in young neurons (Dalva et al., 2000; Takasu et al., 2002), and suggest that the EphB–NMDAR interaction is significant throughout multiple phases of development and particularly in the mature brain.
We find an age-dependent change in how EphBs modulate NMDAR activity. Early in development, EphBs are essential for the formation of normal numbers of excitatory synaptic connections made on dendritic spines (Kayser et al., 2008). During this time period, activation of EphB does not appear to increase recruitment of NR2B subunits to the cell surface. As neurons mature, EphBs are no longer required to maintain normal numbers of functional excitatory synapses but function to control the number of NMDARs localized to synaptic sites. These results begin to answer the question posed by in vitro work indicating distinct mechanisms of NMDAR recruitment at differing neuronal ages (Washbourne et al., 2002; Bresler et al., 2004). Moreover, our data indicate that EphB specifically regulates trafficking of NR2B subunits in mature neurons, although our results do not exclude the possibility that EphBs play some role in NR1 and NR2A localization as well. Localization of the NR2B subunit of the NMDAR is of particular interest, as the proportion of NR2B-containing receptors can affect NMDAR channel open time and Ca2+ flux. Recent work has shown that phosphorylation of NR2B by casein kinase 2 (CK2) at a distinct site from EphB-dependent phosphorylation leads to NR2B endocytosis and increased NR2A expression (Sanz-Clemente et al., 2010). The interplay between CK2 and EphB2 activity on NR2B, leading to endocytosis or retention, respectively, would be a sensitive mechanism for determining NR2B content at synapses. Functional consequences of increased NR2B content at synapses in certain areas of brain are known to include improved performance on memory tasks and enhanced visuocortical plasticity (Tang et al., 1999; Philpot et al., 2007). During normal development, the ratio of NR2A/NR2B at synapses increases over time (Sheng et al., 1994), raising the threshold for long-lasting changes in synaptic strength in response to external stimuli (Philpot et al., 2007). Given that EphBs serve to drive NR2B into synapses only later in development, one interpretation of our data is that EphBs define mature synapses with a relatively low NR2A/NR2B ratio. These inputs would remain more plastic in the adult brain, with a lower threshold for long-term potentiation (LTP). Consistent with this role for EphBs in maintaining or generating plastic synapses, EphB2 knock-out mice have reduced LTP, long-term depression (LTD), and quality of performance in the Morris water maze (Grunwald et al., 2001; Henderson et al., 2001). Although one feature of mature neurons by virtue of a higher NR2A/NR2B ratio is an increased selectivity for specific stimuli, it is clear that, even in the adult CNS, some inputs remain remarkably malleable (Holtmaat and Svoboda, 2009). Future work will need to specifically examine whether and how EphBs contribute to this sustained plasticity.
Two likely mechanisms mediating EphB-dependent control of synaptic localization of NMDARs are the direct EphB–NMDAR interaction and EphB-dependent phosphorylation of NR2B. We showed previously that ephrin-B activation of EphB2 results in the direct interaction of the NMDAR with EphB2 and the phosphorylation of three tyrosine residues on the NMDAR (Dalva et al., 2000; Takasu et al., 2002). One of the phosphorylated residues, Y1472, has since been shown to be important for the synaptic localization and retention of NMDARs, acting to prevent binding of AP-2 that in turn targets proteins for internalization by clathrin-mediated endocytosis (Lavezzari et al., 2003; Chen and Roche, 2007). Notably, there is a significant reduction in the level of NR2B phosphorylated at Y1472 found at synapses in EphB TKO brains compared with controls (data not shown). Although the magnitude of this change is matched by the decrease in total NR2B at synapses in TKOs, these data are consistent with a model in which EphB2 regulates retention of the NMDAR at synapses by phosphorylating the NR2B subunit at Y1472. In the absence of EphBs, more NR2B is endocytosed, triggering the homeostatic drive of neurons to deliver more NR2B to synapses. This drive appears to fail in the absence of EphBs, as NR2B total and surface expression increase without effective synaptic delivery. Thus, the EphB–NMDAR interaction likely has a role in synaptic targeting of NMDARs in addition to retention. The loss of EphBs also results in decreased NR2A at synapses. This effect could be attributable to the direct interaction between EphB2 and the NMDAR or to the previously described phosphorylation of the NR2A subunit. Importantly, we cannot rule out a role for the direct EphB–NMDAR interaction in the synaptic localization of the NMDAR. In fact, the EphB–NMDAR interaction is likely to be central to the ability of EphB2 to specifically phosphorylate NR2 subunits, making it difficult to distinguish effects of the physical interaction and kinase activation.
Although EphBs are important for the proper localization of NMDARs to synapses, they are not essential for all NMDARs to localize properly, nor for all facets of NR2B trafficking. These conclusions are consistent with the observation that EphBs direct formation of a subset of excitatory synapses (Kayser et al., 2006) and our new findings that EphBs control a substantial fraction (∼50%) of NMDAR localization to mature contacts. Although additional research is needed to characterize the significance of this subpopulation, loss of EphB2 causes abnormal LTP and LTD in mouse hippocampus (Grunwald et al., 2001; Henderson et al., 2001), suggesting a functionally important role. Other proteins are undoubtedly required in these events as well, however, and synaptic transmission still occurs. For example, neuroligins (NLGs) cluster NMDARs and signal to regulate excitatory synapse maturation (Graf et al., 2004; Chih et al., 2005); more recent work suggests that loss of NLG1 results in reduced NMDAR expression and NMDAR-mediated synaptic transmission in hippocampus (Chubykin et al., 2007). These findings are similar to those for EphBs and suggest that both EphBs and NLGs, and very likely others, impact NMDAR localization at synaptic sites.
In addition to the effects that we observe on NMDAR localization and function, our analysis of mEPSCs reveals a change in the AMPAR-dependent component of synaptic currents (Figs. 2, 3). This finding is consistent with previous work showing that EphB2 activation can increase the surface localization of the AMPAR via PDZ domain-dependent interactions (Irie et al., 2005; Kayser et al., 2006). However, our biotinylation and fractionation experiments in EphB TKO mice failed to detect changes in the localization of the GluR2 subunit of the AMPAR compared with controls. Thus, it appears possible that, although EphB2 overexpression results in increased AMPAR-dependent currents at synapses, mice lacking EphBs fail to show changes in the synaptic localization of GluR2. EphBs are therefore unlikely to regulate AMPAR function by simply controlling the overall amount of AMPARs at synapses. EphB2 associates with AMPAR-interacting proteins PICK1 and GRIP (Torres et al., 1998), which are important for trafficking of specific AMPAR subunits to synapses (Gardner et al., 2005; Liu and Cull-Candy, 2005). As with NMDARs, different AMPAR subunit combinations confer distinct channel properties (Greger and Esteban, 2007; Isaac et al., 2007). Thus, one interesting possibility is that the EphB2-dependent changes in AMPAR current we observe (Figs. 2, 3) are attributable to modulation of AMPAR subunit ratios at synapses rather than changes in overall AMPAR content. Additional work will be needed to determine the mechanisms by which EphBs regulate AMPAR synaptic currents.
In addition to their role in the localization of NMDARs, EphBs modulate NMDAR-mediated calcium flux through Src family kinase-dependent phosphorylation of NR2B. This enhanced calcium influx is likely mediated by a reduction in the rate of calcium-dependent inactivation in NMDAR channels that contain the NR2B subunit, although in our current analysis we cannot rule out a role for glycine-independent desensitization. Importantly, the effects of EphB2 appear selective for NR2B, as a similar change in time course is not found in NMDAR channels containing the NR2A subunit. Yet previous work has suggested that ephrin-B activation of EphB may increase tyrosine phosphorylation of not only NR2B subunits but also NR2A subunits (Grunwald et al., 2001; Takasu et al., 2002). The functional significance of EphB2/NR2A interactions has yet to be extensively examined, but given that EphB2 does bind to NR2A (Dalva et al., 2000), future investigation into whether EphBs modulate NR2A function will be of interest.
The expression level of EphBs has recently been shown to be downregulated in models of Alzheimer's disease (Simón et al., 2009), and phosphorylation of NMDARs is reduced in brains of Alzheimer's disease patients relative to controls (Sze et al., 2001). One intriguing possibility is that the late function of EphBs in synaptic localization of NMDARs may be relevant to neurodegenerative diseases. Consistent with this hypothesis, both ephrin-Bs and EphBs undergo posttranslational modification via γ-secretase activity (Tomita et al., 2006; Litterst et al., 2007), and overexpression of EphB2 has recently been shown to rescue cognitive defects in a mouse model of Alzheimer's disease (Cissé et al., 2011). Additional work will be needed to determine how EphBs and their ligands are linked to Alzheimer's and other diseases, but the recruitment to and modulation of NMDARs at synapses is likely a key part of any potential role.
Footnotes
This work was supported by National Institutes of Health (NIH)–National Institute on Drug Abuse Grant DA022727, NIH–National Institute of Mental Health Grant MH086425, and a grant from The Dana Foundation (M.B.D.). Y.L. was supported by a postdoctoral fellowship from the International Rett Syndrome Foundation. S.I.S.-C. was supported by NIH–National Eye Institute Vision Training Grant EY007035. M.V.L.B. is the Sylvia and Robert S. Olnick Professor of Neuroscience and Distinguished Professor and is supported by NIH Grant NS45287. R.S.Z. is the F. M. Kirby Professor in Neural Repair and Protection, and NIH Grant NS20752 and a generous grant from the F. M. Kirby Foundation supported this work.
References
- Antion MD, Christie LA, Bond AM, Dalva MB, Contractor A. Ephrin-B3 regulates glutamate receptor signaling at hippocampal synapses. Mol Cell Neurosci. 2010;45:378–388. doi: 10.1016/j.mcn.2010.07.011. [DOI] [PMC free article] [PubMed] [Google Scholar]
- Aoto J, Chen L. Bidirectional ephrin/Eph signaling in synaptic functions. Brain Res. 2007;1184:72–80. doi: 10.1016/j.brainres.2006.11.033. [DOI] [PMC free article] [PubMed] [Google Scholar]
- Barria A, Malinow R. NMDA receptor subunit composition controls synaptic plasticity by regulating binding to CaMKII. Neuron. 2005;48:289–301. doi: 10.1016/j.neuron.2005.08.034. [DOI] [PubMed] [Google Scholar]
- Blackstone CD, Moss SJ, Martin LJ, Levey AI, Price DL, Huganir RL. Biochemical characterization and localization of a non-N-methyl-d-aspartate glutamate receptor in rat brain. J Neurochem. 1992;58:1118–1126. doi: 10.1111/j.1471-4159.1992.tb09370.x. [DOI] [PubMed] [Google Scholar]
- Bouvier D, Corera AT, Tremblay ME, Riad M, Chagnon M, Murai KK, Pasquale EB, Fon EA, Doucet G. Pre-synaptic and post-synaptic localization of EphA4 and EphB2 in adult mouse forebrain. J Neurochem. 2008;106:682–695. doi: 10.1111/j.1471-4159.2008.05416.x. [DOI] [PubMed] [Google Scholar]
- Bresler T, Shapira M, Boeckers T, Dresbach T, Futter M, Garner CC, Rosenblum K, Gundelfinger ED, Ziv NE. Postsynaptic density assembly is fundamentally different from presynaptic active zone assembly. J Neurosci. 2004;24:1507–1520. doi: 10.1523/JNEUROSCI.3819-03.2004. [DOI] [PMC free article] [PubMed] [Google Scholar]
- Chen BS, Roche KW. Regulation of NMDA receptors by phosphorylation. Neuropharmacology. 2007;53:362–368. doi: 10.1016/j.neuropharm.2007.05.018. [DOI] [PMC free article] [PubMed] [Google Scholar]
- Chih B, Engelman H, Scheiffele P. Control of excitatory and inhibitory synapse formation by neuroligins. Science. 2005;307:1324–1328. doi: 10.1126/science.1107470. [DOI] [PubMed] [Google Scholar]
- Chubykin AA, Atasoy D, Etherton MR, Brose N, Kavalali ET, Gibson JR, Südhof TC. Activity-dependent validation of excitatory versus inhibitory synapses by neuroligin-1 versus neuroligin-2. Neuron. 2007;54:919–931. doi: 10.1016/j.neuron.2007.05.029. [DOI] [PMC free article] [PubMed] [Google Scholar]
- Cissé M, Halabisky B, Harris J, Devidze N, Dubal DB, Sun B, Orr A, Lotz G, Kim DH, Hamto P, Ho K, Yu GQ, Mucke L. Reversing EphB2 depletion rescues cognitive functions in Alzheimer model. Nature. 2011;469:47–52. doi: 10.1038/nature09635. [DOI] [PMC free article] [PubMed] [Google Scholar]
- Cull-Candy SG, Leszkiewicz DN. Role of distinct NMDA receptor subtypes at central synapses. Sci STKE. 2004;2004:re16. doi: 10.1126/stke.2552004re16. [DOI] [PubMed] [Google Scholar]
- Dalva MB, Takasu MA, Lin MZ, Shamah SM, Hu L, Gale NW, Greenberg ME. EphB receptors interact with NMDA receptors and regulate excitatory synapse formation. Cell. 2000;103:945–956. doi: 10.1016/s0092-8674(00)00197-5. [DOI] [PubMed] [Google Scholar]
- Gardner SM, Takamiya K, Xia J, Suh JG, Johnson R, Yu S, Huganir RL. Calcium-permeable AMPA receptor plasticity is mediated by subunit-specific interactions with PICK1 and NSF. Neuron. 2005;45:903–915. doi: 10.1016/j.neuron.2005.02.026. [DOI] [PubMed] [Google Scholar]
- Graf ER, Zhang X, Jin SX, Linhoff MW, Craig AM. Neurexins induce differentiation of GABA and glutamate postsynaptic specializations via neuroligins. Cell. 2004;119:1013–1026. doi: 10.1016/j.cell.2004.11.035. [DOI] [PMC free article] [PubMed] [Google Scholar]
- Greger IH, Esteban JA. AMPA receptor biogenesis and trafficking. Curr Opin Neurobiol. 2007;17:289–297. doi: 10.1016/j.conb.2007.04.007. [DOI] [PubMed] [Google Scholar]
- Grunwald IC, Korte M, Wolfer D, Wilkinson GA, Unsicker K, Lipp HP, Bonhoeffer T, Klein R. Kinase-independent requirement of EphB2 receptors in hippocampal synaptic plasticity. Neuron. 2001;32:1027–1040. doi: 10.1016/s0896-6273(01)00550-5. [DOI] [PubMed] [Google Scholar]
- Henderson JT, Georgiou J, Jia Z, Robertson J, Elowe S, Roder JC, Pawson T. The receptor tyrosine kinase EphB2 regulates NMDA-dependent synaptic function. Neuron. 2001;32:1041–1056. doi: 10.1016/s0896-6273(01)00553-0. [DOI] [PubMed] [Google Scholar]
- Henkemeyer M, Itkis OS, Ngo M, Hickmott PW, Ethell IM. Multiple EphB receptor tyrosine kinases shape dendritic spines in the hippocampus. J Cell Biol. 2003;163:1313–1326. doi: 10.1083/jcb.200306033. [DOI] [PMC free article] [PubMed] [Google Scholar]
- Holtmaat A, Svoboda K. Experience-dependent structural synaptic plasticity in the mammalian brain. Nat Rev Neurosci. 2009;10:647–658. doi: 10.1038/nrn2699. [DOI] [PubMed] [Google Scholar]
- Huang YH, Lin Y, Mu P, Lee BR, Brown TE, Wayman G, Marie H, Liu W, Yan Z, Sorg BA, Schl̈uter OM, Zukin RS, Dong Y. In vivo cocaine experience generates silent synapses. Neuron. 2009;63:40–47. doi: 10.1016/j.neuron.2009.06.007. [DOI] [PMC free article] [PubMed] [Google Scholar]
- Irie F, Okuno M, Pasquale EB, Yamaguchi Y. EphrinB-EphB signalling regulates clathrin-mediated endocytosis through tyrosine phosphorylation of synaptojanin 1. Nat Cell Biol. 2005;7:501–509. doi: 10.1038/ncb1252. [DOI] [PMC free article] [PubMed] [Google Scholar]
- Isaac JT, Ashby M, McBain CJ. The role of the GluR2 subunit in AMPA receptor function and synaptic plasticity. Neuron. 2007;54:859–871. doi: 10.1016/j.neuron.2007.06.001. [DOI] [PubMed] [Google Scholar]
- Kayser MS, McClelland AC, Hughes EG, Dalva MB. Intracellular and trans-synaptic regulation of glutamatergic synaptogenesis by EphB receptors. J Neurosci. 2006;26:12152–12164. doi: 10.1523/JNEUROSCI.3072-06.2006. [DOI] [PMC free article] [PubMed] [Google Scholar]
- Kayser MS, Nolt MJ, Dalva MB. EphB receptors couple dendritic filopodia motility to synapse formation. Neuron. 2008;59:56–69. doi: 10.1016/j.neuron.2008.05.007. [DOI] [PMC free article] [PubMed] [Google Scholar]
- Kim E, Sheng M. PDZ domain proteins of synapses. Nat Rev Neurosci. 2004;5:771–781. doi: 10.1038/nrn1517. [DOI] [PubMed] [Google Scholar]
- Klein R. Bidirectional modulation of synaptic functions by Eph/ephrin signaling. Nat Neurosci. 2009;12:15–20. doi: 10.1038/nn.2231. [DOI] [PubMed] [Google Scholar]
- Lau CG, Zukin RS. NMDA receptor trafficking in synaptic plasticity and neuropsychiatric disorders. Nat Rev Neurosci. 2007;8:413–426. doi: 10.1038/nrn2153. [DOI] [PubMed] [Google Scholar]
- Lau LF, Mammen A, Ehlers MD, Kindler S, Chung WJ, Garner CC, Huganir RL. Interaction of the N-methyl-d-aspartate receptor complex with a novel synapse-associated protein, SAP102. J Biol Chem. 1996;271:21622–21628. doi: 10.1074/jbc.271.35.21622. [DOI] [PubMed] [Google Scholar]
- Lavezzari G, McCallum J, Lee R, Roche KW. Differential binding of the AP-2 adaptor complex and PSD-95 to the C-terminus of the NMDA receptor subunit NR2B regulates surface expression. Neuropharmacology. 2003;45:729–737. doi: 10.1016/s0028-3908(03)00308-3. [DOI] [PubMed] [Google Scholar]
- Legendre P, Rosenmund C, Westbrook GL. Inactivation of NMDA channels in cultured hippocampal neurons by intracellular calcium. J Neurosci. 1993;13:674–684. doi: 10.1523/JNEUROSCI.13-02-00674.1993. [DOI] [PMC free article] [PubMed] [Google Scholar]
- Lin Y, Skeberdis VA, Francesconi A, Bennett MV, Zukin RS. Postsynaptic density protein-95 regulates NMDA channel gating and surface expression. J Neurosci. 2004;24:10138–10148. doi: 10.1523/JNEUROSCI.3159-04.2004. [DOI] [PMC free article] [PubMed] [Google Scholar]
- Litterst C, Georgakopoulos A, Shioi J, Ghersi E, Wisniewski T, Wang R, Ludwig A, Robakis NK. Ligand binding and calcium influx induce distinct ectodomain/gamma-secretase-processing pathways of EphB2 receptor. J Biol Chem. 2007;282:16155–16163. doi: 10.1074/jbc.M611449200. [DOI] [PMC free article] [PubMed] [Google Scholar]
- Liu SJ, Cull-Candy SG. Subunit interaction with PICK and GRIP controls Ca2+ permeability of AMPARs at cerebellar synapses. Nat Neurosci. 2005;8:768–775. doi: 10.1038/nn1468. [DOI] [PubMed] [Google Scholar]
- McClelland AC, Sheffler-Collins SI, Kayser MS, Dalva MB. Ephrin-B1 and ephrin-B2 mediate EphB-dependent presynaptic development via syntenin-1. Proc Natl Acad Sci U S A. 2009;106:20487–20492. doi: 10.1073/pnas.0811862106. [DOI] [PMC free article] [PubMed] [Google Scholar]
- McClelland AC, Hruska M, Coenen AJ, Henkemeyer M, Dalva MB. Trans-synaptic EphB2-ephrin-B3 interaction regulates excitatory synapse density by inhibition of postsynaptic MAPK signaling. Proc Natl Acad Sci U S A. 2010;107:8830–8835. doi: 10.1073/pnas.0910644107. [DOI] [PMC free article] [PubMed] [Google Scholar]
- Monyer H, Burnashev N, Laurie DJ, Sakmann B, Seeburg PH. Developmental and regional expression in the rat brain and functional properties of four NMDA receptors. Neuron. 1994;12:529–540. doi: 10.1016/0896-6273(94)90210-0. [DOI] [PubMed] [Google Scholar]
- Myme CI, Sugino K, Turrigiano GG, Nelson SB. The NMDA-to-AMPA ratio at synapses onto layer 2/3 pyramidal neurons is conserved across prefrontal and visual cortices. J Neurophysiol. 2003;90:771–779. doi: 10.1152/jn.00070.2003. [DOI] [PubMed] [Google Scholar]
- Pérez-Otaño I, Ehlers MD. Homeostatic plasticity and NMDA receptor trafficking. Trends Neurosci. 2005;28:229–238. doi: 10.1016/j.tins.2005.03.004. [DOI] [PubMed] [Google Scholar]
- Philpot BD, Zukin RS. Synapse-specific metaplasticity: to be silenced is not to silence 2B. Neuron. 2010;66:814–816. doi: 10.1016/j.neuron.2010.06.014. [DOI] [PMC free article] [PubMed] [Google Scholar]
- Philpot BD, Cho KK, Bear MF. Obligatory role of NR2A for metaplasticity in visual cortex. Neuron. 2007;53:495–502. doi: 10.1016/j.neuron.2007.01.027. [DOI] [PMC free article] [PubMed] [Google Scholar]
- Prybylowski K, Chang K, Sans N, Kan L, Vicini S, Wenthold RJ. The synaptic localization of NR2B-containing NMDA receptors is controlled by interactions with PDZ proteins and AP-2. Neuron. 2005;47:845–857. doi: 10.1016/j.neuron.2005.08.016. [DOI] [PMC free article] [PubMed] [Google Scholar]
- Salter MW, Kalia LV. Src kinases: a hub for NMDA receptor regulation. Nat Rev Neurosci. 2004;5:317–328. doi: 10.1038/nrn1368. [DOI] [PubMed] [Google Scholar]
- Sanz-Clemente A, Matta JA, Isaac JT, Roche KW. Casein kinase 2 regulates the NR2 subunit composition of synaptic NMDA receptors. Neuron. 2010;67:984–996. doi: 10.1016/j.neuron.2010.08.011. [DOI] [PMC free article] [PubMed] [Google Scholar]
- Sheng M, Cummings J, Roldan LA, Jan YN, Jan LY. Changing subunit composition of heteromeric NMDA receptors during development of rat cortex. Nature. 1994;368:144–147. doi: 10.1038/368144a0. [DOI] [PubMed] [Google Scholar]
- Shi Y, Pontrello CG, DeFea KA, Reichardt LF, Ethell IM. Focal adhesion kinase acts downstream of EphB receptors to maintain mature dendritic spines by regulating cofilin activity. J Neurosci. 2009;29:8129–8142. doi: 10.1523/JNEUROSCI.4681-08.2009. [DOI] [PMC free article] [PubMed] [Google Scholar]
- Simón AM, de Maturana RL, Ricobaraza A, Escribano L, Schiapparelli L, Cuadrado-Tejedor M, Pérez-Mediavilla A, Avila J, Del Río J, Frechilla D. Early changes in hippocampal Eph receptors precede the onset of memory decline in mouse models of Alzheimer's disease. J Alzheimers Dis. 2009;17:773–786. doi: 10.3233/JAD-2009-1096. [DOI] [PubMed] [Google Scholar]
- Skeberdis VA, Chevaleyre V, Lau CG, Goldberg JH, Pettit DL, Suadicani SO, Lin Y, Bennett MV, Yuste R, Castillo PE, Zukin RS. Protein kinase A regulates calcium permeability of NMDA receptors. Nat Neurosci. 2006;9:501–510. doi: 10.1038/nn1664. [DOI] [PubMed] [Google Scholar]
- Sobczyk A, Scheuss V, Svoboda K. NMDA receptor subunit-dependent [Ca2+] signaling in individual hippocampal dendritic spines. J Neurosci. 2005;25:6037–6046. doi: 10.1523/JNEUROSCI.1221-05.2005. [DOI] [PMC free article] [PubMed] [Google Scholar]
- Sze C, Bi H, Kleinschmidt-DeMasters BK, Filley CM, Martin LJ. N-methyl-d-aspartate receptor subunit proteins and their phosphorylation status are altered selectively in Alzheimer's disease. J Neurol Sci. 2001;182:151–159. doi: 10.1016/s0022-510x(00)00467-6. [DOI] [PubMed] [Google Scholar]
- Takasu MA, Dalva MB, Zigmond RE, Greenberg ME. Modulation of NMDA receptor-dependent calcium influx and gene expression through EphB receptors. Science. 2002;295:491–495. doi: 10.1126/science.1065983. [DOI] [PubMed] [Google Scholar]
- Tang YP, Shimizu E, Dube GR, Rampon C, Kerchner GA, Zhuo M, Liu G, Tsien JZ. Genetic enhancement of learning and memory in mice. Nature. 1999;401:63–69. doi: 10.1038/43432. [DOI] [PubMed] [Google Scholar]
- Tolias KF, Bikoff JB, Kane CG, Tolias CS, Hu L, Greenberg ME. The Rac1 guanine nucleotide exchange factor Tiam1 mediates EphB receptor-dependent dendritic spine development. Proc Natl Acad Sci U S A. 2007;104:7265–7270. doi: 10.1073/pnas.0702044104. [DOI] [PMC free article] [PubMed] [Google Scholar]
- Tomita T, Tanaka S, Morohashi Y, Iwatsubo T. Presenilin-dependent intramembrane cleavage of ephrin-B1. Mol Neurodegener. 2006;1:2. doi: 10.1186/1750-1326-1-2. [DOI] [PMC free article] [PubMed] [Google Scholar]
- Tong G, Shepherd D, Jahr CE. Synaptic desensitization of NMDA receptors by calcineurin. Science. 1995;267:1510–1512. doi: 10.1126/science.7878472. [DOI] [PubMed] [Google Scholar]
- Torres R, Firestein BL, Dong H, Staudinger J, Olson EN, Huganir RL, Bredt DS, Gale NW, Yancopoulos GD. PDZ proteins bind, cluster, and synaptically colocalize with Eph receptors and their ephrin ligands. Neuron. 1998;21:1453–1463. doi: 10.1016/s0896-6273(00)80663-7. [DOI] [PubMed] [Google Scholar]
- Tovar KR, Westbrook GL. The incorporation of NMDA receptors with a distinct subunit composition at nascent hippocampal synapses in vitro. J Neurosci. 1999;19:4180–4188. doi: 10.1523/JNEUROSCI.19-10-04180.1999. [DOI] [PMC free article] [PubMed] [Google Scholar]
- Washbourne P, Bennett JE, McAllister AK. Rapid recruitment of NMDA receptor transport packets to nascent synapses. Nat Neurosci. 2002;5:751–759. doi: 10.1038/nn883. [DOI] [PubMed] [Google Scholar]
- Zheng X, Zhang L, Wang AP, Bennett MV, Zukin RS. Ca2+ influx amplifies protein kinase C potentiation of recombinant NMDA receptors. J Neurosci. 1997;17:8676–8686. doi: 10.1523/JNEUROSCI.17-22-08676.1997. [DOI] [PMC free article] [PubMed] [Google Scholar]
- Zorumski CF, Yang J, Fischbach GD. Calcium-dependent, slow desensitization distinguishes different types of glutamate receptors. Cell Mol Neurobiol. 1989;9:95–104. doi: 10.1007/BF00711446. [DOI] [PMC free article] [PubMed] [Google Scholar]
- Zukin RS, Bennett MV. Alternatively spliced isoforms of the NMDARI receptor subunit. Trends Neurosci. 1995;18:306–313. doi: 10.1016/0166-2236(95)93920-s. [DOI] [PubMed] [Google Scholar]