

Abstract
Animal and clinical observations of a reduction in electrode impedance following electrical stimulation encouraged the development of an in vitro model of the electrode-tissue interface. This model was used previously to show an increase in impedance with cell and protein cover over electrodes. In this paper, the model was used to assess the changes in electrode impedance and cell cover following application of a charge-balanced biphasic current pulse train. Following stimulation, a large and rapid drop in total impedance (Zt) and access resistance (Ra) occurred. The magnitude of this impedance change was dependent on the current amplitude used, with a linear relationship determined between Ra and the resulting cell cover over the electrodes. The changes in impedance due to stimulation were shown to be transitory, with impedance returning to pre-stimulation levels several hours after cessation of stimulation. A loss of cells over the electrode surface was observed immediately after stimulation suggesting that the level of stimulation applied was creating localised changes to cell adhesion. Similar changes in electrode impedance were observed for in vivo and in vitro work, thus helping to verify the in vitro model, although the underlying mechanisms may differ. A change in the porosity of the cellular layer was proposed to explain the alterations in electrode impedance in vitro. These in vitro studies provide insight into the possible mechanisms occurring at the electrode-tissue interface in association with electrical stimulation.
1. Introduction
Cochlear implants electrically stimulate cochlear spiral ganglion cells in order to provide auditory percepts for severe and profoundly deaf patients. The power required to do so is significant, and as such, any changes resulting in increases in power requirement are of importance. Electrode impedance is one area where changes occurring at the electrode-tissue interface affect power usage. Electrode impedance can be described as the resistance to charge exchange between the electrode surface and the electrolyte. Power is directly proportional to electrode impedance, such that increases in electrode impedance result in increases in the device’s power requirements. Tissue growth around implanted electrodes increases electrode impedance and thus power usage also rises. The in vitro model used in this paper has been used to describe the changes in electrode impedance that occur when protein and cells cover the surface of the electrode (Newbold, Richardson et al. 2010). In both cases, total electrode impedance (Zt) was shown to increase with electrode coverage. Protein adsorption affected the polarisation component (Zp) of impedance, while cell growth had maximum affect on the access resistance (Ra).
Animal cochlear implant studies have shown short-term changes in electrode impedance associated with biphasic current pulse stimulation. The impedance of chronically implanted electrodes in the cochleae of experimental animals was often lower immediately after stimulation than before stimulation (Charlet de Sauvage, Lima da Costa et al. 1997; Shepherd, Serruto et al. 2001). Electrical stimulation of thin-film iridium oxide electrodes in the cortex also resulted in a decrease in impedance compared to pre-stimulation levels (Weiland and Anderson 2000). The impedance decreases associated with stimulation described above were all temporary; following cessation of stimulation the impedances returned to pre-stimulation levels by the next day of testing.
Changes in electrode impedance with stimulation have also been described clinically in cochlear implant recipients. One study showed impedance decreased by 10% during the first stimulation session (Busby, Plant et al. 2002). This stimulus-induced fluctuation in impedance has also been recorded over a three-day period in an experienced cochlear implant recipient, suggesting transitory impedance changes exist long after implantation (Seligman 2004).
However the underlying mechanism behind this change in impedance with electrical stimulation is not clear. Electroporation, whereby the application of an electric field causes changes in the cell membrane permeability, may be involved. This paper examines the effect of cell cover on impedance during electrical stimulation in vitro. It follows on from a preliminary study which modelled electrical stimulation-induced changes in impedance with cell-covered electrodes in vitro. The study showed a drop in impedance following stimulation that returned to pre-stimulation levels following cessation of stimulation (Newbold, Richardson et al. 2004).
The first study in this paper was performed to provide details on the timing of the impedance drop following stimulation, and how stimulation of cell-covered electrodes affected the impedance components (access resistance Ra and polarisation impedance Zp). The effect of electrical stimulation on the resulting cell coverage was also assessed. Three levels of stimulation were used: biphasic current pulses with amplitudes of 0.5 mA, 0.2 mA and 0.05 mA (25 nC/phase, 10 nC/phase and 2.5 nC/phase respectively). A safe charge limit for neuroprostheses can be derived from the results of chronically implanted electrodes in cortical tissue (McCreery, Agnew et al. 1988; McCreery, Agnew et al. 1990). Using a safety factor of 1.5 as described in Shannon (1992), the gold in vitro electrodes in this study would have a safe charge limit of 126nC. Thus the stimulation levels provided in these studies would be expected to be safe for neural tissue in vivo.
The second study in this paper, described as “live view”, assessed the real time effect of stimulation on cell-covered electrodes. By viewing the stimulating electrodes and their cell coverage during stimulation, an understanding of the changes occurring at the electrode surface were determined, and related to the measured changes in electrode impedance. In doing so, this experiment provided a longitudinal assessment of the effect of stimulation on cell-covered electrodes.
2. Methods
Most of the experimental methods used in this paper have been published previously (Newbold, Richardson et al. 2004). A brief description is included below.
2.1. Electrode design
Disposable slides with thin-film gold electrodes from the Electric Cell-Substrate Impedance Sensing (ECIS) Cultureware range (Applied BioPhysics) were used in conjunction with electrical components built in-house (Newbold, Richardson et al. 2004; Newbold, Richardson et al. 2010). Within the eight chambers of each slide were a small active electrode (surface area of approximately 0.05 mm2) and a larger common counter electrode (surface area of approximately 21.8 mm2).
2.2. Cell culture and measurement
Maudin-Darby Canine Kidney (MDCK) cells were grown in cell growth media (Dulbecco’s Modified Eagle (DME) media (Life Technologies) containing 10% foetal bovine serum (FBS, Trace Scientific)) with 1% penicillin/streptomycin/amphotericin (PSA) solution (Sigma-Aldrich). Cells were placed in a humidified incubator at 37ºC and 10% CO2 at all times except when indicated otherwise.
Cells were fixed at the end of each trial using a 10 minute wash of 4% paraformaldehyde in phosphate buffered saline (PBS), followed by a 5 minute wash of 0.1% Triton-X 100 (t-Octylphenoxypolyethoxy-ethanol; Sigma-Aldrich) in PBS. After washing in PBS alone, cells were incubated in 82.5 nM phalloidin fluoroisothiocyanate (FITC, Sigma-Aldrich), which stains actin green. Each electrode was coverslipped with a DAPI (4’, 6 diamidino-2-phenylindole) anti-fade mounting medium (Vector Laboratories), which counterstains the DNA blue. The slides were viewed under an epifluorescent microscope (Zeiss Axioplan Digital Microscope) and each electrode was photographed with a digital camera (Zeiss AxioCam MRm). The proportion of electrode area covered by cells was measured using in-house software that assessed the amount of green and blue fluorescence (cell-covered), or blue fluorescence (nucleus covered), against the black (uncovered) electrode background.
2.3. Automated stimulation and impedance recordings
An automated system for measuring and stimulating the in vitro electrodes was designed and manufactured in-house. It allowed finely timed impedance measurements and automatic switching between impedance measurement and electrical stimulation. Impedance measures were taken intermittently, at most every 2½ minutes. This system required a power source, an impedance measurement stimulator, an oscilloscope to view the waveforms (Gould, DSO 400), relay boards to switch between electrodes, a relay board to switch between stimulation and measurement, and a computer to run the program.
2.3.1. Electrical stimulation
Battery powered stimulators, designed and manufactured in-house, were used to provide the electrical stimulation. These were small enough to be located inside the incubator allowing stimulation under physiologic conditions. These stimulators provided electrically floating, constant current, charge-balanced biphasic pulsatile waveforms for all experiments: cathodic leading phase, 50 μs pulse width, 25 μs interphase gap and a pulse rate of 200 pps. A range of stimulus current amplitudes were used 0.5 mA, 0.2 mA and 0.05 mA (charge densities of 50, 20 and 5 μC/cm2 respectively). The stimulators were designed to reduce direct current build up during stimulation: electrodes were floating between phases of each pulse, shorted together between pulses and capacitive coupling was employed (Huang, Shepherd et al. 1999). One ECIS slide required two stimulators, each capable of stimulating three electrode pairs, all using the larger common electrode for the return path. Two of the eight electrodes on each slide remained unstimulated.
2.3.2. Electrode impedance
Impedance was measured using a battery-operated, optically isolated, stimulator that generated charge balanced biphasic current pulses (Newbold, Richardson et al. 2004; Newbold, Richardson et al. 2010). The parameters of the biphasic current pulse used in this work to measure impedance were as follows: 100 pps pulse train, cathodic leading phase (with respect to the active electrode), 0.5 mA amplitude, 50 μs pulse width and a 25 μs interphase gap. Electrodes were open circuit between phases of the measurement pulse. Electrode impedance values, total impedance (Zt), access resistance (Ra) and polarisation impedance (Zp), were extracted from the recorded voltage waveform using Ohm’s law (described previously, Newbold et al. 2010).
2.4. Study A: varied current
Cell-free DME medium was added to all wells of the ECIS slides and voltage waveforms were recorded. After this, two of the eight wells (electrodes 1 and 5) of each slide were left with DME medium and used as cell-free controls. The remaining wells were plated with MDCK cells at approximately 5 × 10⁴ cells/cm2 in 500 μl of cell growth medium. Arrays were placed in a humidified incubator at 37°C and 10% CO2.
Figure 1a shows the timeline and sample sizes of the experiments conducted for Study A. Following plating, cells were given at least 24 hours to adhere to the surface of the electrode before stimulation began. Two blocks of stimulation, each six hours in duration were administered to electrodes (both with and without cell growth) with 16 hours of no stimulation between blocks. Three stimulus current amplitudes were used: 0.5 mA, 0.2 mA and 0.05 mA (charge densities of 50, 20 and 5 μC/cm2 respectively at the small active electrode). Control electrodes received no electrical stimulation (again, both with and without cell growth).
Figure 1.

Schematic of the study timelines. A) Study A: varied current. The frequency of impedance measurements for groups 1 – 6 (with or without cell growth, and with or without electrical stimulation) is shown with dotted lines on group 1. Stimulation intensities for groups 4 – 6 were 0.5 mA, 0.2 mA and 0.05 mA respectively. Control electrodes in group 2 received stimulation of either 0.5 mA, 0.2 mA or 0.05 mA (N = 5 for each stimulation level). B) Study B: live view. The frequency of impedance measurements and photographs for groups 7 – 9 is shown with dotted and solid lines respectively on group 7.
Impedance was measured periodically during the course of each experiment (Figure 1a); initially every hour as cells grew onto the surface of the electrode; at 10 minute intervals every hour prior to stimulation; at 2½ minute intervals for the first 20 minutes of stimulation; then at 10 minute intervals for the remainder of each stimulation block. Following cessation of stimulation, electrode impedance was measured every 10 minutes for one hour, and then every hour until stimulation recommenced. This was repeated during the second day of stimulation. The cells on all electrodes were fixed and stained at the end of each experiment and cell cover over each electrode was measured.
The impedance values at four time points (before and after the first and second blocks of stimulation) were analysed using a two-sample t-test between each group. One-way ANOVAs were conducted to assess the change in impedance values between the cell-covered electrodes due to stimulation (i.e. between groups 3, 4, 5 and 6; Figure 1a). Significance was determined using p-values of less than 0.05. The amount of variance in the electrode impedance values was evaluated using R2adj, and tests of normality were conducted on each analysis’ residuals. A qualitative assessment of the timing of impedance change following stimulation and cessation of stimulation was also undertaken.
2.5. Study B: live view
Cell-free DME medium was added to all wells of the ECIS slides and voltage waveforms were recorded. After this, two of the eight wells (electrodes 1 and 5) of each slide were left with DME medium and used as cell-free controls. The remaining wells were plated with MDCK cells at approximately 5 × 10⁴ cells/cm2 in 500 μl of cell growth medium. Slides were placed in a humidified incubator at 37°C and 10% CO2.
Figure 1b shows the timeline of the experiments conducted. Following plating, cells were given at least 24 hours to adhere to the surface of the electrode before stimulation began. Two blocks of stimulation, each six hours in duration were administered to electrodes with 16 hours of no stimulation between blocks. Stimulation was achieved using the pulse described above at a current amplitude of 0.5 mA (charge density of 50 μC/cm2). The two control groups (with and without cell growth) received no electrical stimulation. Impedance was measured every 10 minutes during both stimulation blocks. Photomicrographs were taken of the electrodes at the following time points: 1) prior to the addition of cells, 2) prior to and 3) following the first stimulation block, 4) prior to and 5) following the second stimulation block. Cell coverage over the electrode was detected using a Leitz Laborlux S microscope (transmitted white light) with a 10 × long-working distance objective and recorded using a Nikon Coolpix 995 digital camera. Photographs were conducted at room temperature and normal atmospheric conditions. This process took approximately five minutes, after which time the slides were returned to the incubator.
The cells on all electrodes were fixed and stained at the end of each experiment and the area of cell cover over electrodes was measured. The presence of live cells covering the electrodes was analysed qualitatively by comparing the phase contrast of the electrodes with and without cell growth. The presence of cells over the electrode during stimulation was then compared with that seen following fixation and staining.
One-way ANOVAs were conducted to assess the change in impedance values between the cell-covered electrodes due to stimulation (i.e. between groups 8 and 9; Figure 1b). Significance was determined using p-values of less than 0.05. The amount of variance in the electrode impedance values was evaluated using R2adj, and tests of normality were conducted on each analysis’ residuals.
3. Results
3.1. Study A: varied current
Electrode impedance increased following cell plating, similar to that seen in previous in vitro studies (Newbold, Richardson et al. 2004; Newbold, Richardson et al. 2010). Transient changes in electrode impedance were observed associated with the six-hour periods of electrical stimulation, initiated 37 and 61 hours after cell plating. Examples of the changes in total impedance (Zt) over time are shown in Figure 2 for one electrode at each stimulation level. Examples of the voltage waveforms of these electrodes are also illustrated for the following time points: 1) prior to the addition of cells, 2) prior to and 3) following the first stimulation block, 4) prior to and 5) following the second stimulation block. The highest level of stimulation tested (0.5 mA) was associated with a drop in Zt analogous to that seen in the previous cell growth and stimulation study (Newbold, Richardson et al. 2004). Whereas, the lower two levels of stimulation (0.2 mA and 0.05 mA) showed a small rise in Zt. Figure 2 also shows the resulting cell cover over representative electrodes following the second block of stimulation at the end of each experiment. These show little to no cells covering the electrode subjected to 0.5 mA of stimulation, with increasing cell cover seen over the electrodes exposed to lower levels of stimulation (0.2 mA and 0.05 mA respectively). Complete cell cover was seen over control electrodes (no stimulation; not illustrated).
Figure 2.

Representative plots of voltage waveforms and the resulting total impedance (Zt) for Study A: varied current. The different levels of electrical stimulation are shown (A: 0.5 mA, B: 0.2 mA and C: 0.05 mA), applied between points 2 and 3 and points 4 and 5. Inset plots show the electrode voltage waveforms for each time point: 1) prior to addition of cells; 2) prior to first stimulation block; 3) following first stimulation block; 4) prior to second stimulation block; and 5) following second stimulation block. The resulting cell cover over the electrodes following fixation and staining is shown in the inset photomicrographs (electrode diameter 250 μm).
The mean and standard deviation of changes to Zt, Ra and Zp electrode impedance values for each group are shown in Figure 3 (with the exception of group 2, no cells with stimulation). From these graphs it can be seen that blocks of 0.5 mA stimulation caused a large and rapid drop in Ra, a large and rapid rise in Zp, with an overall drop in Zt. The blocks of 0.2 mA stimulation showed a smaller but similarly rapid drop in Ra, a large and rapid rise in Zp with an overall increase in Zt. The changes in impedance values due to the blocks of 0.05 mA stimulation were negligible when compared with that of group 3 (cell growth without stimulation).
Figure 3.


Graphs of the changes in impedance over time in Study A: varied current. Mean and standard deviation are shown. Changes in Zt are shown in A, D, G and J. Changes in Ra are shown in B, E, H and K. Changes in Zp are shown in C, F, I and L. Control values are shown in A, B and C, i.e. electrodes with cells and no stimulation and electrodes with no cells and no stimulation. Plots D, E and F show the changes in impedance with cells and stimulation blocks of 0.5 mA. Plots G, H and I show the changes in impedance with cells and stimulation blocks of 0.2 mA. Plots J, K and L show the changes in impedance with cells and stimulation blocks of 0.05 mA. Mean values of the control groups are shown in plots D through L for comparison. Black bars represent time of stimulation. Data are based on a total of 137 electrodes.
Two-sample t-tests showed a significant difference in the impedance values of electrodes due to the addition of cells before and after the first and second blocks of stimulation. This relationship was particularly evident for Zt and Ra, with some time points and groups showing no difference for Zp. Results showed little to no significant difference in impedance values of cell-free electrodes with or without stimulation.
The effect of stimulation on cell-covered electrodes was also analysed using one-way ANOVAs (i.e. between groups 3, 4, 5 and 6; Figure 1a) and is shown in Table 1. The large drop in Zt, Ra and rise in Zp following blocks of 0.5 mA stimulation was shown to be significantly different from the unstimulated controls (p<0.001). A significant difference in Ra and Zp also existed prior to stimulation however only low levels of variance were explained by the stimulation group (R2adj at or below 10%).
Table 1.
Statistical results from Study A: varied current. Electrode impedance values of electrodes with cell cover were assessed against the presence of stimulation at four time points (before 1st stimulation block, after 1st stimulation block, before 2nd stimulation block and after 2nd stimulation block). The p-values for each variable tested have also been shown, with significant values in bold (p < 0.05). The amount of variance for each impedance value is shown by R2adj. For example, 28% of the variance in Zt after the first stimulation block of 0.5 mA was due to the presence of stimulation. (C/noES = group 3, cells/no stimulation).
| Effect of stimulation group on electrode impedance | Before 1st stim block | After 1st stim block | Before 2nd stim block | After 2nd stim block | ||
|---|---|---|---|---|---|---|
| C/noES (group 3; N= 19) vs 0.5 mA (group 4; N= 44) | Zt | p-value R2adj |
0.911 0.00% |
<0.001 27.63% |
0.197 0.55% |
<0.001 62.93% |
| Ra | p-value R2adj |
<0.001 9.58% |
<0.001 78.43% |
0.415 0.00% |
<0.001 92.80% |
|
| Zp | p-value R2 adj |
<0.001 10.31% |
<0.001 55.63% |
0.002 6.73% |
<0.001 47.40% |
|
| C/noES (group 3; N= 19) vs 0.2 mA (group 5; N= 21) | Zt | p-value R2 adj |
0.150 1.42% |
0.020 5.66% |
<0.001 41.57% |
0.544 0.00% |
| Ra | p-value R2adj |
0.110 2.05% |
<0.001 51.06% |
0.786 0.00% |
<0.001 78.28% |
|
| Zp | p-value R2 adj |
0.003 9.62% |
<0.001 78.21% |
<0.001 24.37% |
<0.001 70.14% |
|
| C/noES (group 3; N= 19) vs 0.05 mA (group 6; N= 19) | Zt | p-value R2 adj |
0.272 0.31% |
0.004 9.72% |
0.003 10.04% |
0.027 5.34% |
| Ra | p-value R2adj |
0.772 0.00% |
0.003 10.63% |
0.673 0.00% |
0.685 0.00% |
|
| Zp | p-value R2 adj |
0.401 0.00% |
0.851 0.00% |
0.024 5.59% |
0.141 1.63% |
|
Little to no change in Zt was observed with stimulation at 0.2 mA. While a significant difference in Zt was observed prior to the second block of stimulation, no difference was noted in Zt following this stimulation block. A drop in Ra was recorded following 0.2 mA stimulation, similar to that seen with the 0.5 mA stimulation blocks. An equivalent rise in Zp was also recorded following stimulation at 0.2 mA, resulting in the lack of change seen in Zt.
While there were significant differences in electrode impedance values before and after stimulation at 0.05 mA, the variance accounted for by these analyses were low (R2adj below 11%). Also, there was little to no change in impedance values seen with 0.05 mA stimulation compared with the unstimulated group.
The relationship between final electrode impedance values and cell cover is shown in Figure . Ra showed a strong linear relationship to cell cover (Figure 4b), whereas quadratic equations provided the best fits for Zt and Zp (Figure a and Figure 4c respectively). These values showed an initial rise in impedance with cell cover which reached maximum at around 40% – 60% cell cover and represent data from 137 electrodes.
Figure 4.

Scatter plots of the changes in electrode impedance values with cell cover over the electrode (Study A: varied current).
Statistical analysis (GLM) of the final electrode impedance values was conducted using the cell cover and/or the stimulation level as explanatory variables. Cell cover 2 was found to significantly affect Zt and Ra (R2 adj 61% and 89% respectively), while the stimulation level used was a significant predictor for Ra and Zp (R2 adj 16% and 18% respectively). When cell cover and stimulation level were assessed together, both were found to be significant predictors for all three electrode impedance values. These variables were found to predict Ra and Zt well (R2 adj of 90% and 70% respectively) compared to only 22% of the variance of Zp accounted for using this test.
3.2. Study B: live view
As seen in Study A (varied current), transient changes in electrode impedance were observed with the electrical stimulation of cell-covered electrodes. Total impedance (Zt) increased following cell plating and dropped with the first block of stimulation (0.5 mA). Recovery to pre-stimulation levels was achieved following a break from the electrical stimulus, with a subsequent decrease in Zt during the second block of stimulation.
Photomicrographs of cell cover over the electrodes prior to and following the two blocks of electrical stimulation show large differences. Figure shows the cell cover changes seen on the electrode surface with live viewing. The first picture shows the clean electrode prior to cell plating (1), with the second image taken 40 hours after cell plating shows the electrode with complete cell cover prior to electrical stimulation (2). The third image was taken following six hours of stimulation at 0.5 mA (3). Despite the large drop in Zt measured, a complete layer of cells over the electrode was still evident. By the start of the second block of stimulation, also at 0.5 mA (4), the morphology of the cells covering the electrode had changed. A second layer of cells appears to have formed under the original (top) layer of cells. This original layer of cells was still present at the end of the second block of stimulation (5). Figure (6) shows the amount of cells remaining on the electrode (and surrounding substrate) following fixation and staining of the cells on the electrode at the termination of the experiment. While cells were still visible over the electrode surface following the end of the second stimulation block, none remained over the electrode after the nominal physical agitation involved with fixation and staining.
These results contrast with that of a cell-covered electrode surface not exposed to electrical stimulation (Figure 6). Photographs of unstimulated control electrodes showed little change in cell cover throughout the experiment. Complete cell cover remained over the electrodes following fixation and staining.
Figure 6.
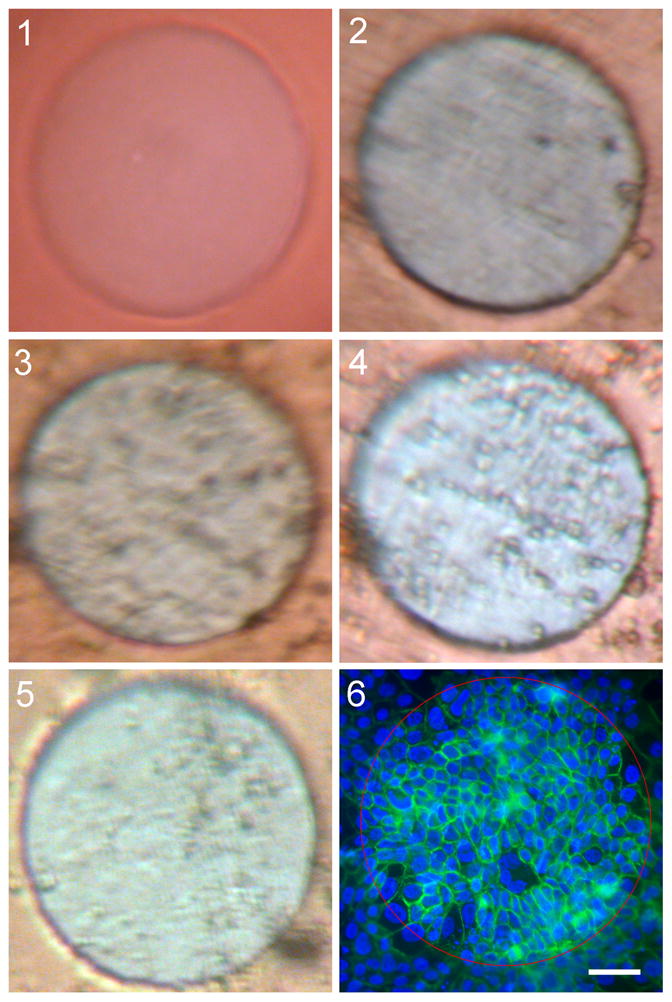
Photographs of one electrode from Study B: live view. The electrode shown was from group 8, with photos taken at each time point: 1) prior to addition of cells; 2) prior to first stimulation block; 3) following first stimulation block; 4) prior to second stimulation block; and 5) following second stimulation block. The resulting cell cover over the electrodes is shown in the final image (6). Cells in 6 were fixed and stained with phalloidin FITC (green) and DAPI (blue). Red circle indicates electrode boundary. Scale bar: 50 μm.
All electrodes with cell growth and stimulation showed the same changes in electrode impedance values as seen in Study A (varied current). The results from one-way ANOVAs comparing the change in impedance between the two cell-covered electrode groups (8 and 9) were also consistent with those seen in Study A. There was a significant difference between the two groups following both the first and second block of stimulation for all impedance values. A significant difference in Zt and Zp was also seen prior to the second block of stimulation between the two groups. The changes in impedance over time are illustrated in Figure 7.
Figure 7.
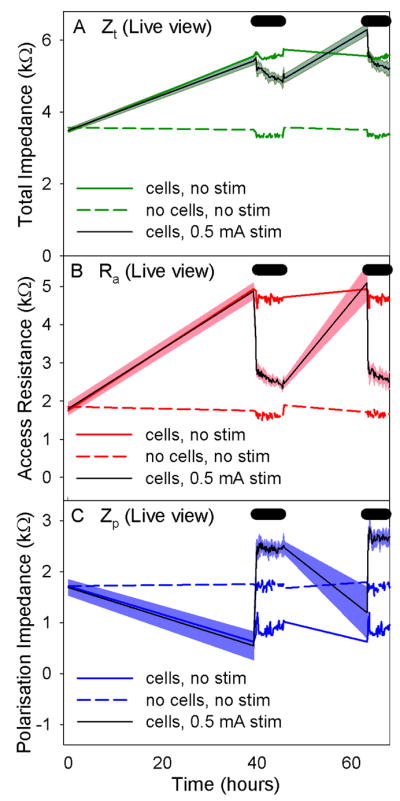
Graphs of the changes in impedance over time and the final photographs of each electrode from Study B: live view. The mean and standard deviation of changes in the electrode impedance values are shown A) Zt, B) Ra, and C) Zp.
4. Discussion
Electrical stimulation altered the electrode impedance of cell-covered electrodes
Both studies demonstrated that electrical stimulation significantly affected electrode impedance values for cell-covered electrodes. Initial increases in Zt and Ra associated with cell adhesion to the electrode surface, dropped after stimulation. It was also shown that without cell growth, electrical stimulation of the level provided had little to no significant effect on the ‘clean’ electrode impedance values.
Electrical stimulation altered cell growth
Alongside the changes in electrode impedance values, a loss of cell cover directly over the electrode surface was recorded (Figure 2). These changes were restricted to the electrode surface as no change in cell coverage was evident over the insulating resin adjacent to these electrodes in the wells. The presence of these adjacent cells on the well substrate allowed cell growth to continue over the electrode surface during periods without stimulation. This mechanism of repopulating a cellular wound with cells on the fringe of the damage has been studied previously (Keese, Wegener et al. 2004). Keese et al. (2004) described the repopulation of an opening in a cell sheet with adjacent cells as their growth was no longer contact-inhibited.
Current amplitude altered response
Three current amplitudes were tested, with differences seen in the resulting electrode impedance values and cell cover. The greatest changes in both aspects occurred with the 0.5 mA pulse amplitude. The lower amplitude pulses (0.2 mA and 0.05 mA) resulted in less change to electrode impedance and cell cover. Another in vitro study assessing the effect of altering stimulation parameters on adherent cells has also shown similar relationships (Wegener, Keese et al. 2002). Alternating current pulses were used to stimulate MDCK cells on gold ECIS electrodes. While frequency, amplitude and duration of the alternating current were all shown to alter the intensity of the cellular response, a typical electroporating pulse used an alternate current (AC) voltage pulse of 40 kHz frequency, 3 V amplitude and 100 ms duration (Wegener, Keese et al. 2002).
Cell growth affected access resistance
A statistically significant and linear relationship between stimulation current amplitude and a reduction in Ra was found. Stimulation at 0.5 mA was observed to cause the greatest drop in Ra, followed by 0.2 mA stimulation. Little to no change in Ra following stimulation at 0.05 mA was shown. This correlated with the amount of cell cover over electrodes following stimulation. The relationship between cell cover over the electrodes and changes in Ra was comparable to that seen in a previous study assessing the effect of cell growth alone (i.e. no electrical stimulation) (Newbold, Richardson et al. 2010).
Rapid reduction in impedance with electrical stimulation
The timing of the stimulation-induced impedance change was rapid. The rate of impedance reduction following stimulation imitates that of a study involving a single cochlear implant recipient (Seligman 2004). This study described the daily decrease in impedance over the first 15 minutes of stimulation onset. Other in vitro studies involving the electroporation of cells also showed a rapid decrease in impedance with the onset of stimulation (Ghosh, Keese et al. 1993; Wegener, Keese et al. 2002; Keese, Wegener et al. 2004).
Rapid rise in impedance following cessation of stimulation
The recovery time of the electrode impedance values following cessation of electrical stimulation was approximately 3–6 hours. The duration of this growth was similar to the initial rise in impedance measured following cell plating. This outcome provides additional support to the theory that the active electrode was being repopulated with cells on the perimeter of the electrode.
In vitro electroporation studies assessed the rate of impedance rise following cessation of electrical stimulation. One study reported that the pores formed within cell membranes can seal within a few seconds (Ghosh, Keese et al. 1993). A subsequent study showed longer bursts of electrical stimulation on adherent mammalian cells (including MDCKs) created an extended timeframe for impedance recovery, up to one hour for pulses trains of 500 ms (Wegener, Keese et al. 2002). Wegener et al described these changes as more than simply the resealing of the pores in the cell membrane, but recovery of the morphology of the cell layer.
Cells remained in situ during stimulation
The live viewing experiment showed that the dynamic changes in electrode impedance values of cell-covered electrodes were related to a decrease in cell cover over the electrode when measured following fixation and staining. However, when the electrodes were viewed under a microscope during stimulation, no substantial changes to the level of cell cover over electrodes were seen. Very little difference in the structure of the cell layer was evident following the first block of stimulation, despite the distinct reduction in Ra. By the beginning of the second block of stimulation, there was a cluster of cells present in the centre of the electrode, surrounded by cells ofnormal growth. This change in morphology of the cell layer was still evident at the end of the second stimulation block. The presence of cells during stimulation, coupled with the loss of these cells following fixation and staining, suggest that changes were associated with the loss of adhesion of the cells to the electrode surface as a result of the electrical stimulus.
Secondary cell growth under the original cell layer
The change in morphology of cell cover over the stimulated electrodes may be similar to that seen in other studies (Wegener, Keese et al. 2002). This and subsequent studies at the same institution showed cell growth returning from the edges of electrodes following what is known as electrical cell wounding. Cell wounding involved purposefully creating targeted cell death through electrical stimulation in order to analyse the cell growth following stimulation cessation. These studies also showed a second cell layer was formed underneath the first disrupted layer (Saskia Miele, personal communication).
Possible explanations for electrical stimulation-induced impedance changes
Studies have been published on the effect of short-term AC stimulation on cell-covered electrodes (Ghosh, Keese et al. 1993; Wegener, Keese et al. 2002). These studies, both using planar gold electrodes, used voltage controlled sine-wave AC stimulation within the range of 1–5 V. They also showed a reduction in electrode resistance following stimulation that recovered following cessation of stimulation. Through the uptake of low molecular weight dyes, the authors were able to confirm the formation of pores in the cell membrane via electroporation. Excessive exposure to the stimulus was shown to cause cell death (Keese, Wegener et al. 2004). McCreery et al (2004) also cited electroporation as a possible cause for the cellular injury seen with in vivo electrical stimulation of the cochlear nucleus.
Electrical stimulation may also have been altering the effectiveness of the tight junctions connecting adjacent MDCK cells. However, the studies described above also involved MDCK cells and showed stimulation altered the porosity of cells rather than the function of the tight junctions (Wegener, Keese et al. 2002; Keese, Wegener et al. 2004).
The validity of the electroporation theory can be tested by incorporating techniques previously used in electroporation-specific publications. These involved the presentation of a molecular marker in the cell media that is only able to pass through the cell membrane when pores are opened. Thus incorporation of the marker into the cells signifies the presence and intensity of the porous nature of the membrane. Horseradish peroxidase and fluorescent probe Lucifer Yellow have been used previously in this way (Ghosh, Keese et al. 1993; Wegener, Keese et al. 2002).
Note that the electric fields applied in these experiments (using a minimum electrode spacing of around 0.2 cm and a maximum voltage of 3 V, an electric field of 15 V/cm would be formed) were markedly lower than the thousands of V/cm expected to cause electroporation (Weaver 2000; Wang 2009). However, as these are adherent cells, the 3 V excursion seen may have been sufficient to elicit the 0.5-1 V required to electroporate the cell membrane (Weaver 2000).
Further analysis would be required to confirm how biphasic current pulse stimulation affected the cells in these experiments. The strength of attachment of the cells to the electrode and substrate could be assessed at several stages of the stimulation block. This would determine whether the degree of adhesion changes with stimulation, and after what length of time.
Another possible explanation for how electrical stimulation might be acting to change the cellular morphology and resulting cell loss over the electrode involves the severity of stimulation applied. Studies involving the electrical stimulation of chronically implanted cerebral cortex electrodes suggested neuronal damage may be occurring through the production of a toxic chemical species (McCreery 2004). By delivering charge beyond the capacitive limits of the electrode, Faradic mechanisms become involved. While more charge is available using reversible Faradic reactions, charges delivered above these levels can irreversibly produce chemical species that may be cytotoxic. McCreery measured a slightly greater level of neuronal damage underneath the stimulated platinum electrodes compared with the exclusively capacitive interface of tantalum electrodes. This result suggested that the toxic chemical species produced with stimulation may have been a factor in cell damage (McCreery 2004). This method of cell damage does not hold with the two stimulation studies in this paper. The timing of the cell damage described in McCreery (2004) is expected to be much longer than that observed in this paper. Also, the charge used in this paper was considered to be below the irreversible Faradic limits of the gold electrodes, at which cell damage would be expected.
Stimulation at levels above capacitive limits yet below irreversible Faradic levels involves the reversible Faradic evolution of hydrogen and oxygen from the electrode surface (Huang, Carter et al. 2001). It is possible that any gas evolution occurring could be disrupting the adhesion of the cells on the electrode surface. Additional tests were conducted to assess the evolution of gas from these gold electrodes at the levels used in this paper. Gas was shown to form with current amplitudes of 0.5 mA when saline only was used as the electrolyte. The use of cell medium, including the protein-filled serum, showed no sign of gas evolution.
Experimental limitations
These studies used a single current pulse to measure impedance. While the single pulse offered much less stimulation than the pulse train method, it also seemed to be affecting electrode impedance values, in particular Zp. The cell-covered no-stimulation controls (group 3; Figure 1a) showed a rise in Zp during times of more frequent impedance measurements (i.e. between 37 and 43 hours, and 61 and 67 hours after initial cell plating). This rise in Zp was equivalent to that seen with cell-covered electrodes exposed to 0.05 mA stimulation. A reduction in Zp was measured with less frequent impedance measurements. This highlights the benefit of using a single pulse during impedance measurement to limit any electrochemical changes occurring due to the measurement pulses.
Due to the size of the electrodes, it was unlikely that the charge distribution over the surface of the electrodes was uniform (Behrend, Ahuja et al. 2008). This model does not attempt to assess the spatial or timing changes that would be present. There is work to suggest that electrical stimulation may also be pushing the electrodes beyond their preferred windows, with direct current (DC) build up and/or electrode corrosion as a result. Measurement of any DC excursion while using the electrodes in this manner could provide useful information in future experiments.
The outcome of the studies calls into question the similarity between these results and that seen with cochlear implant electrodes in vivo. While a drop in impedance is seen due to stimulation in both the in vitro and in vivo environments, there may be different mechanisms operating within these two environments. Changes in morphology were observed, disrupting the layer of cells on the surface of the stimulated in vitro electrodes. For implanted electrodes covered in a matrix of fibrous tissue, conjecture can only be made as to the cause of any impedance changes following stimulation. If the pore-formation theory is to be considered in vivo, electrical stimulation may cause changes in the permeability of the cell membranes involved in the fibrous tissue matrix, leading to lower impedance values. In this instance, the collagen matrix surrounding the electrode array may be acting in a manner similar to that of the tight junctions of the epithelial cells tested in vitro. That is, the collagen matrix may preserve the morphological structure of the fibrous tissue surrounding the electrodes during electrical stimulation while the electrical pathway through the tissue, and hence impedance, is altered.
5. Conclusions
These results show that changes in electrode impedance with electrical stimulation in vitro follow the same trends as seen with in vivo experiments. This helps to verify the in vitro model; however the underlying mechanisms may differ. A change in the porosity of the cellular layer was proposed to explain the alterations in electrode impedance in vitro. The loss of cells over the electrode surface viewed following fixation and staining further suggest the level of stimulation applied was creating localised changes to cell adhesion. However, as there is currently no visual technique available to test the changes that occur in vivo due to stimulation, these in vitro studies provide some insight into the possible mechanisms occurring in the body.
Figure 5.
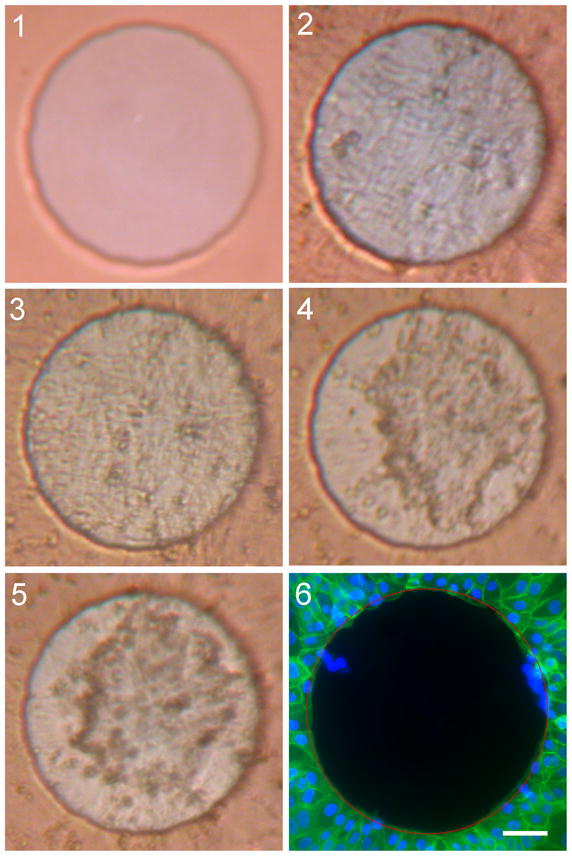
Photomicrographs of one electrode from Study B: live view. The electrode shown was from group 9, with photos taken at each time point: 1) prior to addition of cells; 2) prior to first stimulation block; 3) following first stimulation block; 4) prior to second stimulation block; and 5) following second stimulation block. The resulting cell cover over the electrodes is shown in the final image (6). Cells in 6 were fixed and stained with phalloidin FITC (green) and DAPI (blue). Red circle indicates electrode boundary. Scale bar: 50 μm.
Acknowledgments
This work was funded by the Cooperative Research Centre for Cochlear Implant and Hearing Aid Innovation (CRC HEAR). J774 and MDCK cell lines were gifts from Wendy Carter at The Walter and Eliza Hall Institute of Medical Research. Statistical guidance was provided by Associate Professor Ian Gordon from the Statistical Consulting Centre at the University of Melbourne. The epifluorescent microscope was purchased by the National Institutes of Health contract NIH-N01-DC-3-1005. Dr Stephen Scott-Young developed the software used for cell cover measurement. Prof Robert Shepherd is currently funded by the National Institutes of Health contract NIDCD HHS-N-263-2007-00053-c.
References
- Behrend MR, Ahuja AK, et al. Dynamic current density of the disk electrode double-layer. IEEE Trans Biomed Eng. 2008;55(3):1056–1062. doi: 10.1109/TBME.2008.915723. [DOI] [PubMed] [Google Scholar]
- Busby PA, Plant KL, et al. Electrode impedance in adults and children using the Nucleus CI24M cochlear implant. Cochlear Implants International. 2002;3(2):87–103. doi: 10.1179/cim.2002.3.2.87. [DOI] [PubMed] [Google Scholar]
- Charlet de Sauvage R, Lima da Costa D, et al. Electrical and physiological changes during short-term and chronic electrical stimulation of the normal cochlea. Hearing Research. 1997;110(1–2):119–134. doi: 10.1016/s0378-5955(97)00066-x. [DOI] [PubMed] [Google Scholar]
- Ghosh PM, Keese CR, et al. Monitoring electropermeabilization in the plasma membrane of adherent mammalian cells. Biophysical Journal. 1993;64(5):1602–1609. doi: 10.1016/S0006-3495(93)81531-5. [DOI] [PMC free article] [PubMed] [Google Scholar]
- Huang CQ, Carter PM, et al. Stimulus induced pH changes in cochlear implants: an in vitro and in vivo study. Ann Biomed Eng. 2001;29(9):791–802. doi: 10.1114/1.1397793. [DOI] [PubMed] [Google Scholar]
- Huang CQ, Shepherd RK, et al. Electrical stimulation of the auditory nerve: direct current measurement in vivo. IEEE Transactions on Biomedical Engineering. 1999;46(4):461–470. doi: 10.1109/10.752943. [DOI] [PubMed] [Google Scholar]
- Keese CR, Wegener J, et al. Electrical wound-healing assay for cells in vitro. Proceedings of the National Academy of Sciences of the United States of America. 2004;101(6):1554–1559. doi: 10.1073/pnas.0307588100. [DOI] [PMC free article] [PubMed] [Google Scholar]
- McCreery DB. Tissue Reaction to Electrodes: The problem of safe and effective stimulation of neural tissue. In: Horch KW, Dhillon GS, editors. Neuroprosthetics: Theory & Practice. Vol. 2. Singapore: World Scientific Publishing; 2004. pp. 592–612. [Google Scholar]
- McCreery DB, Agnew WF, et al. Charge density and charge per phase as cofactors in neural injury induced by electrical stimulation. IEEE Trans Biomed Eng. 1990;37(10):996–1001. doi: 10.1109/10.102812. [DOI] [PubMed] [Google Scholar]
- McCreery DB, Agnew WF, et al. Comparison of neural damage induced by electrical stimulation with faradaic and capacitor electrodes. Ann Biomed Eng. 1988;16(5):463–481. doi: 10.1007/BF02368010. [DOI] [PubMed] [Google Scholar]
- Newbold C, Richardson R, et al. An in vitro model for investigating impedance changes with cell growth and electrical stimulation: implications for cochlear implants. Journal of Neural Engineering. 2004;1(4):218–227. doi: 10.1088/1741-2560/1/4/005. [DOI] [PubMed] [Google Scholar]
- Newbold C, Richardson R, et al. Changes in biphasic electrode impedance with protein adsorption and cell growth. J Neural Eng. 2010;7(5):056011. doi: 10.1088/1741-2560/7/5/056011. [DOI] [PMC free article] [PubMed] [Google Scholar]
- Seligman PM. Electrode impedance variation with stimulation and time. Melbourne: Cochlear LTD; 2004. [Google Scholar]
- Shepherd RK, Serruto A, et al. Protective Effects of Patterned Electrical Stimulation on the Deafened Auditory System: Third Quarterly Progress Report. Melbourne: University of Melbourne; 2001. Protective Effects of Patterned Electrical Stimulation on the Deafened Auditory System. [Google Scholar]
- Wang Z. School of Electronic Engineering and Computer Science. PhD. London: University of London; 2009. Electromagnetic Field Interaction with Biological Tissues and Cells; p. 206. [Google Scholar]
- Weaver JC. Electroporation of Cells and Tissues. IEEE TRANSACTIONS ON PLASMA SCIENCE. 2000;28(1):24–33. [Google Scholar]
- Wegener J, Keese CR, et al. Recovery of adherent cells after in situ electroporation monitored electrically. Biotechniques. 2002;33(2):348, 350, 352. doi: 10.2144/02332rr01. passim. [DOI] [PubMed] [Google Scholar]
- Weiland JD, Anderson DJ. Chronic neural stimulation with thin-film, iridium oxide electrodes. IEEE Transactions on Biomedical Engineering. 2000;47(7):911–918. doi: 10.1109/10.846685. [DOI] [PubMed] [Google Scholar]