Abstract
Objectives
To determine the effect of using the NHS Choices website on primary care consultations in England and Wales. We examined the hypothesis that using NHS Choices may reduce the frequency of primary care consultations among young, healthy users.
Design
Two cross-sectional surveys of NHS Choices users.
Setting
Survey of NHS Choices users using an online pop-up questionnaire on the NHS Choices website and a snapshot survey of patients in six general practices in London.
Participants
NHS Choices website users and general practice patients.
Main outcome measures
For both surveys, we measured the proportion of people using NHS Choices when considering whether to consult their GP practice and on subsequent frequency of primary care consultations.
Results
Around 59% (n = 1559) of online and 8% (n = 125) of general practice survey respondents reported using NHS Choices in relation to their use of primary care services. Among these, 33% (n = 515) of online and 18% (n = 23) of general practice respondents reported reduced primary care consultations as a result of using NHS Choices. We estimated the equivalent capacity savings in primary care from reduced consultations as a result of using NHS Choices to be approximately £94 million per year.
Conclusions
NHS Choices has been shown to alter healthcare-seeking behaviour, attitudes and knowledge among its users. Using NHS Choices results in reduced demand for primary care consultations among young, healthy users for whom reduced health service use is likely to be appropriate. Reducing potentially avoidable consultations can result in considerable capacity savings in UK primary care.
Background
Many developed nations are already struggling to fund their health systems.1 In light of the current global economic crisis, health systems are under intense pressure to prioritize spending and provide the most cost-effective health services. The goal of effective health service provision has long been to generate and meet demand from those in most need, reducing avoidable pressure on health services and minimizing ‘low value activity’.2 The World Health Organization (WHO) recognizes the vitally important role of primary care in improving the efficiency of health systems worldwide.1
NHS Choices (www.nhs.uk) is the public facing website of the NHS in England and Wales, providing medical and lifestyle information and online health tools. NHS Choices is the first national, government-sponsored web-based information portal within the NHS. The programme is funded by the Department of Health and is currently in its third year of existence. Its user base has gradually increased and in 2008, 24 million unique users accessed the website, with an average of seven million visitors per month.3 NHS Choices aims to support primary care consultations by offering GPs, nurses and patients easily accessible health information. As yet there has been very limited evaluation of the impact of public use of NHS Choices on frequency and effectiveness of healthcare consultations in primary care.
Aims
The aim of this study was to explore public use of the NHS Choices website in relation to primary care health services.
Hypothesis
The primary hypothesis in this study was that NHS Choices may reduce the frequency of primary care consultations among young, healthy users who may not require face-to-face consultation.
Methods
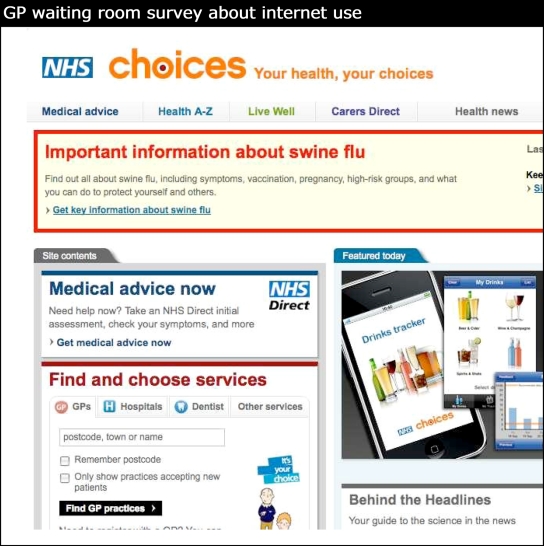
We developed two surveys to examine public use of the NHS Choices website in relation to their use of primary care healthcare services, specifically consultations with general practitioners (GPs) and practice nurses. One survey was targeted at users of the NHS Choices website and surfaced as a pop-up to people accessing the site; the other was administered in six general practice waiting rooms as a supported, self-completion questionnaire. The combination of the two approaches permitted generation of a large sample size while addressing the potential for selection and responder bias if only surveying online responders. The sample of NHS Choices users responding via the GP practice survey was small but did not suffer from these biases. As such, the GP practice survey served to validate the online survey findings, while the online survey ascertained sufficient numbers to power the study.
Study period and participants
This study took place between 1 November 2009 and 31 March 2010. The GP practice survey was undertaken in London and the NHS Choices survey was conducted online, targeted at UK-based users of the service (in order to participate, respondents were asked to enter the first three digits of their postcode). No subjects under the age of 18 years were contacted directly although some individuals below this age may have completed the online NHS Choices questionnaire. For the GP practice survey participants were recruited from the practice waiting-room, among individuals awaiting a consultation with any primary care practitioner that day (GPs or practice nurses). It was clearly stated on all documentation that participants may self-exclude at any time before or during either survey. No sensitive personal identifiable information was collected in either questionnaire and both indicated that responses would remain anonymous and confidential.
Questionnaire development
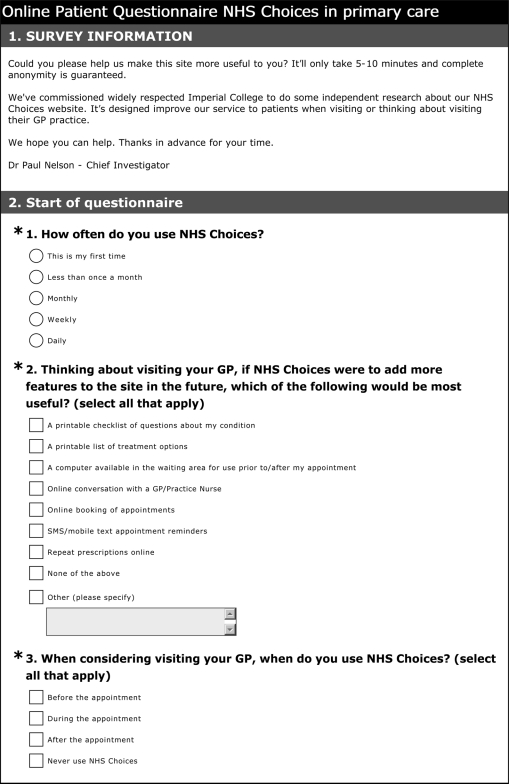
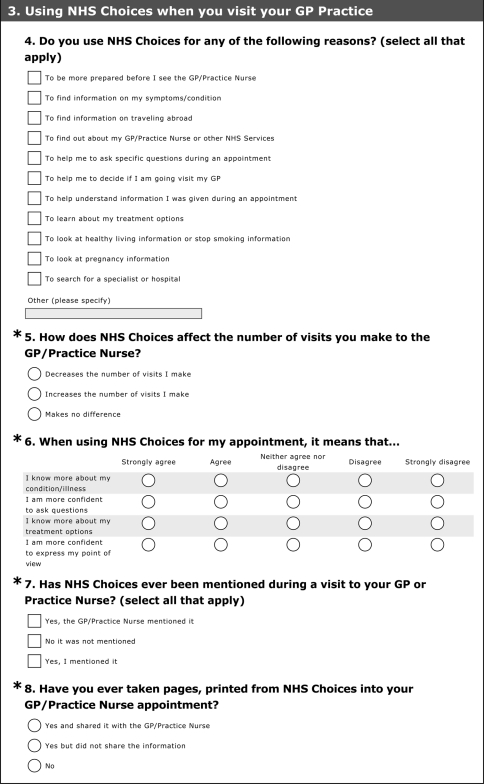
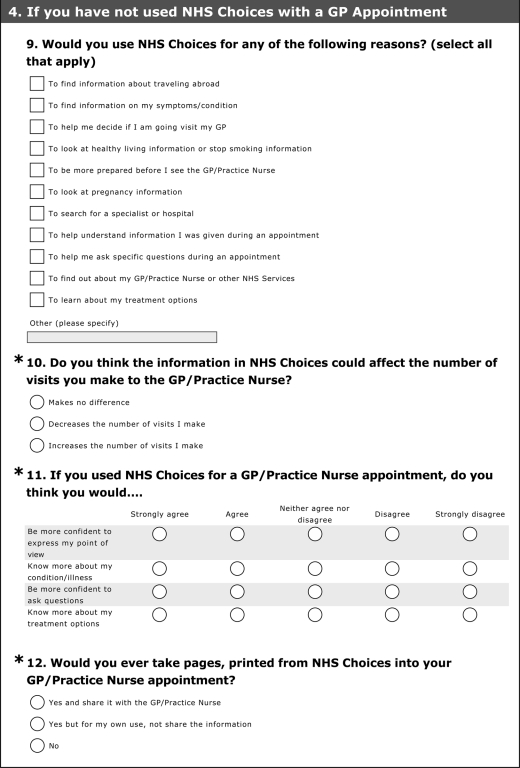
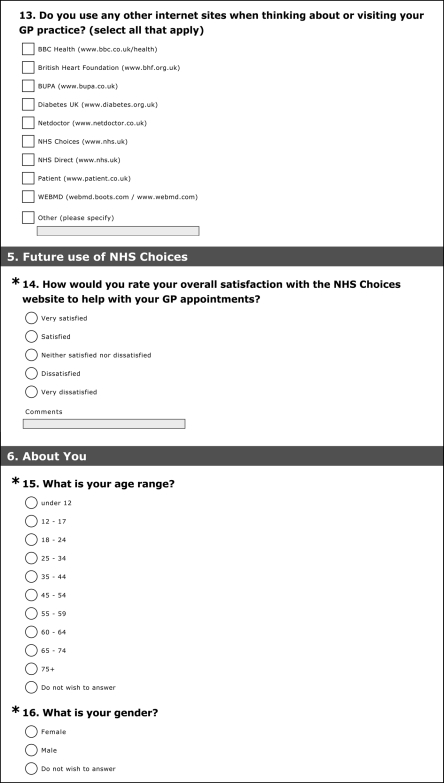
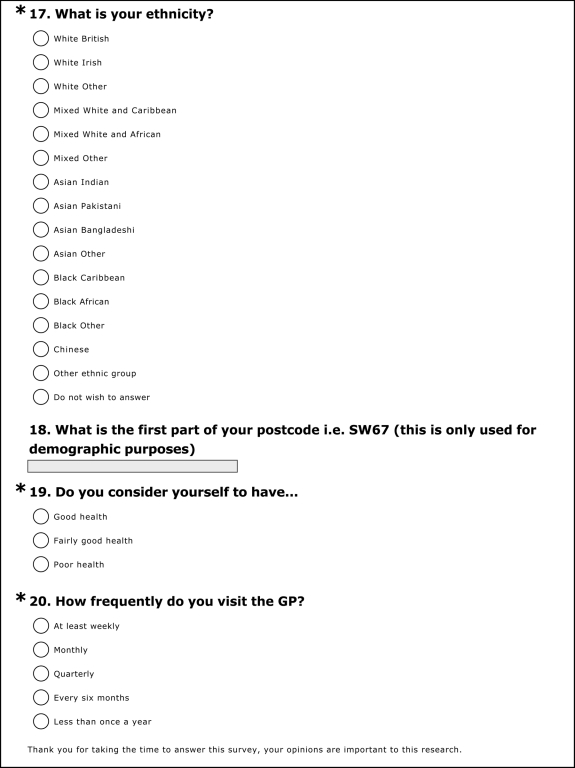
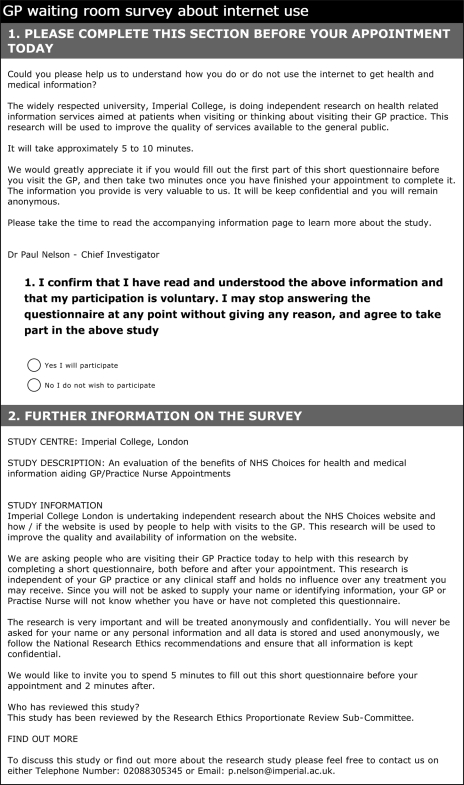
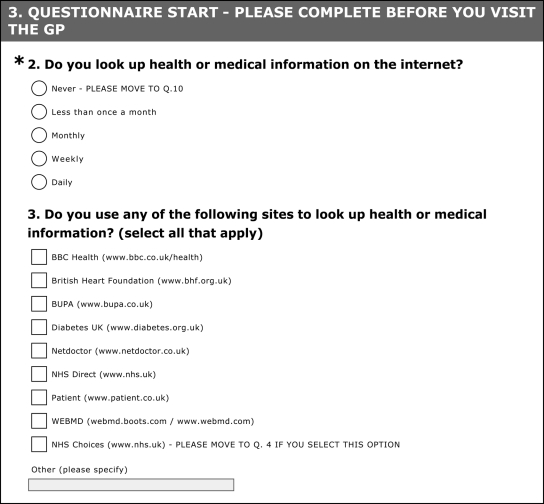
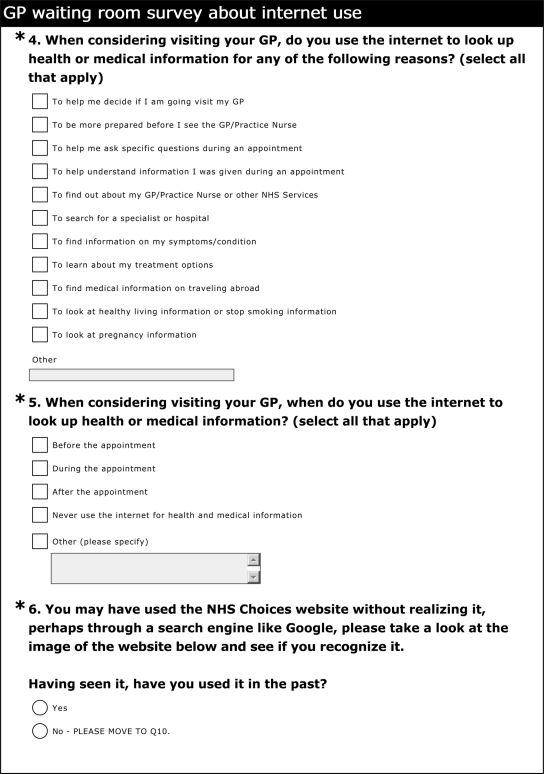
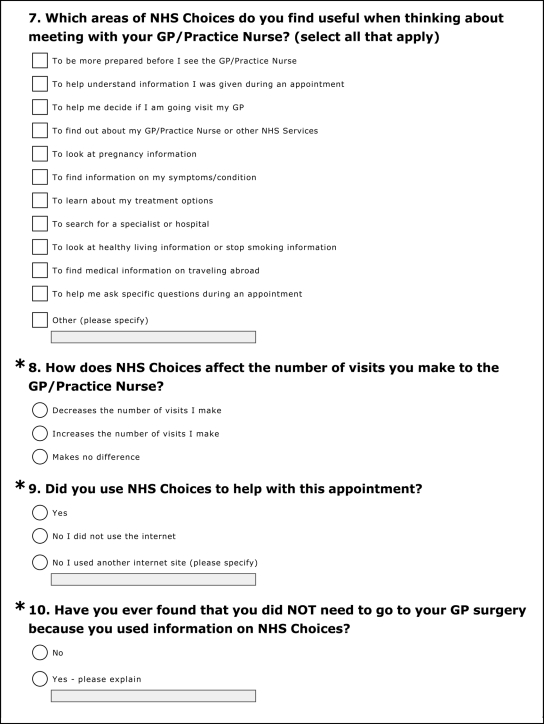
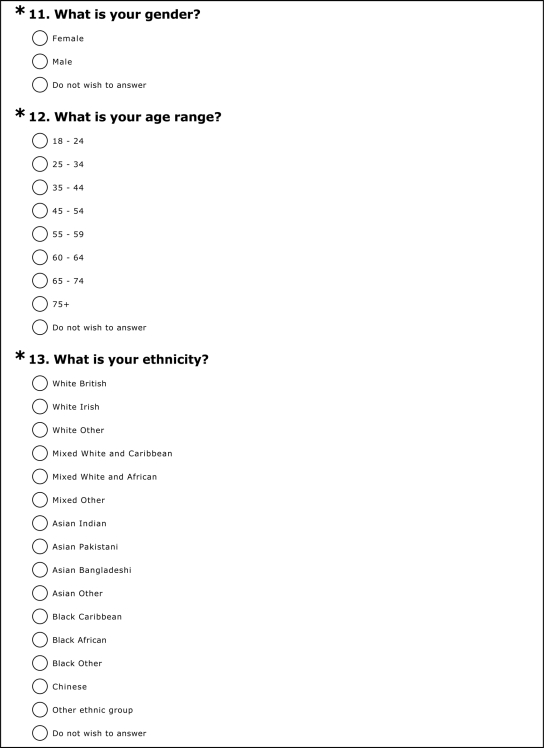
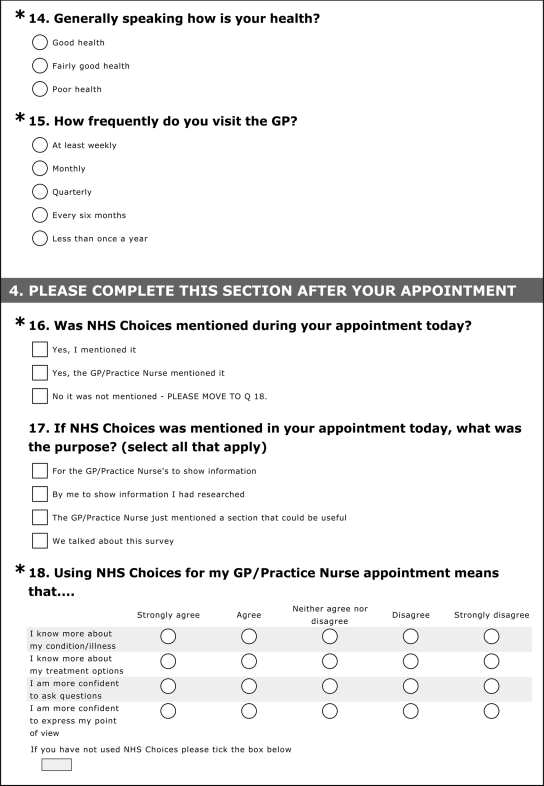
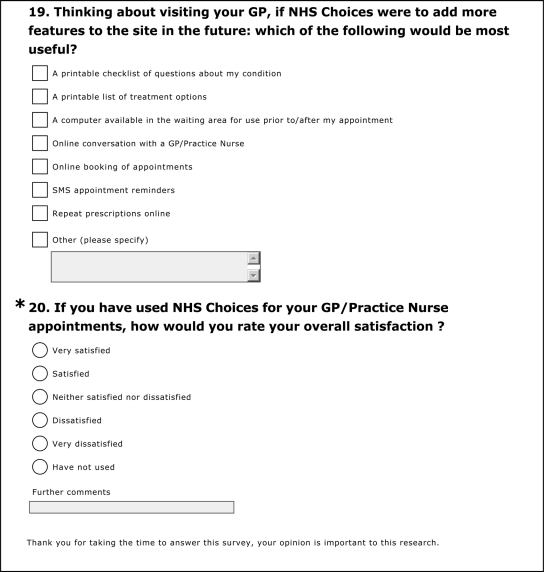
Both questionnaires were designed to determine the effect on patients of using the NHS Choices website (as well as other health websites). The questionnaires employed categorical and Likert scales in several questions as a basis for obtaining interval level estimates on a continuum. This also permitted testing of the hypothesis that statements reflect increasing levels of a trait or attitude. We were aware of the potential for respondents to avoid using extreme response categories (central tendency bias); agree with statements as presented (acquiescence bias); and the possibility of portraying NHS Choices in a favourable light (social desirability bias). Where possible, we employed balanced keying (an equal number of positive and negative statements) to obviate the problem of acquiescence bias. We carried out pre-piloting within the development of the draft questionnaires and a pilot period permitted final adjustments to be made. Both questionnaires can be found in Appendix 1. Anonymous outcomes data were collected and demographic information such as age, sex and ethnicity.
GP practice survey
A cross-sectional survey of patients visiting their GP was conducted using paper questionnaires, distributed in waiting rooms within six general practices in London, over a 10-day continuous period during February and March 2010. Practices were recruited with assistance from the NHS Choices stakeholder engagement team and the NIHR Comprehensive Local Research Network; one was the host practice of an author of this study (AM). Patient information leaflets were handed out and written participant consent was explicitly obtained before distributing the questionnaires, which required approximately five minutes to complete. Participation and non-participation were recorded.
Online survey of NHS Choices users
We used Surveymonkey survey software to deploy our questionnaire to NHS Choices users over a one-month period from 12 January to 12 February 2010. Visitors to the NHS Choices website were invited to participate in a pop-up online questionnaire lasting approximately five minutes. Those who clicked through to the survey after being invited to participate were shown a consent page with participant information. Only if they consented by choosing the appropriate option after reading the information, did the survey commence.
Cost-saving estimation
An economic analysis was undertaken and all costs were identified from the perspective of the NHS. The key issue was to estimate the potential cost savings from using the NHS Choices website by multiplying the number of ‘avoided visits’ by the unit cost of each visit using the national tariff. From the current published NHS Choices user figures, NHS Choices website questionnaire and GP practice survey, an average number of ‘avoided visits’ to a GP over a 12-month period could be calculated using the following formula: Number of avoided visits per year = number of unique visitors per year * percentage of use in relation to GP consultation * effect of NHS Choices on frequency of GP visits. This number was then multiplied by the published national price list to estimate the potential overall gross cost saving of the NHS Choices website. The cost of providing the NHS Choices website was obtained from the contractor directly. The annual net saving was estimated by subtracting the cost of providing the service from the gross saving from the website.
Data analysis
All data were securely and anonymously stored. We calculated proportions of participants who chose each possible response for any given question, using the total number of responders for the denominator; 95% confidence intervals were also estimated for each percentage value from the samples surveyed. STATA 10.0 software was used for all data analysis.
Results
Online survey of NHS Choices users
Our online survey of NHS Choices users showed that 1559 out of 2631 respondents (59%) use the NHS Choices website to guide their use of primary care services. Respondents who use the website when thinking about GP consultations tended to be women (75%), aged under 45 years (56%) and of white ethnicity (82%) (Table 1). Among these respondents, 23% were first-time users and 34% used NHS Choices monthly or more frequently. This group tended to have good or fairly good self-rated health (80%) and generally consulted primary care services infrequently, with only 13% visiting their GP monthly or more often. These respondents rated the following aspects of the NHS Choices website as the most useful when considering GP consultations; to find information about their symptoms or condition (80%), to help decide whether to visit their GP (54%), to learn about treatment options (39%) and to help understand information given during an appointment (34%).
Table 1.
Summary of questionnaire responses from online NHS Choices users, who reported using the website in relation to GP consultations (n = 1559)
| Responses | Frequency | % | 95% confidence intervals |
|---|---|---|---|
| Sex | |||
| Women | 1164 | 74.7 | 72.4–76.8 |
| Men | 207 | 13.3 | 11.6–15.1 |
| Did not wish to answer | 188 | 12.1 | 10.5–13.8 |
| Age group (years) | |||
| Under 18 | 45 | 2.9 | 2.1–3.8 |
| 18–24 | 209 | 13.4 | 11.8–15.2 |
| 25–34 | 364 | 23.3 | 21.3–25.5 |
| 35–44 | 255 | 16.4 | 14.6–18.3 |
| 45–54 | 284 | 18.2 | 16.3–20.2 |
| 55–59 | 81 | 5.2 | 4.1–6.4 |
| 60–64 | 87 | 5.6 | 4.5–6.8 |
| 65–74 | 35 | 2.2 | 1.6–3.1 |
| 75 + | 11 | 0.7 | 0.4–1.3 |
| Did not answer | 188 | 12.1 | 10.5–13.8 |
| Ethnicity | |||
| White British | 1182 | 75.8 | 73.6–77.9 |
| White Irish | 27 | 1.7 | 1.1–2.5 |
| White | 69 | 4.4 | 3.5–5.6 |
| Mixed white and Caribbean | 3 | 0.2 | 0.0–0.5 |
| Mixed White and African | 2 | 0.1 | 0.0–0.5 |
| Mixed other | 7 | 0.4 | 0.2–0.9 |
| Asian Indian | 15 | 1.0 | 0.5–1.6 |
| Asian Pakistani | 3 | 0.2 | 0.0–0.5 |
| Asian Bangladeshi | 7 | 0.4 | 0.2–0.9 |
| Asian Other | 7 | 0.4 | 0.2–0.9 |
| Black Caribbean | 5 | 0.3 | 0.1–0.7 |
| Black African | 12 | 0.8 | 0.4–1.3 |
| Black Other | 1 | 0.1 | 0.0–0.4 |
| Chinese | 6 | 0.4 | 0.1–0.8 |
| Other ethnic group | 6 | 0.4 | 0.1–0.8 |
| Did not answer | 207 | 13.3 | 11.6–15.1 |
| Self-rated health | |||
| Good health | 594 | 38.1 | 35.7–40.6 |
| Fairly good health | 650 | 41.7 | 39.2–44.2 |
| Poor health | 136 | 8.7 | 7.4–10.2 |
| Did not answer | 179 | 11.5 | 9.9–13.2 |
| Frequency of GP consultations | |||
| At least weekly | 14 | 0.9 | 0.5–1.5 |
| Monthly | 187 | 12.0 | 10.4–13.7 |
| Quarterly | 415 | 26.6 | 24.4–28.9 |
| Every six months | 421 | 27.0 | 24.8–29.3 |
| Less than once a year | 343 | 22.0 | 20.0–24.1 |
| Did not answer | 179 | 11.5 | 9.9–13.2 |
| Frequency of NHS Choices use | |||
| First time | 354 | 22.7 | 20.6–24.9 |
| Less than once a month | 678 | 43.5 | 41.0–46.0 |
| Monthly | 348 | 22.3 | 20.3–24.5 |
| Weekly | 149 | 9.6 | 8.1–11.1 |
| Daily | 30 | 1.9 | 1.3–2.7 |
| Features respondents agree would improve use of NHS Choices in relation to GP consultations | |||
| Online booking of appointments | 856 | 54.9 | 52.4–57.4 |
| Repeat prescriptions online | 812 | 52.1 | 49.6–54.6 |
| A printable checklist of questions about my condition | 720 | 46.2 | 43.6–48.7 |
| A printable list of treatment options | 587 | 37.7 | 35.2–40.1 |
| Online conversation with a GP/Practice Nurse | 797 | 51.1 | 48.6–53.6 |
| SMS/mobile text appointment reminders | 420 | 26.9 | 24.8–29.2 |
| A computer in the waiting area for use prior to/after my appointment | 54 | 3.5 | 2.6–4.5 |
| Satisfaction with use of NHS Choices in relation to GP consultations | |||
| Very satisfied | 252 | 18.1 | 14.4–18.1 |
| Satisfied | 794 | 57.1 | 48.4–53.4 |
| Neither satisfied nor dissatisfied | 334 | 24 | 19.4–23.5 |
| Dissatisfied | 7 | 0.5 | 0.2–0.9 |
| Very Dissatisfied | 4 | 0.3 | 0.1–0.7 |
| Did not answer | 168 | 10.8 | 9.3–12.4 |
| Patient who agree/strongly agree that use of NHS Choices for their GP appointments means… | |||
| I know more about my condition/illness | 1189 | 76.3 | 74.1–78.4 |
| I know more about my treatment options | 1082 | 69.4 | 67.0–71.7 |
| I am more confident to ask questions | 984 | 63.1 | 60.7–65.5 |
| I am confident to express my point of view | 870 | 55.8 | 53.3–58.3 |
| When respondents use Internet information relating to a GP consultation | |||
| Before the appointment | 1299 | 83.3 | 81.4–85.1 |
| During the appointment | 33 | 2.1 | 1.5–3.0 |
| After the appointment | 4 | 0.4 | 0.1–0.7 |
| Most useful aspects of NHS Choices when thinking about consulting a GP | |||
| To find information on my symptoms/condition | 1250 | 80.2 | 78.1–82.1 |
| To learn about my treatment options | 600 | 38.5 | 36.1–41.0 |
| To help me decide if I am going to visit my GP | 846 | 54.3 | 51.8–56.8 |
| To be more prepared before I see the GP/Practice Nurse | 504 | 32.3 | 30.0–34.7 |
| To help understand information I was given during an appointment | 530 | 34.0 | 31.6–36.4 |
| To help me ask specific questions during an appointment | 367 | 23.5 | 21.5–25.7 |
| To search for a specialist or hospital | 113 | 7.2 | 6.0–8.6 |
| To find out about my GP/Practice Nurse or other NHS Services | 153 | 9.8 | 8.4–11.4 |
| To find medical information on travelling abroad | 149 | 9.6 | 8.1–11.1 |
| To look at pregnancy information | 222 | 14.2 | 12.5–16.1 |
| To look at healthy living information or stop smoking information | 171 | 11 | 9.5–12.6 |
| Mention of NHS Choices during a GP consultation | |||
| Yes, by the GP/Practice Nurse | 74 | 4.7 | 3.7–5.9 |
| Yes, by patient | 110 | 7.1 | 5.8–8.4 |
| Effect of NHS Choices on frequency of GP visits | |||
| Decreases the number of visits I make | 515 | 33.0 | 30.7–35.4 |
| Increases the number of visits I make | 43 | 2.8 | 2.0–3.7 |
| Makes no difference | 839 | 53.8 | 51.3–56.3 |
| Did not answer | 162 | 10.4 | 8.9–12.0 |
Among respondents who use the website in relation to their GP consultations, 33% reported use of the website reduced their frequency of GP visits and 3% reported it increased their frequency of GP visits. Those reporting reduced primary care use, tended to be young (67% under 45 years), women (84%), infrequent primary care users (88% visiting a GP quarterly or less often), with good or fairly good self-rated health (90%). Only 0.8% of those reporting decreases in GP visits were dissatisfied with their use of NHS Choices.
GP practice survey
There were 1581 respondents across the six practices surveyed representing a participation rate of 69% (Appendix 2). There was some heterogeneity in responses between practices, ranging from 51–81%. Responses from all six practices were pooled to increase the study size. Of the 1581 respondents, 1555 completed questionnaires (98% completion), of whom 1108 (71%) reported using the Internet to search for health information. A total of 125 general practice survey respondents reported using the NHS Choices website (8% of total sample or 11% of responders to this question). The majority of NHS Choices users were women (75%), aged under 45 years (75%) and of white ethnicity (71%). Ninety-five percent of these respondents had either good or fairly good self-rated health, echoed by infrequent use of primary care services, with only 16% visiting their GP monthly or more often (Table 2). Among these respondents, 27% had not used NHS Choices specifically in relation to the GP consultation and 37% had used it for this purpose and were satisfied with its use. Most respondents used NHS Choices before visiting their GP (79%) with many also using it afterwards (54%). Nineteen percent had used NHS Choices in relation to the appointment for which they were attending.
Table 2.
A summary of questionnaire responses among GP waiting room survey participants who have used NHS Choices (n = 125)
| Responses | Frequency | % | 95% confidence intervals |
|---|---|---|---|
| Sex | |||
| Female | 94 | 75.2 | 66.7–82.5 |
| Male | 31 | 24.8 | 17.5–33.3 |
| Age group (years) | |||
| 18–24 | 11 | 8.8 | 4.5–15.2 |
| 25–34 | 54 | 43.2 | 34.4–52.4 |
| 35–44 | 29 | 23.2 | 16.1–31.6 |
| 45–54 | 18 | 14.4 | 8.8–21.8 |
| 55–59 | 4 | 3.2 | 0.9–8.0 |
| 60–64 | 3 | 2.4 | 0.5–6.9 |
| 65–74 | 4 | 3.2 | 0.9–8.0 |
| 75 + | 2 | 1.6 | 0.1–5.7 |
| Ethnicity | |||
| White British | 68 | 54.4 | 45.3–63.3 |
| White Irish | 3 | 2.4 | 0.5–6.9 |
| White British others | 18 | 14.4 | 8.8–21.8 |
| Mixed white and Caribbean | 3 | 2.4 | 0.5–6.9 |
| Mixed White and African | 0 | 0.0 | 0.0–2.9 |
| Mixed other | 5 | 4.0 | 1.3–9.1 |
| Asian Indian | 1 | 0.8 | 0.0–4.4 |
| Asian Pakistani | 1 | 0.8 | 0.0–4.4 |
| Asian Bangladeshi | 0 | 0.0 | 0.0–2.9 |
| Asian Other | 2 | 1.6 | 0.1–5.7 |
| Black Caribbean | 7 | 5.6 | 2.3–11.2 |
| Black African | 6 | 4.8 | 1.8–10.2 |
| Black Other | 1 | 0.8 | 0.0–4.4 |
| Chinese | 3 | 2.4 | 0.5–6.9 |
| Other ethnic group | 4 | 3.2 | 0.9–8.0 |
| Did not answer | 3 | 2.4 | 0.5–6.9 |
| Self-rated health | |||
| Good health | 80 | 64.0 | 54.9–72.4 |
| Fairly good health | 39 | 31.2 | 23.2–40.1 |
| Poor health | 5 | 4.0 | 1.3–9.1 |
| Did not answer | 1 | 0.8 | 0.0–4.4 |
| Frequency of GP consultations | |||
| At least weekly | 1 | 0.8 | 0.0–4.4 |
| Monthly | 19 | 15.2 | 9.4–22.7 |
| Quarterly | 37 | 29.6 | 21.8–38.4 |
| Every six months | 47 | 37.6 | 29.1–46.7 |
| Less than once a year | 21 | 16.8 | 10.7–24.5 |
| NHS Choices mentioned in GP consultation that day | |||
| Yes, I mentioned it | 7 | 5.6 | 2.3–11.2 |
| Yes, the GP/Practice Nurse mentioned it | 1 | 0.8 | 0.0–4.4 |
| No, it was not mentioned | 114 | 91.2 | 84.8–95.5 |
| Did not answer | 3 | 2.4 | 0.5–6.9 |
| Features respondents agree would improve use of NHS Choices in relation to GP consultations | |||
| Online booking of appointments | 73 | 58.4 | 49.2–67.1 |
| Repeat prescriptions online | 70 | 56.0 | 46.8–64.9 |
| A printable checklist of questions about my condition | 46 | 36.8 | 28.4–45.9 |
| A printable list of treatment options | 49 | 39.2 | 30.6–48.3 |
| Online conversation with a GP/Practice Nurse | 54 | 43.2 | 34.4–52.4 |
| SMS/mobile text appointment reminders | 42 | 33.6 | 25.4–42.6 |
| A computer in the waiting area for use prior to/after my appointment | 16 | 12.8 | 7.5–20.0 |
| Satisfaction with use of NHS Choices if have used the website in relation to GP consultations | |||
| Very satisfied | 7 | 5.6 | 2.3–11.2 |
| Satisfied | 39 | 31.2 | 23.2–40.1 |
| Neither satisfied nor dissatisfied | 14 | 11.2 | 6.3–18.1 |
| Dissatisfied | 0 | 0.0 | 0.0–2.9 |
| Very Dissatisfied | 1 | 0.8 | 0.0–4.4 |
| Has not used | 34 | 27.2 | 19.6–35.9 |
| Did not answer | 30 | 24.0 | 16.8–32.5 |
| Patient who agree/strongly agree that use of NHS Choices for their GP appointments means… | |||
| I know more about my condition/illness | 82 | 65.6 | 56.6–73.9 |
| I know more about my treatment options | 76 | 60.8 | 51.7–69.4 |
| I am more confident to ask questions | 73 | 58.4 | 49.2–67.1 |
| I am confident to express my point of view | 63 | 50.4 | 41.3–59.5 |
| When respondents use internet information relating to a GP consultation | |||
| Before the appointment | 99 | 79.2 | 71.0–85.9 |
| During the appointment | 1 | 0.8 | 0.0–4.4 |
| After the appointment | 67 | 53.6 | 44.5–62.6 |
| Most useful aspects of NHS Choices when thinking about consulting a GP | |||
| To find information on my symptoms/condition | 69 | 55.2 | 46.0–64.1 |
| To learn about my treatment options | 44 | 35.2 | 26.9–44.2 |
| To help me decide if I am going to visit my GP | 49 | 39.2 | 30.6–48.3 |
| To be more prepared before I see the GP/Practice Nurse | 37 | 29.6 | 21.8–38.4 |
| To help understand information I was given during an appointment | 37 | 29.6 | 21.8–38.4 |
| To help me ask specific questions during an appointment | 17 | 13.6 | 8.1–20.9 |
| To search for a specialist or hospital | 22 | 17.6 | 11.4–25.4 |
| To find out about my GP/Practice Nurse or other NHS Services | 19 | 15.2 | 9.4–22.7 |
| To find medical information on travelling abroad | 15 | 12.0 | 6.9–19.0 |
| To look at pregnancy information | 12 | 9.6 | 5.1–16.2 |
| To look at healthy living information or stop smoking information | 16 | 12.8 | 7.5–20.0 |
| Effect of NHS Choices on frequency of GP visits | |||
| Decreases the number of visits I make | 23 | 18.4 | 12.0–26.3 |
| Increases the number of visits I make | 2 | 1.6 | 0.2–5.7 |
| Makes no difference | 88 | 70.4 | 61.6–78.2 |
| Did not answer | 12 | 9.6 | 5.1–16.1 |
| Mention of NHS Choices during a GP consultation | |||
| Yes, by the GP/Practice Nurse | 1 | 0.8 | 0.0–4.4 |
| Yes, by patient | 7 | 5.6 | 2.3–11.2 |
| Was NHS Choices used to help with appointment today? | |||
| Yes | 24 | 19.2 | 12.7–27.2 |
| No, did not use Internet for this appointment | 87 | 69.6 | 60.7–77.5 |
| No, use another Internet site | 4 | 3.2 | 0.9–8.0 |
| Did not answer | 10 | 8.0 | 3.9–14.2 |
The majority of NHS Choices users responding to the GP practice survey reported that using the website made no difference to their frequency of primary care consultations (70%), 18% reported that it decreased their frequency of visits and 2% said it increased frequency of visits. Decreased GP visits were again generally reported in younger respondents (74% aged under 45 years), with good or fairly good self-rated health (96%). Although the effect of using NHS Choices on reducing GP consultations was attenuated in the GP practice survey (18% compared to 33% among online respondents), this still lends support to our similar findings from the online survey of NHS Choices users. The demographic distribution and self-rated health of NHS Choices users reporting decreased primary care use were similar across both surveys.
Cost-saving estimation
According to the current published NHS Choices user figures, there are 24 million unique visitors per year. From our study, 59% of these use NHS Choices in relation to consulting a GP. Therefore, we estimate there were 14,160,000 visits to the NHS Choices website annually, relating to consulting a GP. The effect of the website on frequency of GP visits was calculated based on differences between patients' responses about whether use of NHS Choices ‘decreases the number of visits I make’ or ‘increases the number of visits I make’. For the online questionnaire (n = 1559), 33% of patients reported NHS Choices decreases the number of visits, whereas 3% reported that it increases the number of visits. From the GP practice questionnaire (n = 125), 18% reported NHS Choices decreases the number of visits and 2% said it increases visits. A weighted algorithm was used to take into account the sample sizes in the two separate surveys and we estimated that overall 29.5% of patients reported using NHS Choices reduced their frequency of GP consultations. It would seem reasonable to assume then that 29.5% of NHS Choices users would otherwise have made at least one GP appointment if they had not accessed the website. Therefore we estimate the overall annual number of GP visits avoided by NHS Choices users to be 4,177,200.
The gross saving was calculated by multiplying the number of avoided visits with a published national price. We took into consideration the range of practitioners that provide primary care consultations. Figures published by the NHS Information Centre show that in 2008–2009, 62% of consultations were undertaken by GPs, 34% by nurses and 4% by ‘other clinicians’.4 From Curtis the average price per consultation by a GP is estimated to be £36 compared to £12 by a nurse.5 We assumed that the cost of a consultation provided by ‘other clinicians’ was the average of the total cost by GPs and nurses, so the overall average cost per primary care visit would be approximately £27.50. Using this figure, the basic cost saving of the website was therefore estimated to be £114,873,000.
The annual cost for core services of NHS Choices was estimated at around £25 million a year. This is the contract which the Department of Health has with the provider to run the full end to end NHS Choices service including content production, data and directories, technical hosting, project management, contract value plus other costs, et cetera (personal communication from B Gann). Therefore the annual estimated net cost saving of NHS Choices is £94,715,200. This estimate does not include the additional cost savings as a result of reduced consultation times due to patients having a better understanding of their condition through using NHS Choices. It also does not include the potential cost savings for the NHS if users adopt the health advice provided by the website. This is therefore a conservative cost saving estimate.
Discussion
Main findings
In this study, people reported that use of NHS Choices modified their health knowledge, attitudes and healthcare seeking behaviour. This has the potential to result in significant cost and efficiency savings for primary care services in England and Wales. Reported reduced demand for primary care services appears to be appropriate among young, healthy, infrequent consulters, who report being satisfied with the effects of using NHS Choices on their primary care service use.
Strengths and limitations
Our study sampled a large population and achieved high response rates. It focused on a simple prior hypothesis and used alternative study contexts (online and GP practice) to allow comparison and to account for potential biases (particularly selection bias). It was not possible to obtain information about how characteristics of responders to either survey may have differed from non-responders. However, we have insight into how non-responders to the online questionnaire may have responded, from using our GP practice survey, since those who reported using NHS Choices were a random sample of all NHS Choices users, unlike the online survey respondents. As findings from this group and those who completed the online survey were very similar, this serves to validate the results of our sample of online NHS Choices users.
Our study did not examine primary care activity data and so we cannot be sure that survey reported expectation of decreased or increased consultations would have translated into real activity figures. In theory, people could have inaccurately reported their consultation use (recall bias). However, there was no benefit to them to do so and no clear preferred option, so variation in their assessment is likely to have been random. There was a potential for responder bias in our selective survey of online NHS Choices users, but we were able to show little evidence of it by comparison with our GP practice survey respondents. Although the effect of reducing GP consultations was attenuated in the GP practice survey (18%) compared to the online (33%) respondents, similar findings in both surveyed populations improves the robustness and generalizability of this study.
Putting our findings into context
With an ageing population and ever increasing prevalence of preventable long-term chronic conditions, the UK government must prioritize healthcare spending and provide the most efficient and cost-effective services. This study highlights the potential of new media methods of communication to promote changes in healthcare-seeking behaviour and to reduce potentially avoidable/unnecessary demand for health services, at a population scale. Our study suggests NHS Choices may be a cost-effective method of reducing demand for primary care services.
Self-care
In the primary care setting people frequently interact with a GP for decision support, to determine whether they require clinical treatment and further health service use. Patient surveys suggest that approximately 71% of patients using information from websites in clinical consultations require their GP's opinion rather than a specific health intervention.6 Some consultations are therefore potentially avoidable if it is possible to offer decision support outside the consultation setting. For effective decision-making, people require reliable information, understanding and empowerment. Innovations such as the NHS Direct telephone service, while increasing access to information and improving understanding, do so at the expense of disempowering the individual to make the decision about whether they need to access health services. NHS Direct, by employing cautious thresholds for advising users to visit their GP, has limited ability to help callers avoid consultation with the GP and may indeed cause unnecessary consultations. Internet-based health resources such as NHS Choices represent an advance that avoids disempowering the individual by providing easily accessible, trusted information, outside the sphere of responsibility of the NHS. Users are liberated to make the decision about whether or not to consult themselves and our survey showed high user satisfaction with the impact of NHS Choices use on their frequency of GP consultations.
Anxiety surrounding the potential of Internet sources of health information to misguide or mislead the public has been widely debated.6,7 Clinicians have reported concerns regarding resulting inappropriate consultations or intervention requests.8,9 Evidence also suggests that with oversupply of mixed quality information, the public may lack confidence to appraise website content and make key consultation decisions based on information of unknown provenance.6 However, these concerns are minimized when using a quality assured, publicly funded website such as NHS Choices, as the public can easily recognize it as a trustworthy, reliable information source. Our surveys suggest that any initial fears that using websites to access health information would lead to inappropriate supply induced demand appear to be ill-founded.
Accessing health information online can empower individuals by helping them to self-diagnose, identify the causes of their symptoms as benign, or learn about treatment options without contacting a health professional. Information accessed through NHS Choices may improve the overall utility of any resulting consultations by reducing the inequality gap in knowledge between patients and professionals. Patient self-confidence is increased when they are reassured of their genuine health service need, prior to consulting. The privacy and anonymity of accessing health information websites rather than visiting a health professional may be preferred by those with concerns they are reluctant or embarrassed to discuss face-to-face. Using the Internet is a more convenient, time-efficient way for many people to decide whether to access health services. Our surveys showed responders were keen for NHS Choices to extend its tools to improve ease of access to services and health knowledge. The public are increasingly demanding control of their healthcare and the potential for personalized health services and self-care is firmly on the political agenda. This new health white paper Equity and Excellence: Liberating the NHS highlighted the importance of individual empowerment for health and the need for people to be ‘helped to help themselves’.10
Previous studies have highlighted the successful use of websites as public health tools.11–13 Forum-based networking websites facilitate mutual support among patients suffering similar conditions.14 Other studies have shown the value of web-based decision aids to change attitudes, for example educating parents about the benefits of MMR vaccination resulted in improved positive opinions towards use of the vaccine.15 Our surveys support existing evidence for the efficacy of web-based decision aids and demonstrate how population scale, yet individually targeted dissemination of health information through trusted websites (and potentially other digital media such as mobile phone apps) can appropriately alter healthcare-seeking behaviour in the primary care setting.
Although we have not measured any actual patient health outcomes, these findings suggest efficiency of GP consultation time can be improved. This could indirectly improve quality of primary care services as GPs are able to concentrate on patients most in need, which may in turn potentially impact on health outcomes. In addition to the estimated cost savings from reduced avoidable demand for primary care services, the health advice provided by NHS Choices may also substantially reduce demand, which requires additional investigation. Further work is required to determine the existing and potential impact of NHS Choices on healthcare-seeking behaviour in other domains of the NHS such as hospital emergency departments and outpatients. Further quantitative and qualitative research needs to evaluate use of NHS Choices for different patient pathways and disease groups. This will aid a full cost evaluation of the effect of NHS Choices across NHS services and the whole patient journey.
Conclusion
This study represents the first demonstration of the potential for high quality Internet information service provision to influence individual healthcare-seeking behaviour and public demand for primary care services, at a population scale. NHS Choices has proved to be a popular and effective decision support tool permitting more efficient self-management and self-triage by the public, reducing the need to involve health professionals and thus reducing avoidable consultations for diagnostic decision support.
DECLARATIONS
Competing interests
PN previously worked at NHS Choices as public health advisor for a 14-month period, terminating before this work was commissioned. NHS Choices commissioned this research in 2009 to Imperial College London after tending to a panel of universities
Funding
This study was funded by the Department of Health. The Department of Primary Care & Public Health at Imperial College is grateful for support from the NIHR Biomedical Research Centre scheme, the NIHR Collaboration for Leadership in Applied Health Research & Care (CLAHRC) Scheme, and the Imperial Centre for Patient Safety and Service Quality. The funders had no role in the study design, in the collection, analysis and interpretation of data, in the writing report or in the decision to submit the paper for publication
Ethical approval
The study received ethical approval (Ref: 09/H0803/159) and was accepted on the National Institute for Health Research (NIHR) Primary Care Research Network (PCRN) portfolio which sits within the NIHR Clinical Research Network (NIHR CRN) portfolio
Guarantor
PN
Contributorship
PN and AM conceived the study; JM, JTL and MK performed all analyses; JM wrote the first draft; all authors contributed in the revision of the manuscript
Acknowledgements
The authors thank Wendy Collidge, Matthew Hannant, Marc Tallentire, Bob Gann, Jeanette Attan and Charles Cresswell for their contributions
Appendix 1
Appendix 2
The participation and refusal rates in the six London GP practices in which the GP practice waiting-room survey was conducted
| General Practice* | Response to survey invitation | Frequency | Response rate by practice (%) |
|---|---|---|---|
| E5 | Agreed | 209 | 53.6 |
| Declined | 181 | ||
| SW18 | Agreed | 264 | 80.1 |
| Declined | 62 | ||
| N10 | Agreed | 338 | 77.0 |
| Declined | 101 | ||
| TW1 | Agreed | 324 | 77.0 |
| Declined | 97 | ||
| SW4 | Agreed | 294 | 70.8 |
| Declined | 121 | ||
| SE11 | Agreed | 152 | 50.7 |
| Declined | 148 | ||
| Total | 1581 | Overall participation rate = 69.0% |
*Identified by first component of postcode
References
- 1.World Health Organization The world health report 2008: primary health care now more than ever. Geneva: WHO, 2009 [Google Scholar]
- 2.Gray JAM How to Get Better Value Healthcare. Oxford: Offox Press, 2007 [Google Scholar]
- 3.NHS Choices. NHS Choices Annual Report 2009. London: NHS, 2010. See http://www.nhs.uk/aboutNHSChoices/Documents/2009/AnnualReporNHSChoices09.pdf .
- 4.NHS Information Centre. Trends in consultation rates in General Practice 1995–2009. London: NHS Information Centre, 2009. See http://www.ic.nhs.uk/pubs/gpcons95-09 .
- 5.Curtis L Unit costs of health and social care 2010. University of Kent: Personal Social Services Research Unit, 2010 [Google Scholar]
- 6.Murray E, Lo B, Pollack L, et al. The impact of health information on the internet on the physician-patient relationship: patient perceptions. Arch Intern Med 2003;163:1727–34 [DOI] [PubMed] [Google Scholar]
- 7.Kiley R Does the internet harm health? Some evidence exists that the internet does harm health. BMJ 2002;324:238–9 [DOI] [PMC free article] [PubMed] [Google Scholar]
- 8.Murray E, Lo B, Pollack L, et al. The impact of health information on the Internet on health care and the physician-patient relationship: national U.S. survey among 1.050 U.S. physicians. J Med Internet Res 2003;5:e17. [DOI] [PMC free article] [PubMed] [Google Scholar]
- 9.Eysenbach G, Kohler C Does the internet harm health? Database of adverse events related to the internet has been set up. BMJ 2002;324:239. [PubMed] [Google Scholar]
- 10.Department of Health Equity and Excellence: Liberating the NHS (White Paper). London: Department of Health, 2010 [Google Scholar]
- 11.Shahab L, McEwen A Online support for smoking cessation: a systematic review of the literature. Addiction 2009;104:1792–804 [DOI] [PubMed] [Google Scholar]
- 12.Kypri K, Hallett J, Howat P, et al. Randomized Controlled Trial of Proactive Web-Based Alcohol Screening and Brief Intervention for University Students. Arch Intern Med 2009;169:1508–14 [DOI] [PubMed] [Google Scholar]
- 13.Newton NC, Andrews G, Teesson M, Vogl LE Delivering prevention for alcohol and cannabis using the internet: A cluster randomised controlled trial. Preventive Medicine 2009;48:579–84 [DOI] [PubMed] [Google Scholar]
- 14.Eysenbach G, Powell J, Englesakis M, Rizo C, Stern A Health related virtual communities and electronic support groups: systematic review of the effects of online peer to peer interactions. BMJ 2004;328:1166. [DOI] [PMC free article] [PubMed] [Google Scholar]
- 15.Wallace C, Leask J, Trevena LJ Effects of a web based decision aid on parental attitudes to MMR vaccination: a before and after study. BMJ 2006;332:146–9 [DOI] [PMC free article] [PubMed] [Google Scholar]


