Abstract
Dysfunction of hepatic insulin receptor tyrosine kinase (IRTK) causes the development of type 2 diabetes. However, the molecular mechanism regulating IRTK activity in the liver remains poorly understood. Here, we show that phosphoinositide 3-kinase enhancer A (PIKE-A) is a new insulin-dependent enhancer of hepatic IRTK. Liver-specific Pike-knockout (LPKO) mice display glucose intolerance with impaired hepatic insulin sensitivity. Specifically, insulin-provoked phosphoinositide 3-kinase/Akt signalling is diminished in the liver of LPKO mice, leading to the failure of insulin-suppressed gluconeogenesis and hyperglycaemia. Thus, hepatic PIKE-A has a key role in mediating insulin signal transduction and regulating glucose homeostasis in the liver.
Keywords: insulin receptor, insulin resistance, liver, PIKE-A
Introduction
Insulin promotes glucose disposal in muscle and adipocytes by triggering glucose transporter type 4 transport, and prevents glucose production in the liver by inhibiting gluconeogenesis and glycogenolysis (Saltiel & Kahn, 2001). Insulin receptor is a transmembrane receptor consisting of two disulphide-bonded extracellular α- and two transmembrane β-subunits with tyrosine kinase activity (De Meyts, 2008). Binding of insulin to the α-subunit causes a conformational change that enhances the transphosphorylation between the β-subunits to further increase the kinase activity (Belfiore et al, 2009), which in turn phosphorylates various cellular substrates, including insulin-receptor substrate 1 (IRS1), Shc and Cbl, to regulate glucose metabolism. Therefore, disruption of hepatic insulin receptor tyrosine kinase (IRTK) activity by spontaneous mutation or genetic ablation will cause the development of type 2 diabetes, which occurs in severe hyperglycaemia, hyperinsulinaemia, glucose intolerance and elevated hepatic glucose production (HGP; Odawara et al, 1989; Taira et al, 1989; Michael et al, 2000). Although the downstream signalling of insulin receptor is well characterized, the mechanisms regulating IRTK activity remain poorly defined.
Phosphoinositide 3-kinase enhancer A (PIKE-A; also known as AGAP2 and GGAP2), which is encoded by Centg1, belongs to a group of new GTPases that activate the phosphoinositide 3-kinase (PI3K)/Akt pathway (Ye et al, 2000; Rong et al, 2003; Ahn et al, 2004). Although PIKE-A is the only member of the PIKE family that is expressed in a variety of tissues including liver, muscle and fat, its physiological function in these tissues is unknown (Nagase et al, 1996; Xia et al, 2003; Chan et al, 2010b). Our previous studies in whole-body Pike-knockout (Pike−/−) mice suggest that PIKE-A is involved in mammary gland development and diet-induced obesity (Chan et al, 2010a,2010b). In this report, we show that PIKE-A is a new regulator of hepatic IRTK.
Results And Discussion
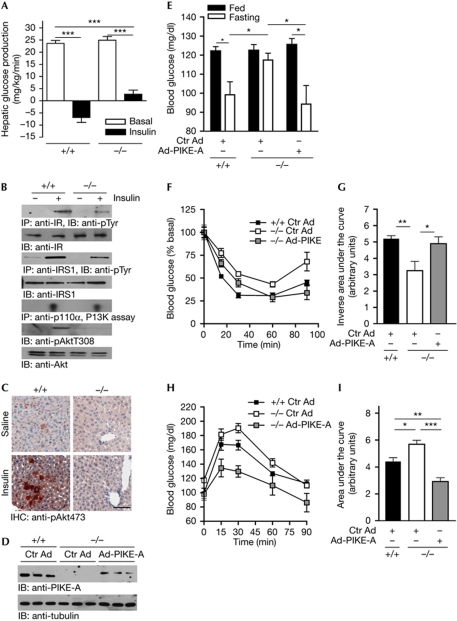
Pike−/− mice have fasting hyperglycaemia (Chan et al, 2010b), a characteristic of diabetes patients caused by increased HGP (Sheehan, 2004). Therefore, we performed hyperinsulinaemic–euglycaemic clamp experiments to determine whether HGP occurs in Pike−/− mice. HGP was maximally suppressed in wild-type animals but only partly reduced in Pike−/− mice, suggesting that PIKE-null liver is insensitive to insulin (Fig 1A). To confirm the hepatic insulin resistance in Pike−/− mice, we examined in vivo insulin signalling by injecting insulin through the vena cava. Decreased insulin-receptor phosphorylation is detected in Pike−/− liver, leading to reduced IRS1, PI3K and Akt activation (Fig 1B). Immunohistochemical staining of the liver after insulin injection further supports the idea that Akt activation is impaired in Pike−/− mice (Fig 1C).
Figure 1.
Hepatic insulin signalling is impaired in whole-body Pike-knockout mice. (A) Hepatic glucose production of Pike−/− mice measured by hyperinsulinaemic–euglycaemic clamp analysis (mean±s.e.m., ***P<0.001, Student's t-test, n=6). (B) Five minutes after injection of saline or 5 U human insulin into the fasted (16 h) mice, the liver was isolated and frozen in liquid nitrogen. Insulin signalling was determined by immunoblotting and in vitro PI3K assay. (C) Immunohistochemical studies of liver Akt phosphorylation in mice injected with saline or 5 U insulin through the inferior vena cava for 5 min. Scale bar, 50 μm. (D) Expression of PIKE-A in wild-type (+/+) and Pike−/− (−/−) liver 10 days after tail vein injections of Ctr Ad or Ad-PIKE-A. (E) Blood glucose concentrations of Pike−/− mice infected with Ad-Ctr or Ad-PIKE-A for 7 days (mean±s.e.m., *P<0.05, Student's t-test, n=5). (F) Insulin tolerance test in Pike−/− (−/−) and wild-type (+/+) mice after 7-day infections of Ad-Ctr or Ad-PIKE-A (mean±s.e.m., n=5). (G) Inverse area under the curve of the insulin tolerance test in (F) (mean±s.e.m., *P<0.05, **P<0.01, Student's t-test, n=5). (H) Pyruvate tolerance test in Pike−/− (−/−) and wild-type (+/+) mice after 7-days infections of Ad-Ctr or Ad-PIKE-A (mean±s.e.m., n=5). (I) Area under the curve of the pyruvate tolerance test in (F; mean±s.e.m., *P<0.05, **P<0.01, ***P<0.001, Student's t-test, n=5). Ad-PIKE-A, adenovirus overexpressing PIKE-A; Ctr Ad, control adenovirus; IHC, immunohistochemistry; IP, immunoprecipitation; IR, insulin receptor; IRS1, insulin receptor substrate 1; PIKE, phosphoinositide 3-kinase enhancer; pTyr, phosphotyrosine.
Although insulin resistance is manifest in PIKE-null liver, Pike−/− mice have enhanced insulin sensitivity in muscle and fat due to elevated AMP-activated protein kinase (AMPK) activity (Chan et al, 2010b). As AMPK is a positive regulator of IRS1 (Jakobsen et al, 2001), high AMPK activity in muscle and fat results in insulin hypersensitivity, which compensates for the impaired hepatic functions in Pike−/− mice. To demonstrate this effect of PIKE-A in liver, we injected control adenovirus or adenovirus overexpressing PIKE-A (Ad-PIKE-A) into Pike−/− mice through the tail vein. As shown in Fig 1D, PIKE-A expression was restored in the liver of Ad-PIKE-A-injected mice. Fasting hyperglycaemia was rescued in Ad-PIKE-A-injected Pike−/− mice (Fig 1E). Similarly, Ad-PIKE-A-injected Pike−/− mice display improved insulin and pyruvate tolerance (Fig 1F–I), indicating that PIKE-A is crucial in controlling HGP.
To further study the physiological consequences of hepatic PIKE-A inactivation and overcome the interference of Pike ablation from other tissues, we generated liver-specific Pike-knockout (LPKO) mice (supplementary Fig S1A online). LPKO mice are viable, fertile and of normal body weight (data not shown). Genomic PCR and reverse-transcription (RT)–PCR results confirm the liver-specific ablation of Pike (supplementary Fig S1B,C online). Nevertheless, LPKO liver has normal mass with no detectable defects (supplementary Fig S1D,E online).
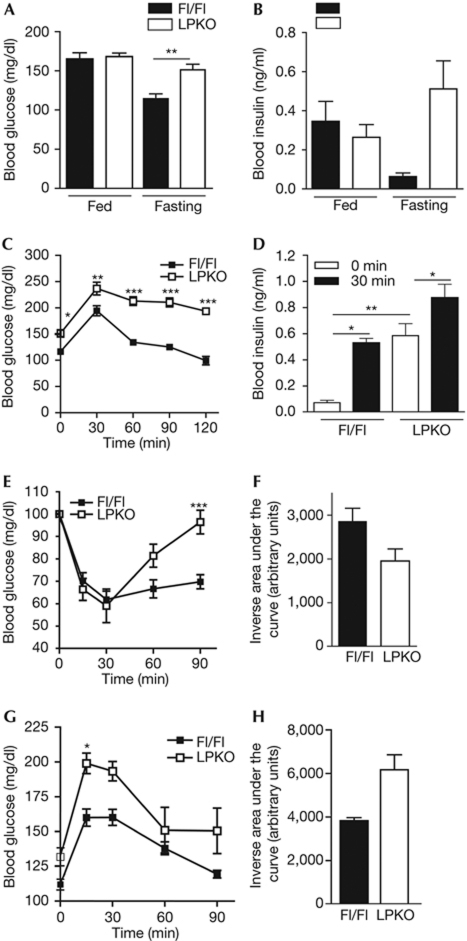
As glucose metabolism is similar in Alb-Cre, PikeFlox/Flox (Fl/Fl) and wild-type mice (supplementary Fig S2 online), we used Fl/Fl mice as the control animals in this study. Similarly to Pike−/− mice, fasted LPKO mice show hyperglycaemia and hyperinsulinaemia (Fig 2A,B). LPKO mice are glucose intolerant (Fig 2C), but their insulin secretion is normal in response to glucose challenge (Fig 2D). The reduction in circulating blood-glucose levels after intraperitoneal administration of insulin is also impaired in LPKO mice, which suggests that systemic glucose metabolism is defective (Fig 2E,F). Moreover, LPKO mice show higher blood-glucose levels after pyruvate administration, indicating that the impaired systematic glucose metabolism is a result of elevated HGP, as observed in the Pike−/− mice (Fig 2G,H).
Figure 2.
Impaired glucose homeostasis in LPKO mice. (A) Blood glucose concentrations of fed and fasted (16 h) mice (mean±s.e.m., **P<0.01, Student's t-test, n=3–5). (B) Serum insulin concentrations of fed and fasted mice (mean±s.e.m., **P<0.01, Student's t-test, n=4–5). (C) Glucose tolerance tests in fasted LPKO and Fl/Fl mice (mean±s.e.m., *P<0.05; **P<0.01; ***P<0.001, two-way ANOVA compared with Fl/Fl animals of the same time intervals, n=4). (D) Serum insulin level of fasted mice after high blood glucose challenge (30 min, 2 g/kg, i.p.; mean±s.e.m., *P<0.05; **P<0.01, Student's t-test, n=4). (E) Insulin tolerance test in fasted LPKO and Fl/Fl mice (mean±s.e.m., ***P<0.001, two-way ANOVA compared with Fl/Fl animals at the same time intervals, n=4–5). (F) Inverse area under the curve of the insulin tolerance test in (E) (mean±s.e.m., *P<0.05, Student's t-test, n=4–5). (G) Pyruvate tolerance test in fasted LPKO and Fl/Fl mice (mean±s.e.m., *P<0.05, two-way ANOVA compared with Fl/Fl animals at the same time intervals, n=5). (H) Area under the curve of the pyruvate tolerance test in (G) (mean±s.e.m., *P<0.05, Student's t-test, n=5). ANOVA, analysis of variance; Fl/Fl, PikeFlox/Flox; LPKO, liver-specific Pike knockout.
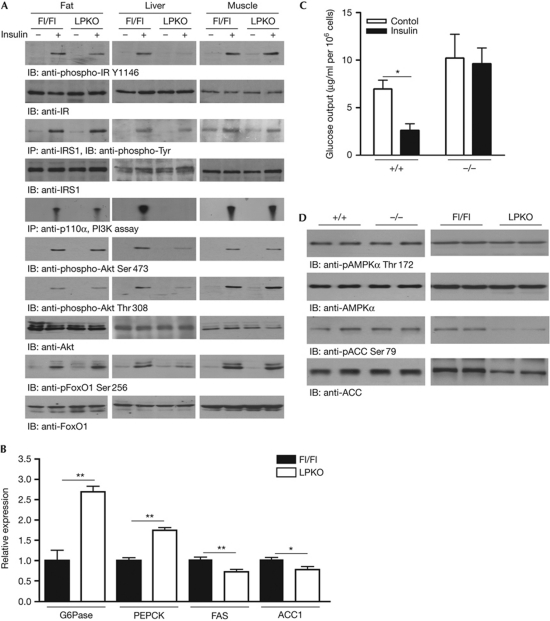
To investigate the molecular basis of the diabetic phenotypes in LPKO mice, we examined insulin-stimulated signal transduction in tissues responsible for glucose homeostasis. After insulin injection through the vena cava, autophosphorylation of insulin receptor Tyr1146 and IRS1 phosphorylation are decreased in the liver of LPKO mice, compared with Fl/Fl controls (Fig 3A, first and third panels). PI3K activities, Akt and FoxO1 phosphorylations are also substantially reduced in LPKO liver (Fig 3A, fifth, sixth, seventh and ninth panels). Nevertheless, insulin elicits comparable PI3K/Akt/FoxO1 activation (Fig 3A) and glucose uptake (supplementary Fig S3 online) in muscle and fat tissues of Fl/Fl and LPKO mice, suggesting that the hepatic insulin resistance in LPKO mice does not affect insulin sensitivity in other peripheral tissues.
Figure 3.
Impaired hepatic insulin signalling in LPKO mice. (A) Five min after injection of saline or 5 U human insulin into the fasted (16 h) mice, the adipose tissue, liver and muscle were isolated, frozen and lysed to determine the insulin signalling. (B) Gluconeogenic and lipogenic gene expression levels in fasted (16 h) mice. Expression levels of the enzymes were normalized to GAPDH expression levels (mean±s.e.m., **P<0.01, Student's t-test, n=3). (C) In vitro glucose-output assay of cultured hepatocytes (mean±s.e.m., *P<0.05, Student's t-test against the corresponding control, n=3). (D) Analysis of hepatic AMPK signalling in Pike−/− and LPKO mice. Liver extracts were prepared from overnight-fasted mice and immunoblotted with total and phosphorylated AMPK and ACC antibodies. ACC1, acetyl Co-A carboxylase 1; AMPK, AMP-activated protein kinase; FAS, fatty acid synthase; GAPDH, glyceraldehyde 3-phosphate dehydrogenase; IB, immunoblotting; IP, immunoprecipitation; IR, insulin receptor; IRS1, insulin receptor substrate 1; LPKO, liver-specific Pike knockout; PEPCK, phosphoenolpyruvate carboxykinase; PI3K, phosphoinositide 3-kinase.
Insulin inhibits the production of glucose in the liver by repressing the expression of the gluconeogenic enzymes phosphoenolpyruvate carboxykinase and glucose-6-phosphatase through the PI3K/Akt cascade (Liao et al, 1998). As phosphorylation of Akt by insulin is reduced in LPKO liver, it is anticipated that expression of these enzymes will be increased. Indeed, LPKO liver shows higher expression of both enzymes (Fig 3B). As a result, insulin is unable to suppress gluconeogenesis in cultured PIKE-null hepatocytes (Fig 3C).
In addition to regulating glucose homeostasis, insulin induces lipid synthesis by increasing the expression of lipogenic enzymes, such as fatty acid synthase and acetyl Co-A carboxylase 1 (ACC1), in the liver (Paulauskis & Sul, 1989; Katsurada et al, 1990). We found that expression of fatty acid synthase and ACC1 is decreased in LPKO liver (Fig 3B). The reduced expression of ACC1 was also confirmed by immunoblotting analysis (Fig 3D). Concurrently with the reduced expression of these lipogenic enzymes, LPKO liver has lower amounts of triglyceride, free fatty acids and cholesterol. However, levels of circulating ketone bodies (β-hydroxybutyrate) are elevated in fasting LPKO mice (Table 1).
Table 1. Metabolic parameters of LPKO mice.
|
Fed
|
Fasted
|
|||
|---|---|---|---|---|
| Fl/Fl | LPKO | Fl/Fl | LPKO | |
| Serum β-hydroxybutyrate (mM) | 1.03±0.39 | 1.06±0.25 | 1.77±0.26 | 2.73±0.16* |
| Serum triglyceride (nmol/μl) | 0.86±0.12 | 0.56±0.01** | 0.64±0.10 | 0.49±0.06 |
| Serum free fatty acid (nmol/μl) | 0.13±0.03 | 0.14±0.02 | 0.17±0.03 | 0.18±0.04 |
| Serum cholesterol (μg/μl) | 0.76±0.04 | 0.95±0.15 | 0.69±0.06 | 0.82±0.09 |
| Hepatic triglyceride (μmol/g) | 113.20±24.5 | 42.03±9.9* | 171.90±26.1 | 111.80±15.2 |
| Hepatic free fatty acid (μmol/g) | 1.36±0.16 | 0.46±0.06** | 1.74±0.19 | 0.22±0.10*** |
| Hepatic cholesterol (mg/g) | 43.02±1.55 | 40.09±1.7 | 62.08±2.60 | 50.39±4.00* |
| Fl/Fl, PikeFlox/Flox; LPKO, liver-specific Pike knockout. | ||||
| Serum and hepatic lysates were prepared from female Fl/Fl and LPKO mice (3-month-old, n=4) fed ad libitum before the study. The fasted animals were fasted 24 h before the samples were collected (*P<0.05, **P<0.01, ***P<0.001 compared with Fl/Fl, Student's t-test). | ||||
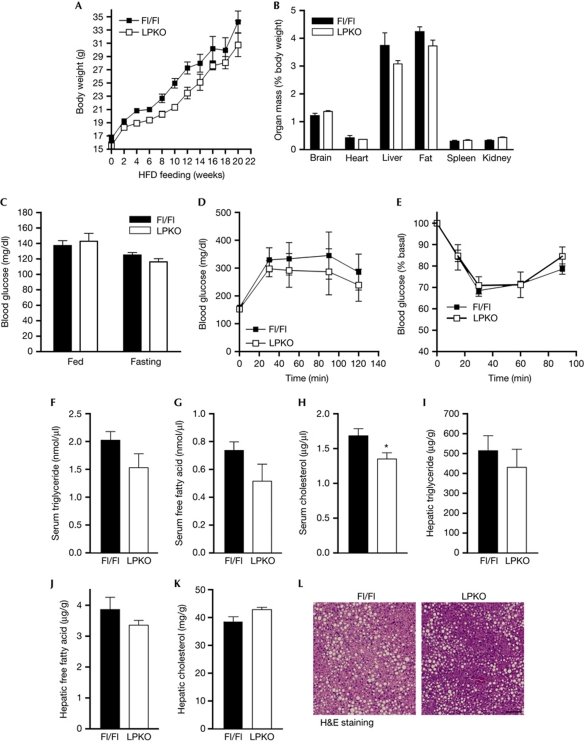
In contrast to the lean phenotype of Pike−/− mice on a high-fat diet (HFD; Chan et al, 2010b), LPKO mice are not obesity resistant. No significant differences in body-weight gain (Fig 4A) and adipose-tissue mass (Fig 4B) were detected between LPKO and Fl/Fl mice after HFD feeding (55% calories derived from fat in 20 weeks). Moreover, both genotypes developed similar levels of hyperglycaemia (Fig 4C), impaired glucose and insulin tolerances (Fig 4D,E), hyperlipidaemia (Fig 4F,G), increased hepatic lipid content (Fig 4I–K) and hepatic steatosis (Fig 4L). Presumably, the ectopic accumulation of fat during over-feeding results in severe insulin resistance in muscle and fat, which overwhelms the role of liver in causing the diabetic phenotypes. It is interesting to note that serum cholesterol was significantly lower in LPKO mice after HFD feeding (Fig 4H).
Figure 4.
LPKO mice develop obesity and diabetes after 20 weeks of high-fat-diet feeding. (A) Growth curve of HFD-fed mice (starting at 2 months of age; mean±s.e.m. n=5). (B) Organ weight of HFD-fed mice (mean±s.e.m., n=5). (C) Blood glucose concentrations of fasted (16 h) or fed mice after HFD feeding (mean±s.e.m., n=5). (D) Glucose tolerance test of HFD-fed mice (mean±s.e.m., n=5). (E) Insulin tolerance test of HFD-fed mice (mean±s.e.m., n=5). (F–H) Serum triglyceride, free fatty acid and cholesterol concentrations of HFD-fed mice (mean±s.e.m., *P<0.01, Student's t-test, n=5). Blood was collected from fed mice. (I–K) Hepatic triglyceride, free fatty acid and cholesterol concentrations of HFD-fed mice (mean±s.e.m., n=5). Serum and livers were collected from fed mice. (L) Representative image of the liver from HFD-fed mice. Scale bar, 100 μm. Fl/Fl, PikeFlox/Flox; H&E, haematoxylin and eosin; HFD, high-fat diet; LPKO, liver-specific Pike knockout.
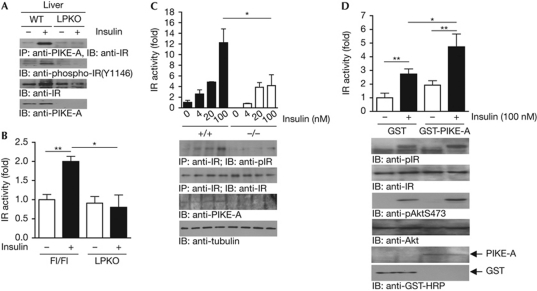
Our molecular studies demonstrate that insulin-receptor autophosphorylation is impaired in PIKE-null liver, suggesting that PIKE-A is crucial for insulin to trigger insulin-receptor activation (Figs 1B,3A). The impaired insulin-receptor activation in PIKE-null liver is not caused by reduced insulin-receptor expression on the hepatocyte surface (supplementary Fig S4 online). Thus, PIKE-A might be a new activator of IRTK during receptor activation. Indeed, hepatic PIKE-A interacts with insulin-receptor β after insulin stimulation, and truncation of the insulin-receptor carboxy-terminal tail (amino acids 1292–1370) disrupts their association (Fig 5A, first panel; supplementary Fig S5B online). Moreover, this interaction is crucial for insulin-induced insulin-receptor autophosphorylation (Fig 5A, second panel). Interestingly, PIKE-A can be phosphorylated by IRTK on its amino-terminus in vitro (supplementary Fig S5D online)—which is independent of Fyn kinase, a previously identified kinase for PIKE-A (Tang et al, 2007)—as pan-Src family kinase inhibitor PP2 is not able to inhibit insulin-induced PIKE-A phosphorylation (supplementary Fig S5E online). As insulin-receptor autophosphorylation is a prerequisite for IRTK activity, we next examined whether IRTK activity is reduced in PIKE-null liver (Zhang et al, 1999). In agreement with the immunoblotting analysis, IRTK activity from LPKO liver is not responsive to insulin stimulation (Fig 5B). Furthermore, insulin induces less insulin-receptor autophosphorylation (Fig 5C, second panel) and modest kinase activity (Fig 5C, first panel) in PIKE-null mouse embryonic fibroblasts. Conversely, levels of both insulin-receptor autophosphorylation and kinase activity are elevated when PIKE-A is overexpressed (Fig 5D, first and second panels).
Figure 5.
PIKE-A enhances insulin-receptor kinase activity through direct association. (A) Insulin enhances PIKE-A and insulin-receptor interaction in vivo. Fasted (16 h) mice were injected with saline (−) or insulin (+) through the inferior vena cava for 5 min. The association between PIKE-A and insulin receptor in liver was detected by immunoblotting analysis. (B) Insulin-stimulated insulin-receptor kinase activation is reduced in PIKE-null liver. Fasted (16 h) mice were injected with saline (−) or insulin (+) through the inferior vena cava for 5 min. Insulin receptor was then immunoprecipitated from the liver and kinase activity was measured by an in vitro kinase assay using poly(Glu:Tyr) as the substrate (mean±s.e.m., *P<0.05, **P<0.01, Student's t-test, n=3). (C) Loss of PIKE-A in MEF cells reduces insulin-stimulated insulin-receptor kinase activation. Serum-starved (16 h) wild-type (+/+) and PIKE-null (−/−) MEFs were treated with insulin for 15 min and lysed. Insulin receptors were immunoprecipitated and kinase activity was measured by an in vitro kinase assay (mean±s.e.m., *P<0.05, Student's t-test, n=3). Phosphorylated insulin-receptor, total insulin receptor, PIKE-A and tubulin were also verified. (D) Overexpression of PIKE-A in HEK293 cells enhances insulin-provoked insulin-receptor activation. Serum-starved (16 h) HEK293 cells (transfected with GST or GST-PIKE-A) were treated with insulin (100 nM) for 15 min, lysed, and insulin receptor was immunoprecipitated to measure its kinase activity (mean±s.e.m., *P<0.05, **P<0.01, Student's t-test, n=4). Insulin receptor and Akt phosphorylation levels were measured using specific antibodies as indicated. Expressions of insulin receptor, Akt, GST and GST-PIKE-A were also verified. GST, glutathione S-transferase; HRP, horseradish peroxidase; IB, immunoblotting; IP, immunoprecipitation; IR, insulin receptor; MEF, mouse embryonic fibroblast; PIKE-A, phosphoinositide 3-kinase enhancer A.
It is noteworthy that insulin-receptor autophosphorylation or activity in both PIKE-null mouse embryonic fibroblasts and PIKE-A-overexpressing cells is not changed in the basal condition, suggesting that the insulin-receptor kinase enhancer function of PIKE-A is insulin-dependent, which is in agreement with the result that PIKE-A/insulin-receptor association occurs after insulin stimulation (Fig 5A). Due to the fact that a special C-terminal conformation is necessary for insulin-receptor activation—as insulin binding leads to a conformational change of the insulin-receptor C-terminus before receptor autophosphorylation (Baron et al, 1992)—the association of PIKE-A might transform or stabilize the active conformation of the insulin-receptor C-terminus, which is crucial for insulin to fully activate the insulin-receptor kinase activity.
We report here that PIKE-A is a new regulator of hepatic insulin receptor that controls glucose production. Loss of hepatic PIKE-A in mice impairs insulin signalling, leading to increased gluconeogenesis, hyperglycaemia, hyperinsulinaemia and glucose intolerance. Genetic analysis further supports this notion, as human chromosome region 12q14, where Centg1 is localized, is associated with the onset of type 2 diabetes (Wiltshire et al, 2004). PIKE-A is a potential drug target for treating hepatic insulin resistance, and manipulation of the PIKE-A/insulin-receptor interaction might be beneficial to patients with type 2 diabetes.
Pike−/− mice have improved systemic insulin responsiveness, but LPKO mice are insulin resistant. This discrepancy could be explained by the differential regulation of AMPK and insulin receptor by PIKE-A in different tissues. In PIKE-null muscle and fat, the high AMPK activity enhances IRS/PI3K phosphorylation, leading to the upregulation of Akt and insulin-stimulated glucose uptake (Chan et al, 2010b). Thus, the insulin-receptor-regulatory role of PIKE-A is dispensable in controlling glucose metabolism. Conversely, AMPK activity is not enhanced in PIKE-ablated liver (Fig 3D). Therefore, the insulin-receptor-enhancer role of PIKE-A becomes important in regulating IRS/PI3K/AKT to suppress glucose production. As a result, HGP is elevated, which contributes to the diabetic phenotypes of LPKO mice. As it remains unknown how PIKE-A performs the differential regulation of AMPK activity in different tissues, further studies are needed to elucidate this mechanism.
In addition to systemic hormonal control, HGP is also regulated by the central nervous system through the hepatic branch of the vagus nerve (Pocai et al, 2005). It is therefore likely that the defective HGP in Pike−/− mice is a secondary effect of a neuronal defect. However, our results from LPKO mice exclude this possibility, as ablation of PIKE-A in hepatocytes alone is sufficient to trigger insulin insensitivity and hyperglycaemia (Fig 2). Our in vitro studies in isolated PIKE-null hepatocytes (Fig 3C), in which the liver–brain circuit is disrupted, also show uncontrolled gluconeogenesis, which further supports the idea that hepatic PIKE-A has a cell-autonomous role in regulating HGP.
Methods
Generation of LPKO mice and genotyping. Transgenic C57/BL6 mice carrying two loxP sequences encompassing exons 3 and 6 of Centg1 (Pikeflox/flox, Fl/Fl) were generated by Ozgene (Australia). The Fl/Fl mice were then mated with transgenic mice containing albumin enhancer/promoter, nuclear localization sequence-modified Cre recombinase (Alb-Cre; The Jason Laboratory), to generate the LPKO mice. Genotyping of offspring was performed by PCR, as reported previously (Chan et al, 2010b).
Immunoprecipitation and western blotting. Tissue extracts were prepared by homogenizing the tissues in lysis buffer, as described previously (Chan et al, 2010b). Antibodies used in the western blot analysis were obtained from Santa Cruz Biotechnology (p110α, IRS1 and Akt) and Cell Signaling Technology (phospho-Akt and phospho-insulin-receptor, phospho-AMPK, phospho-ACC, phospho-FoxO1 and FoxO1). All immunoblotting data shown are the representative results of three independent experiments.
Analytical procedures. All animal experiments were performed in 2–3-month-old female mice according to the care of experimental animal guidelines from Emory University. Blood glucose level measurement, serum insulin examination, glucose tolerance test and insulin tolerance test were performed as reported previously (Chan et al, 2010b). Pyruvate tolerance test was also performed as reported previously (Rodgers & Puigserver, 2007). Serum and hepatic lipid concentrations were determined using commercially available kits (BioVision).
In vivo insulin stimulation. Fasted animals (16 h) were anaesthetized using sodium pentobarbital. Saline or 5 U human insulin (Elli Lily) was injected through the inferior vena cava. After 5 min, liver, muscles and inguinal fat were removed and homogenized for analysis (Chan et al, 2010b).
Hyperinsulinaemic–euglycaemic clamp. In vivo hepatic glucose output was determined by hyperinsulinaemic–euglycaemic clamp, as reported previously (Chan et al, 2010b).
In vitro glucose-production assay. After 24 h incubation, cultured hepatocytes were washed with PBS and incubated in assay medium (glucose and phenol red-free DMEM supplemented with 20 mM sodium lactate and 2 mM sodium pyruvate) with or without 1 nM human insulin (Elli Lily) for 8 h. The glucose in the assay medium was then measured using the Glucose (HK) assay kit (Sigma-Aldrich).
Adenovirus infection. Adenovirus infections were performed by tail vein injection of 5 × 10¹⁰ viral particles per mouse (3-month-old female). After 7 days, the mice were used for pyruvate tolerance and insulin tolerance assay.
Statistics. Statistical analysis was performed using the computer software Prism (GraphPad) and results were considered significant when P<0.05.
Supplementary information is available at EMBO reports online (http://www.emboreports.org).
Supplementary Material
Acknowledgments
We thank E. Breding and E. Dessasau (Yerkes National Primate Research Center, Emory University) for their technical assistance in preparing the tissue sections. This work was supported by grants from the National Institutes of Health to K.Y. (CA127119) and J.K.K. (DK80756). The UMass Mouse Phenotyping Center is supported by the NIDDK Diabetes and Endocrinology Research Center (DK52530).
Author contributions: C.B.C. performed the experiments, analysed the data and wrote the manuscript; X.L., K.H. and Q.Q. performed the experiments; D.Y.J. performed the experiments and analysed the data; J.K.K. analysed the data; K.Y. analysed the data and wrote the manuscript.
Footnotes
The authors declare that they have no conflict of interest.
References
- Ahn JY, Rong R, Kroll TG, Van Meir EG, Snyder SH, Ye K (2004) PIKE (phosphatidylinositol 3-kinase enhancer)-A GTPase stimulates Akt activity and mediates cellular invasion. J Biol Chem 279: 16441–16451 [DOI] [PubMed] [Google Scholar]
- Baron V, Kaliman P, Gautier N, Van Obberghen E (1992) The insulin receptor activation process involves localized conformational changes. J Biol Chem 267: 23290–23294 [PubMed] [Google Scholar]
- Belfiore A, Frasca F, Pandini G, Sciacca L, Vigneri R (2009) Insulin receptor isoforms and insulin receptor/insulin-like growth factor receptor hybrids in physiology and disease. Endocr Rev 30: 586–623 [DOI] [PubMed] [Google Scholar]
- Chan CB, Liu X, Ensslin MA, Dillehay DL, Ormandy CJ, Sohn P, Serra R, Ye K (2010a) PIKE-A is required for prolactin-mediated STAT5a activation in mammary gland development. EMBO J 29: 956–968 [DOI] [PMC free article] [PubMed] [Google Scholar]
- Chan CB, Liu X, Jung DY, Jun JY, Luo HR, Kim JK, Ye K (2010b) Deficiency of phosphoinositide 3-kinase enhancer protects mice from diet-induced obesity and insulin resistance. Diabetes 59: 883–893 [DOI] [PMC free article] [PubMed] [Google Scholar]
- De Meyts P (2008) The insulin receptor: a prototype for dimeric, allosteric membrane receptors? Trends Biochem Sci 33: 376–384 [DOI] [PubMed] [Google Scholar]
- Jakobsen SN, Hardie DG, Morrice N, Tornqvist HE (2001) 5′-AMP-activated protein kinase phosphorylates IRS-1 on Ser-789 in mouse C2C12 myotubes in response to 5-aminoimidazole-4-carboxamide riboside. J Biol Chem 276: 46912–46916 [DOI] [PubMed] [Google Scholar]
- Katsurada A, Iritani N, Fukuda H, Matsumura Y, Nishimoto N, Noguchi T, Tanaka T (1990) Effects of nutrients and hormones on transcriptional and post-transcriptional regulation of acetyl-CoA carboxylase in rat liver. Eur J Biochem 190: 435–441 [DOI] [PubMed] [Google Scholar]
- Liao J, Barthel A, Nakatani K, Roth RA (1998) Activation of protein kinase B/Akt is sufficient to repress the glucocorticoid and cAMP induction of phosphoenolpyruvate carboxykinase gene. J Biol Chem 273: 27320–27324 [DOI] [PubMed] [Google Scholar]
- Michael MD, Kulkarni RN, Postic C, Previs SF, Shulman GI, Magnuson MA, Kahn CR (2000) Loss of insulin signaling in hepatocytes leads to severe insulin resistance and progressive hepatic dysfunction. Mol Cell 6: 87–97 [PubMed] [Google Scholar]
- Nagase T, Seki N, Ishikawa K, Tanaka A, Nomura N (1996) Prediction of the coding sequences of unidentified human genes. V. The coding sequences of 40 new genes (KIAA0161-KIAA0200) deduced by analysis of cDNA clones from human cell line KG-1 (supplement). DNA Res 3: 43–53 [DOI] [PubMed] [Google Scholar]
- Odawara M et al. (1989) Human diabetes associated with a mutation in the tyrosine kinase domain of the insulin receptor. Science 245: 66–68 [DOI] [PubMed] [Google Scholar]
- Paulauskis JD, Sul HS (1989) Hormonal regulation of mouse fatty acid synthase gene transcription in liver. J Biol Chem 264: 574–577 [PubMed] [Google Scholar]
- Pocai A, Lam TK, Gutierrez-Juarez R, Obici S, Schwartz GJ, Bryan J, Aguilar-Bryan L, Rossetti L (2005) Hypothalamic K(ATP) channels control hepatic glucose production. Nature 434: 1026–1031 [DOI] [PubMed] [Google Scholar]
- Rodgers JT, Puigserver P (2007) Fasting-dependent glucose and lipid metabolic response through hepatic sirtuin 1. Proc Natl Acad Sci USA 104: 12861–12866 [DOI] [PMC free article] [PubMed] [Google Scholar]
- Rong R, Ahn JY, Huang H, Nagata E, Kalman D, Kapp JA, Tu J, Worley PF, Snyder SH, Ye K (2003) PI3 kinase enhancer-Homer complex couples mGluRI to PI3 kinase, preventing neuronal apoptosis. Nat Neurosci 6: 1153–1161 [DOI] [PubMed] [Google Scholar]
- Saltiel AR, Kahn CR (2001) Insulin signalling and the regulation of glucose and lipid metabolism. Nature 414: 799–806 [DOI] [PubMed] [Google Scholar]
- Sheehan JP (2004) Fasting hyperglycemia: etiology, diagnosis, and treatment. Diabetes Technol Ther 6: 525–533 [DOI] [PubMed] [Google Scholar]
- Taira M et al. (1989) Human diabetes associated with a deletion of the tyrosine kinase domain of the insulin receptor. Science 245: 63–66 [DOI] [PubMed] [Google Scholar]
- Tang X, Feng Y, Ye K (2007) Src-family tyrosine kinase fyn phosphorylates phosphatidylinositol 3-kinase enhancer-activating Akt, preventing its apoptotic cleavage and promoting cell survival. Cell Death Differ 14: 368–377 [DOI] [PubMed] [Google Scholar]
- Wiltshire S et al. (2004) Evidence from a large U.K. family collection that genes influencing age of onset of type 2 diabetes map to chromosome 12p and to the MODY3/NIDDM2 locus on 12q24. Diabetes 53: 855–860 [DOI] [PubMed] [Google Scholar]
- Xia C, Ma W, Stafford LJ, Liu C, Gong L, Martin JF, Liu M (2003) GGAPs, a new family of bifunctional GTP-binding and GTPase-activating proteins. Mol Cell Biol 23: 2476–2488 [DOI] [PMC free article] [PubMed] [Google Scholar]
- Ye K, Hurt KJ, Wu FY, Fang M, Luo HR, Hong JJ, Blackshaw S, Ferris CD, Snyder SH (2000) Pike. A nuclear gtpase that enhances PI3kinase activity and is regulated by protein 4.1N. Cell 103: 919–930 [DOI] [PubMed] [Google Scholar]
- Zhang B et al. (1999) Discovery of a small molecule insulin mimetic with antidiabetic activity in mice. Science 284: 974–977 [DOI] [PubMed] [Google Scholar]
Associated Data
This section collects any data citations, data availability statements, or supplementary materials included in this article.


