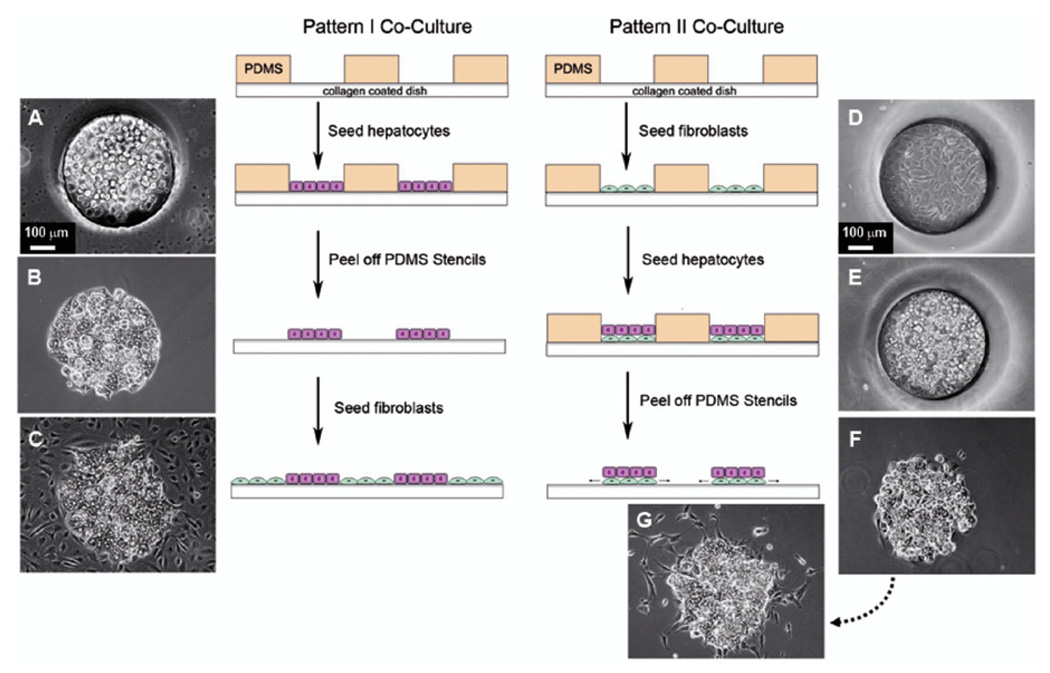
Figure 2. Schematic diagram showing sequence of steps in Pattern I and Pattern II co-culture techniques with corresponding micrographs of the cultured cells.
The PDMS stencil, with holes 500 µm in diameter, is applied to each dish. Pattern I co-culture: (A) hepatocytes seeded in the wells of the PDMS stencil, (B) hepatocyte island after removal of PDMS stencil, (C) hepatocyte island with surrounding fibroblasts (culture day 2). Pattern II co-culture: (D) fibroblasts seeded in the wells of the PDMS stencil, (E) hepatocytes seeded in the wells on top of the fibroblasts, (F) island of fibroblasts and hepatocytes after removal of PDMS stencil, (G) fibroblasts proliferating from under the hepatocytes.

