

Abstract
The lack of efficient methods for concentrating viruses in water samples leads to underreporting of viral contamination in source water. A novel strategy for viral concentration was developed using the expression of target virus receptors on bacterial cells. Poliovirus type 1, the most studied enterovirus, was used as a surrogate for enteric viruses. The human poliovirus receptor (hPVR) gene was expressed on the surface of Escherichia coli cells by using the ice nucleation protein (INP) gene. The hPVR gene was ligated to the 3′ end of the INP gene after the removal of the stop codon. The resulting open reading frame (ORF) was used for the projection of hPVR onto the outer membrane of E. coli. Gene expression was tested by SDS-PAGE, Western blot, and dot blot analyses, and virion capture ability was confirmed by transmission electron microscopy. The application of engineered E. coli cells for capturing viruses in 1-liter samples of source and drinking water resulted in 75 to 99% procedural recovery efficiency. Cell surface display of viral receptors on bacterial cells opens a new prospect for an efficient and inexpensive alternative tool for capturing and concentrating waterborne viruses in water samples.
INTRODUCTION
Despite significant improvements in the methodologies for detection of enteric viruses in water samples, there remains a need for more rapid and economical methods. Refined methods that reduce the time and processing involved in concentrating water samples are essential for improved applicability in the detection of viruses. New methods must be compatible with techniques such as cell culturing and molecular analyses. The current USEPA method (26, 27) processes large volumes of water by filtration/adsorption, and elution procedures are used to concentrate and detect enteric viruses in water samples. Over the years, there have been various improvements in detecting enteric viruses by using PCR (1, 2, 8); however, only limited work has been reported on conventional adsorption-elution concentration methods (16). Therefore, there is a need for innovative change in concentration methods, which can be achieved by a paradigm shift in the basic principles.
Enteroviruses can cause a variety of illnesses (22), and their presence in source and drinking water (3, 13, 14) and wastewater (24) has been widely documented. Enteroviruses in the environment create a public health risk because they can be transmitted via the fecal-oral route through contaminated water and have been the etiologic agents of many waterborne disease outbreaks (7, 28).
The primary objective of this research was to develop a novel strategy that could be used for the detection of viral contamination in water. We engineered an Escherichia coli cell displaying human poliovirus receptor (hPVR) on its cell surface for capturing poliovirus particles in water samples. Cell surface display is a technique that can be used to express heterologous proteins on the outer membranes of bacterial cells, such as E. coli. This technique is widely used in molecular genetics studies, as it has applications in biotechnology, microbiology, and immunology (15, 17). Bacterial display systems have been developed for various applications, and it is a promising paradigm to have “cell surface display libraries” and “cell surface display banks” so that many proteins can be mass produced for specific applications. This study was focused on expressing hPVR on the outer membrane of E. coli (Fig. 1). The major challenges in this gene projection study were as follows: (i) to send the target receptor protein (hPVR) to the surface of the outer membrane of the host cell and (ii) to anchor the target receptor protein (paratope) in the correct orientation to facilitate docking of the receptor with the epitope. These challenges were addressed by ligating/fusing the hPVR gene to the ice nucleation protein (INP) gene. INP is commonly expressed on the surface of Pseudomonas syringae, helping these bacteria to nucleate ice particles at relatively higher temperatures than they normally would (21).
Fig. 1.

Schematic showing the expression of INP-hPVR on the cell surface of E. coli. hPVR constitutes three domains (D1, D2, and D3) docking to the poliovirus epitope (out of proportion). The plasmid indicated here is pTHIcePVR, which was constructed during this study. GPI, glycosylphosphatidylinositol.
Li et al. have used INP for the expression of green fluorescent protein (GFP) on the surface of E. coli (20). In their gene construct, they used three variations of the INP gene, including a full-length gene, a combination of the N-terminal and C-terminal domains in one open reading frame, and the N-terminal domain alone. They showed no significant difference in gene expression using these gene fusion constructs. The specific objectives of the present study were to construct a genetically modified E. coli expressing hPVR in a proper orientation on the cell surface, to introduce a viral capturing “tool” by evaluating the capture efficiency of poliovirus as a model microorganism for enteric viruses, to develop a viral concentration protocol in 1-liter water samples, and to conduct a limited field evaluation of the method for detection of poliovirus by using source and drinking water samples.
MATERIALS AND METHODS
Microbial strains, plasmids, and growth conditions.
The INP gene within the pICE1.2 plasmid and pPROBE.NI were obtained from Steven Lindow, University of California at Berkeley, Berkeley, CA. This plasmid carries the ampicillin resistance (Ampr) gene (23) in E. coli strain DH5α. The hPVR gene (1,251 bp), which is located on the pCMV.SPORT6 plasmid with a total length of 4,396 bp, was purchased from the American Type Culture Collection (ATCC 7483638). This plasmid carries a gene encoding resistance to kanamycin. Both plasmids (pICE1.2 and pCMV.SPORT6) were obtained in E. coli hosts and were grown in Luria-Bertani (LB) broth (0.5% yeast extract, 1% tryptone, 0.5% NaCl) (5). Each bacterial stock was mixed with 2.5% glycerol, and sample aliquots were stored at −80°C until used. When necessary, 0.1 to 1 ml of each frozen culture was thawed and grown in 25 ml of LB broth with the suitable antibiotic at a concentration of 50 μg/ml. Cultures were incubated in a C24 incubator shaker (New Brunswick, Edison, NJ) at 37°C for 4 h to reach the log phase. E. coli TOP10 (Invitrogen, Carlsbad, CA) cultures were transformed using vector pTrcHis as previously described (20).
Ice nucleation activity test.
The ice nucleation activity of bacteria was measured using the droplet-freezing method (29) in a refrigerator condensation trap (Savant, Farmingdale, NY) at temperatures between −3°C and −12°C. After the ethanol in the trap was cooled to −3°C, aluminum foil boats, covered with a paraffin wax layer, were floated on ethanol. The boat surface was kept flat to avoid trapping air bubbles, which could result in uneven temperatures across the surface. Each transformed colony was suspended in nanopure water, and 10 10-μl drops were placed on the surface of the aluminum boat. The drops with INP-expressing bacteria started to freeze as the temperature reached −10°C. The frozen droplets were counted, and the ice nucleation activity was calculated using the following equation (29):
, where N is the concentration of active ice nuclei in the initial solution (i.e., nuclei per milliliter), ln [1/(1 − f)] is the calculated nucleus action frequency based on a Poisson distribution of freezing events among the collection of droplets, f is the fraction of frozen droplets, Vdr is the volume of each droplet (in milliliters), and Ds is the factor describing the dilution of the solution from which droplets were tested from the initial bacterial stock.
Plasmid construction.
The first 533-bp fragment of the INP gene, inaK, was selected for the plasmid construct. Restriction sites NcoI at the 5′ end and BglII at the 3′ end were incorporated into the 533-bp fragment by using PCR. The primers used for this site-directed mutagenesis are shown in Table 1.
Table 1.
Primers used for construction of the recombinant plasmids
| Primer | Restriction site | Sequencea |
|---|---|---|
| inaK-N5 | NcoI | 3′-TGC TGC CAT GGC TCT CGA CAA GGC GTT GG-5′ |
| inaK-N3 | BglII | 3′-TAA GAT CTG GTC TGC AAA TTC TGC GGC GTC GTC ACC GG-5′ |
| inaK-C5 | BamHI | 3′-GCA GGA TCC AGA CTC TGG GAC GGG AAG-5′ |
| inaK-C3 | BglII | 3′-GAA GAT CTT ACC TCT ATC CAG TCA TCG TCC TCG-5′ |
| PVR-N5 | BglII | 3′-TAA GAT CTA TGG CCC GAG CCA TG-5′ |
| PVR-C3 | HindIII | 3′-GGA AGC TTC CTT GTG CCC TCT GTC TGT-5′ |
Underlined sequences indicate the inserted restriction sites.
This stretch of the inaK fragment included the targeting signals and two of the transmembrane repeats to ensure the anchoring of the recombinant protein on the outer surface of bacterial cells. The template used was pPROBE-NI′, which was also obtained from Steven Lindow. A multiplex PCR kit (Qiagen, Valencia, CA) was used to perform PCR for all required amplifications. The reaction mixture was incubated for 15 min at 95°C and then subjected to 40 cycles consisting of 45 s at 95°C, 30 s at 50°C, and 150 s at 72°C. The final extension step was performed at 72°C for 7 min. The amplified inaK-N (N-terminal domain of inaK) was digested using NcoI and BglII restriction enzymes in Tango buffer (Fermentas, Glen Burnie, MD) according to the manufacturer's directions. The 4.4-kb expression plasmid pTrcHisC (Invitrogen, Carlsbad, CA) was digested using the same restriction enzymes followed by a ligation reaction to incorporate inaK-N into pTrcHisC, which resulted in the plasmid pTHIce (Table 2). After each digestion or ligation reaction, samples were purified using a DNA-cleaning kit (Qiagen, QIAamp DNA mini prep kit). T4 DNA ligase (Fermentas) was used to perform the ligation reaction, as recommended by the manufacturer. To confirm the ligation, restriction digestion was performed using SphI, and the digested reaction product was run on a 0.7% (wt/vol) agarose gel. The expected size of the recombinant plasmid was 4,948 bp.
Table 2.
Plasmids used in this study and their characteristics
| Plasmid | Source | Length (bp) | Resistance | Significance |
|---|---|---|---|---|
| pPROBE-NI | UC Berkeley | 8,500 | Kanamycin | Includes INP |
| pTrcHisC | Invitrogen (V360-20) | 4,400 | Ampicillin | Expression plasmid |
| pTHIce | This study | 4,948 | Ampicillin | Expression plasmid containing INP |
| pTHIcePVR | This study | 6,062 | Ampicillin | Expression plasmid containing INP-hPVR ORF |
The hPVR gene (1,251 bp) was amplified using the primers PVR-N3 and PVR-C5 as previously described. In this process, the stop codon was deleted during site-directed mutagenesis using the primer PVR-N3. The amplified gene and the plasmid pTHIce were digested using BglII and HindIII restriction enzymes, followed by ligation using T4 DNA ligase to construct plasmid pTHIcePVR, measuring 6,062 bp. The insertion of the hPVR gene into pTHIcePVR was confirmed by restriction fragment analysis using the SphI restriction enzyme.
The transformation of competent E. coli hosts (Invitrogen) was performed using a heat shock protocol: the mixture of cells and DNA was incubated on ice for 30 min and then heat shocked at 42°C for 45 s and placed on ice for 2 min. Transformed E. coli cells were stored at 4°C or −80°C for long-term storage.
DNA sequencing of constructed plasmids.
The plasmid pTHIcePVR was purified using the Mini Prep kit (Qiagen) and the isolated vectors were sequenced using the model 3730 genetic analyzer (Applied Biosystems, Hitachi, Japan) as described in the BigDye Terminator cycle sequencing kit protocol (Applied Biosystems). M13 primer M1 (5′-AGT CAC GAC GTT GTA- 3′) and M13 primer RV (5′-CAG GAA ACA GCT ATG AC- 3′) were used as sequencing primers in the sequencing PCR cycle. The DNA sequence of the plasmid construct was searched for homology with entries in GenBank by using the BLAST server at the National Center for Biotechnology Information (Bethesda, MD).
Protein expression.
After the desired plasmid construction was confirmed by the colony screening, PCR, and sequence analysis, one of the colonies containing the plasmid was picked and inoculated into 3 ml of LB medium to make a starter culture. The E. coli host culture was incubated in the incubator shaker (220 rpm) at 37°C for 4 h. This culture was diluted 1/500 into 50 ml of LB broth and grown for 3 to 4 h until it reached an optical density at 600 nm (OD600) of 0.5 to 0.8, and then three 1-ml samples were collected to assess induction time optimization. The hPVR gene was induced by adding 0.5 ml of 100 mM isopropyl-β-d-thiogalactopyranoside (IPTG) to each of the three 1-ml samples at 37°C to reach a final concentration of 1 mM IPTG. Samples were analyzed at 1, 2, and 4 h for intensity of target protein expression by using protein gel electrophoresis and Western blotting.
Protein gel electrophoresis.
Antigens were prepared using a 1:1 ratio of 2× SDS buffer and 10% dithiothreitol (DTT). Samples were heated at 100°C for 5 min and then mixed. Polyacrylamide gel electrophoresis was performed using 4 to 15% SDS gels (Bio-Rad, Tris-HCl ready precast gel) at a 25-mA constant current for one gel and 40 mA for two gels. A 5% PBSTM (5% dried milk in phosphate-buffered saline [PBS]–Tween [PBST]) solution was prepared and stirred for 1 h. A molecular mass protein marker (11 to 250 kDa) (Fermentas) was used. For Western blot transfer, cellulose membranes were activated by submerging in methanol for 10 s, deionized (DI) water for 5 min, and then nondenaturing running buffer for 10 min. The transfer of proteins to the cellulose membrane was performed using a semidry transfer system, and its structure was as follows from bottom to top: (i) blot paper, (ii) cellulose membrane, (iii) gel, and (iv) blot paper (25). Air bubbles were avoided between the cellulose membrane and gel. The transfer was conducted at 15 V for 15 to 20 min. The upper right corner of the cellulose membrane was cut for orientation purposes and then removed from the semidry system and incubated in 5% PBSTM buffer with agitation at room temperature for 1 h.
Western blotting.
Ten milliliters of Blotto was used to prepare the blotting solution, the primary antibody, goat anti CD-155, was added at a concentration of 1:10,000, and the resulting solution was mixed for 1 h. All reagents were obtained from Santa Cruz Biotechnologies (Santa Cruz, CA). After primary incubation, the membrane was triple washed with PBST and incubated on a rocker at room temperature for 5 min. A 1:100,000 dilution of horseradish peroxidase (HRP)-conjugated secondary antibody (donkey anti-goat IgG-HRP) was added to the membrane, which was then incubated on a rocker for 45 min. Thereafter, the membrane was washed three times with PBST and incubated on a rocker for 10 min. PBST was discarded and the membrane was covered with enhanced chemiluminescent Western blotting luminol reagent (Thermo Scientific, Rockford, IL) for 1 min. The membrane was placed on plastic wrap and dried with Kimwipes. X-ray film was placed on the membrane in the darkroom. The optimal film exposure time was determined to be between 10 and 15 min.
Dot blotting.
The dot blot procedure was performed as previously described for Western blotting. Briefly, the cellulose membrane was placed in the dot blot apparatus (Bio-Rad), bacterial samples (preinduction and postinduction) were transferred to the designated wells, and vacuum was applied to firmly hold/stabilize each sample on its spot. The assay procedure was similar to that for the Western blot, with the exception that the alkaline phosphatase (AP)-conjugated secondary antibody was donkey anti-goat IgG-AP (Santa Cruz Biotechnologies).
Electron microscope imaging.
To further document the viral capture, a mixture of recombinant E. coli and poliovirus was visualized using transmission electron microscopy (TEM). Briefly, a 0.5-ml aliquot of recombinant E. coli containing 106 CFU was mixed with 0.5 ml of poliovirus containing 106 PFU in a 1.5-ml microcentrifuge tube. The sample was briefly vortexed and incubated at 37°C for 30 min with continuous shaking at 100 rpm. Thereafter, the sample was washed twice by centrifugation at 1,300 × g for 3 min, and the pellet was resuspended in 100 μl of ultrapure water and then fixed by adding 0.1% glutaraldehyde to the sample. Half of this preparation was treated with phosphotungstic acid dye (pH 6.5), and the second half was treated with uranyl acetate dye (pH 5.0). Both preparations were examined with a Philips EM201 TEM (Mahwah, NJ).
Virus production and assay.
Poliovirus type 1 LSc-2ab vaccine strain (PV1) was obtained from the viral collection of the Department of Virology and Baylor College of Medicine, (Houston, TX). Viruses were propagated by inoculating the Buffalo green monkey (BGM) cell monolayer with approximately 1 × 10⁵ 50% tissue culture infective dose (TCID50)/ml. The flasks were incubated at 37°C until at least 90% of the cells demonstrated cytopathic effect (CPE). Infected cell monolayers were subjected to three cycles of freeze-thawing. The supernatant was centrifuged at 4°C at 8,000 × g for 15 min to remove cellular debris. To remove lipids and facilitate breaking of clumps of virus, a Vertrel XF (MicroCare Marketing Services, New Britain, CT) extraction was performed by centrifuging a suspension of equal parts Vertrel and virus-infected cell lysate at 4°C at 8,000 × g for 90 min.
The virus stock was further purified and concentrated using polyethylene glycol (PEG) precipitation. Briefly, the Vertrel-extracted cell lysate was augmented with 9% PEG (molecular weight 8,000) and 1 M NaCl and was allowed to stir overnight at 4°C. It was then centrifuged at 4°C at 8,000 × g for 90 min. The supernatant was discarded and the pellet was resuspended in 10% of its original volume of PBS. The purified viruses were stored at −80°C. Viral stocks were enumerated using plaque formation assays in BGM cell monolayers as previously described (4).
Concentration of viruses in water samples and capture efficiency measurements.
Initially, a 50-ml volume of PBS buffer was used to optimize mixing time for concentrating poliovirus in water samples. Each sample was mixed for 10, 30, and 60 min, and 1 h was determined to give the highest yield (data not shown). Next, the method was field tested for concentrating viruses in tap water (city of Tempe, AZ), and the following central Arizona source waters: Salt River, Verde River, and Central Arizona Project (CAP) canal. One liter of each water sample was seeded with poliovirus type 1 and induced recombinant E. coli at a final concentration of 104 PFU/ml and 104 CFU/ml, respectively.
On the day of the experiment, recombinant E. coli cultures were prepared as follows. The bacterial cells were grown in 20 ml of tryptic soy broth (TBS) in a shaker incubator at 150 rpm at 37°C for 2 h. The culture was removed from the incubator and IPTG at a final concentration of 1 mM was added, as previously described. The culture was incubated for an additional 1 h for the expression of the INP-PVR protein. After 1 h of induction, bacterial cells were washed by centrifugation at 4,200 × g for 20 min and resuspended in 20 ml of PBS. Induced E. coli cells were added to the 1-liter water sample, previously seeded with poliovirus.
The sample was mixed using a stir bar at 4°C for 1 h. The sample was centrifuged at 4,200 × g for 20 min. Supernatant and pellet of the 1-liter sample were separately analyzed to enumerate viral particles in each fraction for calculating total viral capture efficiency by recombinant E. coli cells. First, the pellet was resuspended in 5 ml of PBS buffer.
Prior to the cell culture assay, viruses were disassociated from bacterial cells. For this disassociation, the pH of each sample was adjusted to 3.5; the sample was then vortexed for 30 s, immediately followed by neutralization to pH 7.5. Bacterial cells were harvested by centrifugation at 1,200 × g for 10 min, and the supernatant was saved. Two 1-ml volumes of supernatant from the PBS buffer sample (pellet sample), two 1-ml volumes of supernatant from the tap and source water samples, and positive and negative control samples were subjected to plaque-forming assays using BGM cell monolayers to enumerate viral particles in each sample as previously described (4).
RESULTS
A plasmid containing INP and hPVR genes in a single open reading frame (ORF) was successfully constructed. The INP in the ORF facilitated the translocation of the hPVR to the outer membrane of E. coli cells and anchored the receptor on the bacterial cell surface. The ice nucleation activity of the E. coli cells containing INP gene expression was confirmed by the method described by Vali (29). The number of nucleating cells at log phase was calculated to be 138.63 nuclei/ml, as previously described (29).
The primer sets (Table 1) for site-directed mutagenesis of the N- and C-terminal domains of hPVR and INP successfully amplified the specific segments of target genes. All PCR amplifications resulted in products with the expected sizes. To ensure success of the plasmid construction, three different forms of the inaK gene were used in the plasmid construct. These three forms were as follows: the full-length inaK, a truncated N-terminal domain of inaK, and a truncated C-terminal domain of inaK (Fig. 2). Locations of primers chosen to amplify these gene fragments are shown in Fig. 2. For amplification of the N-terminal domain (inaK-N), primers were chosen to include two of the anchoring repeats of the repetitive central domain of inaK to produce a 540-bp product. Likewise, the C-terminal domain (inaK-C) was amplified to produce a 70-bp fragment of the inaK gene. Full-length and truncated portions of INP have been compared for expressing green fluorescent protein on the surface of E. coli, and it has been reported that a truncated INP gene encoding the N terminus is as efficient as full-length INP for the surface display of heterologous proteins on the bacterial cell surface (20). In the present study, the full-length INP (4,200 bp) failed to successfully ligate to hPVR, whereas the truncated inaK-N was successfully ligated to hPVR.
Fig. 2.

Schematic of the genetic organization of the constructed open reading frame (ORF) and locations of primers used for the INP and hPVR genes. Boxes represent the exons specifying the translated domains. The horizontal arrows indicate the location and direction of the primers used to amplify the specified fragments of target genes. (a) Organization of the amplified hPVR, where D1, D2, and D3 are the three extracellular domains and TM is the transmembrane domain. (b) Organization of the INP gene. (c) Proposed ORF made of the N-terminal domain of INP and the full-length hPVR.
E. coli transformants with pTHIcePVR were confirmed for the truncated inaK-N and hPVR insertions (Fig. 3). A colony screen using PCR was performed on 12 colonies to confirm the transformants for inaK-N-PVR (Fig. 4). Eight out of 12 transformants had the expected size PCR product (Fig. 4). Colonies 1 to 4 were PCR negative, suggesting that they failed to be transformed with the constructed plasmid. One of the successful transformants (colony 6) was chosen for further analysis by restriction enzyme digestion. This digestion with the enzymes NcoI and HindIII showed fragment sizes of 1.8 kb and 4.4 kb (Fig. 4 and Fig. 5), which corresponds to the predicted sizes of the constructed ORF and the pTrcHisC plasmid, respectively. The new constructed plasmid was named pTHIcePVR (Fig. 4). The results were also confirmed by direct sequencing (data not shown).
Fig. 3.

Map of the expression plasmid pTHIcePVR showing the open reading frame that includes inaK-N and hPVR. The restriction sites that were used for site-directed mutagenesis and their position on the ORF are also indicated.
Fig. 4.

Gel photograph of colony-screening PCR of selected colonies grown on a plate with ampicillin. Lanes: L, 1-kbp marker; 1 to 12, transformed colonies. Amplification of the targeted sequence size (1.8 kb) is shown in colonies 5 to 12, indicating the successful transformation of colonies.
Fig. 5.
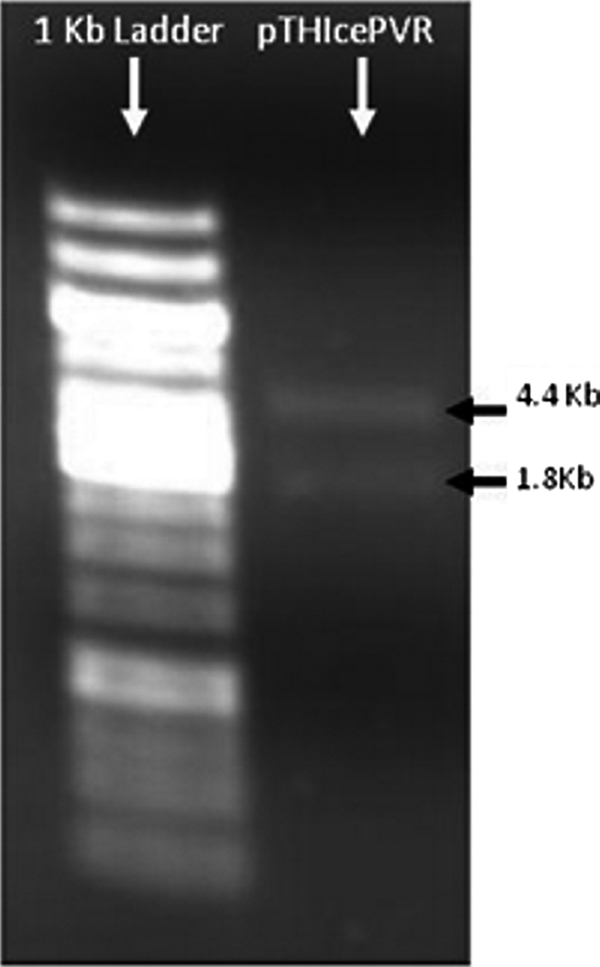
Restriction digest of plasmid construct pTHIcePVR by using NcoI and HindIII. DNA fragments of 1.8 kb and 4.4 kb correspond to the predicted sizes of the constructed ORF and the vector pTrcHisC, respectively.
Results of a time course study for the expression of INP-N-hPVR in E. coli induced by IPTG are provided in Fig. 6. Coomassie-stained SDS-PAGE gels showed increased amounts of a 51-kDa protein and a 40-kDa protein upon IPTG induction (Fig. 6). The open reading frame contains 1.8 kb that encodes 60 amino acid residues, resulting in a predicted protein of 57 kDa. The second band, which was approximately 40 kDa, corresponds to the predicted size of hPVR alone. The fusion proteins are sometimes not stable and they separate after the translation. It appears that both bands are present at time zero, suggesting that the promoter for the fusion protein is leaky. The identity of the 55-kDa protein was confirmed by Western blot analysis as hPVR (Fig. 6). To ensure the specificity of reaction, monoclonal antibodies specific for hPVR were used in the assay, and the detection signal was achieved by secondary antibody. The results of Western blot analysis were verified by a dot blot procedure performed using the same antibodies. The results of a time course study showed an increase in the expression of the fusion protein from time zero to 4 h. However, sufficient protein expression was achieved after 1 h of induction (Fig. 7). During the experiment, untransformed E. coli was used as a negative control. The negative and positive controls in the assays worked properly (Fig. 7).
Fig. 6.

Photograph of Coomassie-stained SDS-PAGE gel of protein extract of the recombinant E. coli. A 55-kDa protein represents poliovirus receptor expressed in the recombinant E. coli. M, protein mass marker ranging from 250 to 11 kDa; lane labels indicate 0 to 4 h after induction.
Fig. 7.

Photograph of dot blot analysis using anti-PVR monoclonal antibody. Rows 1 and 3 show the increased intensity of protein expression after 1 to 4 h of induction. Lane labels indicate hours post-induction. Row 2 shows experimental controls (the first four wells are negative controls, untransformed E. coli) and the fifth well is a positive (+ve) control.
The results of these experiments confirmed successful expression of hPVR in E. coli; however, the exact location and orientation of the expressed protein cannot be assessed from these results. Fusion proteins are known to produce incorrect tertiary structures that affect the topicity of expressed proteins and may cause steric hindrance, thus rendering the proteins nonfunctional in the docking process (6). These issues were addressed by investigating the docking capability of poliovirus particles with the recombinant E. coli. TEM images clearly demonstrate that poliovirus particles attached to the cell surface of the recombinant E. coli. Round particles in the size range of poliovirus (25 to 27 nm) were visibly attached to the outer surface of recombinant E. coli cells even after 2 washes of the cells (Fig. 8). Additionally, no viral particles were detected on control cells, nontransformed E. coli cells (data not shown).
Fig. 8.

TEM image showing poliovirus particles (indicated by arrows) attached to the outer membrane of the recombinant E. coli. (A to C) Samples stained using phosphotungstic acid at pH 6.5. (D) Sample stained using uranyl acetate stain (pH 5.0). The diameter of the poliovirus particle size is approximately 25 nm. Bars = 50 nm (B), 20 nm (C), and 50 nm (D).
The recombinant E. coli, which included the plasmid of pTHIcePVR, was effective in expressing hPVR, which was anchored on the cell surface of E. coli. Furthermore, hPVR was expressed in its proper conformation, which allowed this functional protein to act as a poliovirus receptor.
Poliovirus recovery efficiency by recombinant E. coli.
Sample mixing time was examined to determine whether higher recovery of poliovirus from recombinant E. coli in PBS buffer could be achieved. It was observed that the recovery efficiency improved by 2% by increasing the mixing time from 20 to 60 min; therefore, the longer time was incorporated into the procedure. The recovery efficiency of poliovirus from recombinant E. coli in PBS buffer, tap water, and samples from the Salt River, Verde River, and CAP canal were 99.99%, 98%, 83.5%, 94.3%, and 75.8%, respectively (Tables 3 and 4). In contrast to source water samples, the PBS buffer and tap water samples had low numbers of suspended particles. The low turbidity of test samples may have contributed to the high capture and subsequent recovery in the samples. The initial spike concentration of viruses was 104 PFU/ml, and the application of new methods resulted in 9.7 × 10³ PFU/ml in the pellet and 2.0 × 10² PFU/ml in the supernatant (Table 4). The recovery efficiency concurs with the poliovirus capture efficiency data (Table 4). The turbidity and pH were measured for each water sample and a turbidity of 1 formazin turbidity unit (FTU) was recorded for tap water and the PBS buffer samples.
Table 3.
Recovery efficiency of poliovirus from genetically modified E. coli in PBS buffer after 20 and 60 min of mixinga
| Mixing time | Sample | Total virus (PFU) in: |
% recovery efficiency in: |
||
|---|---|---|---|---|---|
| Supernatant | Resuspended pellet | Supernatant | Resuspended pellet | ||
| 20 min | 1 | 1.9 × 10² | 9.8 × 10³ | 2.00 | 97 |
| 2 | 2.2 × 10² | 9.6 × 10³ | |||
| Mean | 2.0 × 10² | 9.7 × 10³ | |||
| 60 min | 1 | 3.0 × 101 | 9.9 × 10³ | <1 | 99.9 |
| 2 | 2.7 × 101 | 9.9 × 10³ | |||
| 3 | 3.3 × 101 | 9.9 × 10³ | |||
| 4 | 3.8 × 101 | 9.9 × 10³ | |||
| Mean | 32 | 9.9 × 10³ | |||
Total volumes of 50 ml and 1 liter were used for experiments using 20 and 60 min of mixing, respectively.
Table 4.
Recovery efficiency of poliovirus from genetically modified E. coli in 1 liter of tap and source waters
| Sample source | Mean (PFU/ml) | SD | % suspended particles in supernatant | % capture efficiency |
|---|---|---|---|---|
| Tap water | 200 | 0.66 | 2 | 98 |
| Salt River | 1,650 | 591.6 | 16.5 | 83.5 |
| Verde River | 570 | 311.7 | 5.7 | 94.3 |
| CAP canal | 2,417 | 463.1 | 24.2 | 75.8 |
DISCUSSION
Previous studies reported that INP molecules could serve as anchoring motifs for the display of heterologous proteins on bacterial cell surfaces (19). Several attempts were made to test the ability of the full-length INP to act as an anchoring motif for the cell surface display of hPVR. However, in this study a full-length INP-based fusion gene could not be constructed, which probably was due to unsuccessful ligation of the full-length INP gene to hPVR. That may also be due to the large size (>4.6 kb) of the full-length INP. The full-length INP includes N-terminal and C-terminal domains in addition to a highly repetitive central domain of INP—which may include up to 122 major repeats (10), each of which constitutes 48 residues (12). In the full-length INP protein, each major repeat itself consists of 3 repeats of 16 residues (9), which can be depicted as AGYGSTXTAXXXSXLX, where X represents nonconserved residues, and these repeats help in anchoring INP to the outer membrane of the bacterial cell surface. The N- and C-terminal domains have been found to act as better anchoring motifs in comparison to the full-length INP of Pseudomonas syringae (11, 20). Full-length INP has been successfully used in the construction of fusion genes for surface expression (11); however, in the present study, full-length INP failed to construct a fusion gene with hPVR. On the other hand, the ligation of the truncated inaK-N to hPVR showed positive results. We are reporting the construction of an INP-hPVR fusion gene by using a truncated N-terminal domain of INP. This report is consistent with a previous report of using a truncated N-terminal domain of the INP for the expression of green fluorescent protein (GFP) in E. coli (20).
For effective use of the INP derivatives as anchoring motifs for proteins of interest on the cell surface, it is essential to verify the location and activity of expressed proteins. In a previous study, subcellular fractionation was performed to confirm the location of expressed proteins, and GFP was identified on the outer membrane fraction of cell lysate (20). In this study, the inaK fragment consisted of middle domain repeats for enhancing the topicity and steric ability of the expressed protein. In the present case, the steric flexibility of expressed protein is critical for successful docking of viral particles to receptors on the surface of E. coli, which was verified by TEM imaging of viral particles docked on receptors. TEM confirmed a functional hPVR, accurately capturing poliovirus particles that had been mixed with E. coli and washed two times with PBS buffer. The TEM images confirm the effectiveness of the recombinant E. coli that included pTHIcePVR in expressing hPVR on the surface of E. coli cells. In addition, they confirm that hPVR was functional, as it was expressed in a form that does not interfere with its function as a receptor for poliovirus.
Under realistic conditions in the environment, human enteric viruses occur randomly in low numbers. Therefore, a concentration procedure must be included in the early part of any detection methodology. In past decades, several viral concentration methods have been developed and successfully applied in different water quality matrices. The currently available virus concentration methods rely on four principal approaches: (i) adsorption/elution, (ii) entrapment, (iii) ultracentrifugation, and (iv) other techniques relying on phase separation or immune affinity. These methods have been reviewed by Wyn-Jones and Sellwood (30). In general, the recovery efficiencies of these methods are influenced by water quality matrix and the viral strain(s); however, sample filtration rate and viral concentration in a sample do not impact the recovery efficiencies (18). Our newly developed system has clearly demonstrated its ability to capture poliovirus in water and its applicability as a concentration method in 1-liter grab samples. However, viral concentration used to spike the samples in this study is higher than recorded levels in environmental samples, and future research is needed to document the efficiency of the method for low levels of viruses in drinking water and source water samples. In comparison to the conventional USEPA Information Collection Rule (ICR) method, this novel approach used in the proof-of concept study provides the basis for a cost-effective and rapid method for capturing viruses in different qualities of water samples and eliminates the need to adjust and expose sample concentrates to pH 9.5. The use of recombinant bacterial cells for concentrating viral particles in water formulates a novel strategy that can be used for monitoring studies to better understand the spatial and temporal distribution of human enteric viruses in different environmental settings.
ACKNOWLEDGMENTS
Funding for this research was provided by the National Science Foundation Water & Environmental Technology Center at Arizona State University.
We also acknowledge the contribution of Tamer Helmy and the assistance of Gideon Richards.
Footnotes
Published ahead of print on 27 May 2011.
REFERENCES
- 1. Abbaszadegan M., Huber M. S., Gerba C. P., Pepper I. L. 1993. Detection of enteroviruses in groundwater with the polymerase chain reaction. Appl. Environ. Microbiol. 59:1318–1324 [DOI] [PMC free article] [PubMed] [Google Scholar]
- 2. Abbaszadegan M., Stewart P., LeChevallier M. 1999. A strategy for the detection of viruses in water by PCR. Appl. Environ. Microbiol. 65:444–449 [DOI] [PMC free article] [PubMed] [Google Scholar]
- 3. Abbaszadegan M., LeChevallier M., Gerba C. 2003. Occurrence of viruses in US ground waters. J. Am. Water Works Assoc. 95:107–120 [Google Scholar]
- 4. Abbaszadegan M., Monteiro P., Nwachuku N., Alum A., Ryu H. 2008. Removal of adenovirus, calicivirus, and bacteriophages by conventional drinking water treatment. J. Environ. Sci. Health A 43:171–177 [DOI] [PubMed] [Google Scholar]
- 5. Bertani G. 2004. Lysogeny at mid-twentieth century: P1, P2, and other experimental systems. J. Bacteriol. 186:595–600 [DOI] [PMC free article] [PubMed] [Google Scholar]
- 6. Chen W., Georgiou G. 2002. Cell-surface display of heterologous proteins: from high-throughput screening to environmental applications. Biotechnol. Bioeng. 79:496–503 [DOI] [PubMed] [Google Scholar]
- 7. Craun G. F., et al. 2010. Causes of outbreaks associated with drinking water in the United States from 1971 to 2006. Clin. Microbiol. Rev. 23:507–528 [DOI] [PMC free article] [PubMed] [Google Scholar]
- 8. DeLeon R., Shieh C., Baric R. S., Sobsey M. D. 1990. Detection of enteroviruses and hepatitis A virus in environmental samples by gene probes and polymerase chain reaction. Advances in water analysis and treatment. Am. Water Works Assoc. Proc. 1989:833–853 [Google Scholar]
- 9. Graether S. P., Jia Z. 2001. Modeling Pseudomonas syringae ice-nucleation protein as a β-helical protein. Biophys. J. 80:1169–1173 [DOI] [PMC free article] [PubMed] [Google Scholar]
- 10. Green R. L., Corotto L. V., Warren G. J. 1988. Deletion mutagenesis of the ice nucleation gene from Pseudomonas syringae S203. Mol. Gen. Genet. 215:165–172 [DOI] [PubMed] [Google Scholar]
- 11. Jung H. C., Park J. H., Park S. H., Lebeault J. M., Pan J. G. 1998. Expression of carboxymethylcellulase on the surface of Escherichia coli using Pseudomonas syringae ice nucleation protein. Enzyme Microb. Technol. 22:348–354 [DOI] [PubMed] [Google Scholar]
- 12. Kajava A. V., Lindow S. E. 1993. A model of the 3-dimensional structure of ice nucleation proteins. J. Mol. Biol. 232:709–717 [DOI] [PubMed] [Google Scholar]
- 13. Keswick B. H., Gerba C. P., DuPont H. L., Rose J. B. 1984. Detection of enteroviruses in treated drinking water. Appl. Environ. Microbiol. 47:1290–1294 [DOI] [PMC free article] [PubMed] [Google Scholar]
- 14. Keswick B. H., Gerba C. P., Secor S. L., Cech I. 1982. Survival of enteric viruses and indicator bacteria in groundwater. J. Environ. Sci. Health Part A Environ. Sci. Eng. 17:903–912 [Google Scholar]
- 15. Kim E., Yoo S. 1999. Cell surface display of CD8 ecto domain on Escherichia coli using ice nucleation protein. Biotechnol. Tech. 12:197–201 [Google Scholar]
- 16. Kittigul L., et al. 2001. An improved method for concentrating rotavirus from water samples. Mem. Inst. Oswaldo Cruz 96:815–821 [DOI] [PubMed] [Google Scholar]
- 17. Kwak Y., Yoo S., Kim E. 1999. Cell surface display of human immunodeficiency virus type 1 gp120 on Escherichia coli by using ice nucleation protein. Clin. Diagn. Lab. Immunol. 6:499–503 [DOI] [PMC free article] [PubMed] [Google Scholar]
- 18. Lambertini E., et al. 2008. Concentration of enteroviruses, adenoviruses, and noroviruses from drinking water by use of glass wool filters. Appl. Environ. Microbiol. 74:2990–2996 [DOI] [PMC free article] [PubMed] [Google Scholar]
- 19. Lee S. H., Levy D. A., Craun G. F., Beach M. J., Calderon R. L. 2002. Surveillance for waterborne-disease outbreaks—United States, 1999–2000. MMWR Surveill. Summ. 51:1–47 [PubMed] [Google Scholar]
- 20. Li L., Kang D. G., Cha H. J. 2004. Functional display of foreign protein on surface of Escherichia coli using N-terminal domain of ice nucleation protein. Biotechnol. Bioeng. 85:214–221 [DOI] [PubMed] [Google Scholar]
- 21. Lindow S. E. 1990. Bacterial ice nucleation measurements, p. 428–434.In Sands D., Klement Z., Rudolf K. (ed.),Methods in phytobacteriology. Akademia Kiado, Budapest, Hungary. [Google Scholar]
- 22. Melnick J. L. 1990. Enteroviruses: polioviruses, coxsackieviruses, echoviruses and newer enteroviruses, p. 549–605.In Fields B. N. (ed.), Fields virology. Raven Press, New York, NY. [Google Scholar]
- 23. Orser C., et al. 1985. Cloning and expression of bacterial ice nucleation genes in Escherichia coli. J. Bacteriol. 164:359–366 [DOI] [PMC free article] [PubMed] [Google Scholar]
- 24. Payment P. 1981. Isolation of viruses from drinking water at the Pont-Viau Water Treatment Plant. Can. J. Microbiol. 27:417–420 [DOI] [PubMed] [Google Scholar]
- 25. Sambrook J., Russell D. W. 2001. Molecular cloning: a laboratory manual, 3rd ed. Cold Spring Harbor Laboratory Press, Cold Spring Harbor, New York. [Google Scholar]
- 26. U.S. Environmental Protection Agency. 1984. USEPA manual of methods for virology. EPA publication (1984) EPA/600/4-84/013. U.S. Environmental Protection Agency, Washington, DC. [Google Scholar]
- 27. U.S. Environmental Protection Agency. 1996. USEPA, ICR microbial laboratory manual, U.S. EPA Office of Research and Development, Cincinnati (1996) 600/R-95/178. U.S. Environmental Protection Agency, Washington, DC. [Google Scholar]
- 28. U.S. Environmental Protection Agency. 2007. Drinking water infrastructure needs survey and assessment. Fourth Report to Congress (EPA 816-R-09-001). U.S. Environmental Protection Agency, Washington, DC. [Google Scholar]
- 29. Vali G. 1971. Quantitative evaluation of experimental results on the heterogeneous freezing nucleation of supercooled liquids. J. Atmos. Sci. 28:402–409 [Google Scholar]
- 30. Wyn-Jones A. P., Sellwood J. 2001. Enteric viruses in the aquatic environment. J. Appl. Microbiol. 91:945–962 [DOI] [PubMed] [Google Scholar]