

Abstract
Cell wall thickening is a common feature among daptomycin-resistant Staphylococcus aureus strains. However, the mechanism(s) leading to this phenotype is unknown. We examined a number of cell wall synthesis pathway parameters in an isogenic strain set of S. aureus bloodstream isolates obtained from a patient with recalcitrant endocarditis who failed daptomycin therapy, including the initial daptomycin-susceptible parental strain (strain 616) and two daptomycin-resistant strains (strains 701 and 703) isolated during daptomycin therapy. Transmission electron microscopy demonstrated significantly thicker cell walls in the daptomycin-resistant strains than in the daptomycin-susceptible strain, a finding which was compatible with significant differences in dry cell weight of strain 616 versus strains 701 to 703 (P < 0.05). Results of detailed analysis of cell wall muropeptide composition, the degree of peptide side chain cross-linkage, and the amount of the peptidoglycan precursor, UDP-MurNAc-pentapeptide, were similar in the daptomycin-susceptible and daptomycin-resistant isolates. In contrast, the daptomycin-resistant strains contained less O-acetylated peptidoglycan. Importantly, both daptomycin-resistant strains synthesized significantly more wall teichoic acid (WTA) than the parental strain (P < 0.001). Moreover, the proportion of d-alanylated WTA species was substantially higher in the daptomycin-resistant strains than in the daptomycin-susceptible parental strain (P < 0.05 in comparing strain 616 versus strain 701). The latter phenotypic findings correlated with (i) enhanced tagA and dltA gene expression, respectively, and (ii) an increase in surface positive charge observed in the daptomycin-resistant versus daptomycin-susceptible isolates. Collectively, these data suggest that increases in WTA synthesis and the degree of its d-alanylation may play a major role in the daptomycin-resistant phenotype in some S. aureus strains.
INTRODUCTION
Daptomycin has become a key agent for the management of serious Staphylococcus aureus infections, especially for drug-resistant strains, such as methicillin-resistant S. aureus (MRSA) (21, 35). However, a number of recent reports have documented the emergence of in vivo daptomycin-resistant S. aureus strains during unsuccessful therapy with this agent (3, 11, 27). There appear to be several potential mechanisms associated with the daptomycin-resistant phenotype at both the genotypic and phenotypic levels, including (i) increased expression of genes involved in maintenance of the bacterial surface positive charge (e.g., dltABCD or mprF [37, 38, 40]), (ii) perturbations in cell membrane fluidity (18), and (iii) altered cell membrane permeabilization (12). We have recently shown that a common (although not universal) accompaniment of the daptomycin-resistant phenotype is a notably thickened cell wall among such strains (18, 37, 38). Although some investigations have shown the presence of selected cell wall synthetic alterations in daptomycin-resistant S. aureus strains (e.g., changes in peptidoglycan O-acetylation profiles [13]), there has been no systematic study in this arena. We took advantage of the availability of a previously well-characterized isogenic daptomycin-susceptible–daptomycin-resistant S. aureus clinical strain set to compare their cell wall synthetic profiles (12, 22). (Note: although “daptomycin nonsusceptibility” is the generally accepted terminology, we have utilized the term “daptomycin resistance” for ease of presentation.)
MATERIALS AND METHODS
Bacterial strains.
For most of the analyses performed in this study, we employed a previously described isogenic methicillin-susceptible S. aureus (MSSA) clinical strain set from a patient with relapsing endocarditis, including the initial pretherapy daptomycin-susceptible bloodstream isolate (strain 616; daptomycin MIC by standard Etest, 0.5 μg/ml), strain 621, which emerged during vancomycin therapy but prior to daptomycin treatments (daptomycin MIC, 0.5 μg/ml), and two daptomycin-resistant strains obtained during failed daptomycin therapy (MICs, 2.0 μg/ml). The inclusion of strain 621 in selected phenotypic analyses allowed a distinction between the potential impacts of vancomycin versus daptomycin. The clinical details of this patient have been previously published (22). The cell walls of the daptomycin-resistant strains (strains 701 and 703) were significantly thicker by standard transmission electron microscopy (TEM) than those of the daptomycin-susceptible parental strain (28.2 nm and 27.2 nm, respectively, versus 21.9 nm; P < 0.05). These data have been recently reported (38). Of interest, the cell wall thickness of strain 621 (vancomycin exposed, daptomycin unexposed) was not significantly different from that of the parental strain 616 (Fig. 1).
Fig. 1.
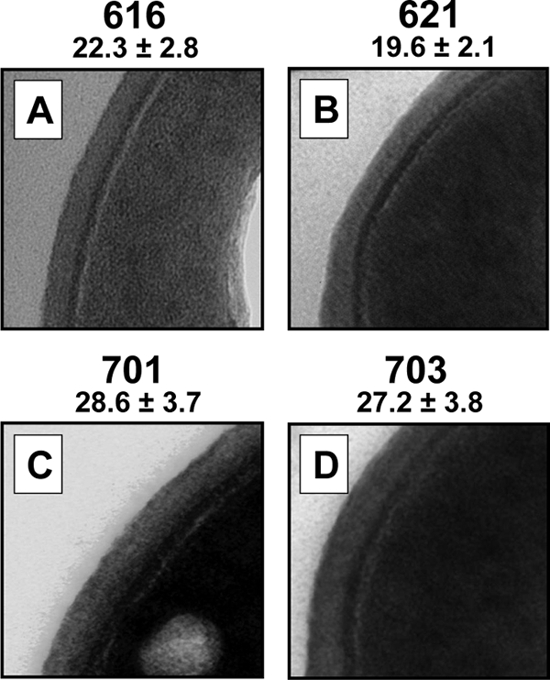
TEM analyses of the daptomycin-susceptible parental strain (616), the vancomycin-exposed but daptomycin-unexposed strain (621), and the two daptomycin-resistant strains (701 and 703). The thickness of cell walls (in nanometers) was measured at ×190,000 magnification. Data (± SD) for strains 616, 701, and 703 have been recently published (37).
Unless otherwise specified, the study strains were cultured to logarithmic phase in Mueller-Hinton broth (MHB). All isolates were kept frozen at −70°C until thawed for use in the various investigations detailed below. The media used for bacterial growth varied depending on the specific assay being done.
Determination of muropeptide composition and cross-linking.
Peptidoglycan of all three strains was isolated from 1 liter of culture in Mueller-Hinton broth (Sigma, St. Louis, MO) grown to an optical density at 578 nm (OD578) of 0.6 (∼108 CFU/ml). The isolation of peptidoglycan was done as previously described (1) but with two additional washes with 1 M NaCl after boiling the cells in SDS. After incubation with EDTA, the pellets were washed twice with double-distilled water (ddH2O), once with acetone, and again twice with ddH2O before lyophilization. Part of the lyophilized peptidoglycan was incubated with hydrofluoric acid (HF) to remove O-acetylation and teichoic acids. After washing, HF-free peptidoglycan was resuspended in 12.5 mM phosphate buffer (pH 5.5) to an OD578 of 3. From this preparation, 125 μl was digested by 62.5 units of mutanolysin (Sigma) for 16 h at 37°C with constant stirring. Mutanolysin was inactivated by boiling for 10 min. All samples were then centrifuged for 10 min and reduced with an equal volume of sodium borohydrate (10 mg/ml in 0.5 M borate buffer, pH 8.0) for 20 min at room temperature. The pH was reduced to 2.0 with 20% H3PO4, and the samples were analyzed on an Agilent HPLC 1200 using a Prontosil 120-3-C18 AQ column (250 by 4.6 mm, 3 μm; Bischoff). Conditions were chosen according to a published method (7). The identity of the peaks was confirmed by mass spectroscopy (MS) and/or retention time. The data represent four independent analyses.
Isolation of peptidoglycan for O-acetylation determination.
Isolation of peptidoglycan for O-acetylation determination was essentially done as described before (1) with some modifications. For each strain, 1 liter of TSB medium (Sigma) was inoculated 1:200 with a fresh overnight culture. The cells were grown to an OD578 of 0.7 and immediately cooled down on ice for 10 min. After centrifugation (6,000 × g, 4°C, 15 min), the pellet was washed once with 100 ml of ice-cold saline and resuspended in 20 ml of fresh saline. The cells were boiled for 20 min in a water bath and pelleted again (17,000 × g, 20°C, 10 min). After resuspension in 1 ml ice-cold saline, the cells were mixed with glass beads (0.15 to 0.25 μm; Sigma) and lysed in a Fastprep FP120 (Thermosavant) (4 × 2 rounds of 20 s on highest speed; the samples were cooled down on ice for 5 min after every second round). To separate the cells from the glass beads, the samples were washed with 25 ml of water on a filter. The cells were centrifuged again (25,000 × g, 20°C, 15 min), resuspended in 10 ml of 2% SDS, and boiled for another 30 min in a water bath. After cooling down to room temperature, the cells were washed free of SDS with warm distilled water until SDS could no longer be detected by the Hayashi test (10). The pellet was then dissolved in 10 ml of buffer (0.1 M Tris/HCl, pH 6.8), and the peptidoglycan-bound proteins were digested by incubation with trypsin (0.5 mg/ml) for 16 h at 37°C while stirring. Afterwards, the cells were washed three times with warm distilled water and then frozen to −80°C for lyophilization.
From each sample of lyophilized peptidoglycan, 1 mg was resuspended in 200 μl buffer (25 mM NaH2PO4, pH 7.0) and digested with 20 units lysostaphin (Sigma) for 16 h at 37°C while stirring. Then, 100 U of mutanolysin (Sigma) was added to each sample, and the incubation proceeded for another 4 h. The enzymes were inactivated by boiling for 5 min.
Nonacetylated and O-acetylated compounds were separated on an Agilent high-performance liquid chromatography (HPLC) system as previously described (1). We used a Prontosil 120-3-C18 AQ column (250 by 4.6 mm, 3 μm; Bischoff), and collected peaks were analyzed by mass spectroscopy. This analysis was done twice in independent runs.
Determination of peptidoglycan precursor.
The peptidoglycan precursor, UDP-MurNAc-pentapeptide, was isolated and quantified from growing cells as described previously (14, 23, 24). Qualitative and quantitative analyses of the samples were done by HPLC using an Agilent 1200 model with a Nucleosil 100 C18 (5 μm) 125 -by 4.6-mm column. An isocratic gradient of 50 mM NaH2PO4 (pH 5.2) was run for 12 min (plus an additional 5 min after end of gradient) at a flow rate of 1 ml/min. The identity of the peaks was determined by mass spectroscopy. A minimum of two independent experiments were performed on separate days.
WTA isolation and purification.
Cell wall and wall teichoic acid (WTA) were isolated as described previously (20, 31). In brief, bacteria were grown overnight in B medium (1% peptone, 0.5% yeast extract, 0.5% NaCl, and 0.1% K2HPO4) containing 0.3% (wt/vol) glucose, washed twice in sodium acetate buffer (20 mM, pH 4.7), and disrupted in the same buffer with glass beads for 1 h on ice in a cell disruptor (Euler). Crude cell lysates were incubated overnight with DNase I (40 units/ml; Roche) and RNase A (80 units/ml; Sigma) at 37°C. Subsequently, an SDS extraction step was performed. Remaining cell wall materials were extensively washed with sodium acetate buffer to remove SDS and soluble cell components. We determined the total amount of protein-free cell wall contained within our strain set by weighing the cell wall after drying. The cell wall dry weight determinations were derived from results of six independent isolations. In parallel, WTA was released from purified cell walls by treatment with 5% trichloroacetic acid in sodium acetate buffer for 4 h at 60°C. Peptidoglycan was removed by centrifugation. WTA was quantified by determining its inorganic phosphate (Pi) content as described previously (31). The isolation was performed in triplicate for each strain and assayed in triplicate for their respective Pi contents.
Quantitation of d-alanine content.
d-Alanylation of the WTA polymers was assayed as described before (17). In brief, d-alanine esters were hydrolyzed by a mild alkaline hydrolysis carried out at 37°C for 1 h in 0.1 M NaOH. The supernatant was neutralized, dried under vacuum, and used for precolumn derivatization with Marfey's reagent (1-fluoro-2,4-dinitrophenyl-5-l-alanine amide; Sigma). The amino acid derivates (detection at 340 nm) were separated on a C18 reversed-phase column (Hypersil ODS; column diameter, 3 mm; length, 125 mm; Bischoff Chromatography, Leonberg, Germany) using a Beckman Coulter HPLC system at 30°C with a flow rate of 1 ml per min by linear gradient elution from 0 to 50% acetonitrile in sodium acetate buffer (20 mM, pH 4) in 10 min. Data were expressed as percentage of WTA (± standard deviation [SD]) that was d-alanylated. A minimum of three independent runs were performed.
Quantification of dlt and tag expression.
For RNA isolation, fresh overnight cultures of S. aureus strains were used to inoculate TSB to an optical density at 600 nm (OD600) of 0.1. Cells were harvested during both exponential and stationary growth phases. Total RNA was isolated from the cell pellets by using the RNeasy kit (Qiagen, Valencia, CA) and the FASTPREP FP120 instrument (BIO 101, Vista, CA), according to the manufacturer's recommended protocols.
One microgram of DNase-treated RNA was reverse transcribed using the SuperScript III first-strand synthesis kit (Invitrogen) according to the manufacturer's protocols. Quantification of cDNA levels was performed following the instructions of the Power SYBR green master mix kit (Applied Biosystems) on an ABI PRISM 7000 sequence detection system (Applied Biosystems) or on a LightCycler using the Quanti Fast SYBR green real-time (RT)-PCR kit (Qiagen). Primers to amplify dltA were dlt-F-1 (5′-GATGCAAATCCACAAAGCAT-3′) and dlt-R (5′-GCACCAATCATCCCAACAAT-3′). Primers for tagA (gene involved in early WTA synthesis) were tagA-F (5′-GTTGCTGATGGGACAGGAGT-3′) and tagA-R (5′-TGCATATTGTGCCGCTTCTA-3′). All RT-PCR experiments for dltA were performed in triplicate. RT-PCR experiments for tagA were performed 3 to 6 times.
Housekeeping gene gyrB transcription levels were used to normalize all data. The primers used for gyrB were gyr-For (5′-TTAGTGTGGGAAATTGTCGATAAT-3′) and gyr-Rev (5′-AGTCTTGTGACAATGCGTTTACA-3′) as described before (4).
Statistical analyses.
The two-tailed Student t test was utilized for comparisons of continuous data sets between strains.
RESULTS
Muropeptide composition.
It has been previously reported that a clinical daptomycin-resistant strain of vancomycin-intermediate S. aureus (VISA) had a peptidoglycan profile which was not as highly cross-linked as that of its daptomycin-susceptible parental strain, suggesting a shift in muropeptide compositions (13). Therefore, we determined the muropeptide profiles and degrees of cross-linkage of our strain set by HPLC analysis. Table 1 shows the percentage of the different muropeptide groups identified, as well as the degree of cross-linkage These parameters were not significantly different in comparing the daptomycin-susceptible and daptomycin-resistant strains. Figure 2 shows the muropeptide pattern of one representative HPLC analysis which includes strain 621. The muropeptide compositional analyses of strain 621 did not resemble those observed in the daptomycin-resistant strains 701 and 703. Certain monomeric and dimeric muropeptides are modestly different in strain 621 (indicated by arrows) compared to those in strain 616; in contrast, strains 701 and 703 exhibit the same overall pattern as strain 616. Therefore, strain 621 was not included in calculations concerning peptidoglycan analysis.
Table 1.
Muropeptide composition
| Strain | % of muropeptide(s)a |
||||
|---|---|---|---|---|---|
| Monomers | Dimers | Trimers | Oligomers | Cross-linkage | |
| 616 | 6.13 ± 0.16 | 12.84 ± 1.07 | 9.67 ± 1.13 | 71.36 ± 1.58 | 77.09 ± 0.47 |
| 701 | 6.69 ± 0.14 | 13.98 ± 0.87 | 9.89 ± 1.39 | 69.44 ± 2.19 | 76.08 ± 0.61 |
| 703 | 6.71 ± 0.21 | 13.93 ± 0.89 | 9.89 ± 1.11 | 69.47 ± 1.92 | 76.08 ± 0.59 |
The numbers give the sums of the peak areas of the indicated fraction. Each number is the mean value (± SD) of results of four different analyses. Cross-linkage was calculated as described before (28): 0.5 × dimers (%) + 0.67 × trimers (%) + 0.9 × oligomers (%).
Fig. 2.
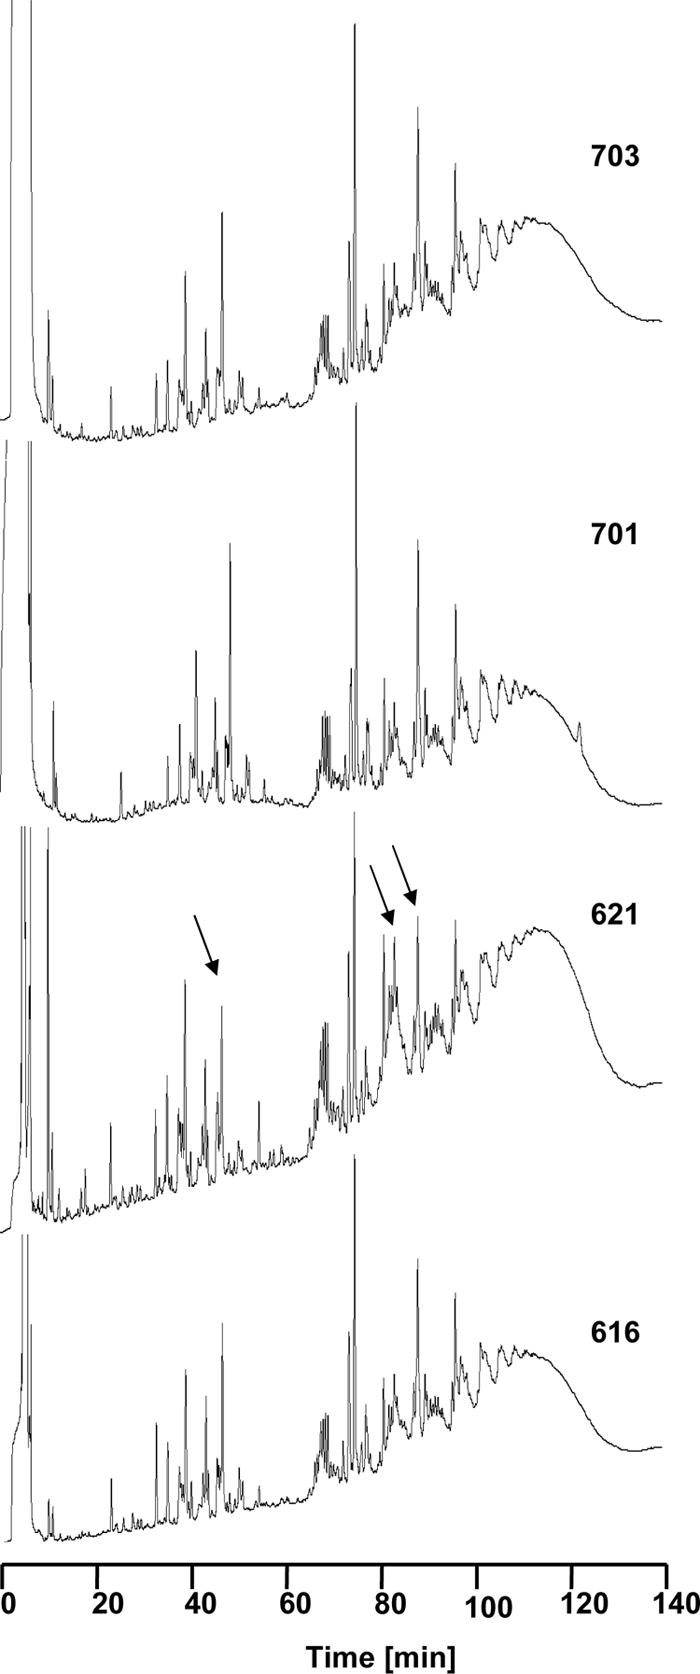
Muropeptide pattern. The cell wall of all four strains was isolated and digested by muraminidase mutanolysin and analyzed by HPLC. The muropeptide patterns of strains 616, 701 and 703 were always very similar. Differences in the muropeptide pattern of strain 621 compared to those of the other three strains are indicated by black arrows.
Degree of O-acetylation.
A certain percentage of the N-acetylmuramic acid (MurNAcs) species localized within the peptidoglycan of S. aureus become O-acetylated on position C6 by a protein called OatA (1). We therefore determined the comparative extent of O-acetylation in our strain set (Fig. 3). The ratio of nonacetylated to acetylated muropeptide species did not differ between strain 616 and strains 701 and 703 (∼55% to ∼45%, respectively; Table 2).
Fig. 3.

Determination of O-acetylated muropeptides by HPLC analysis. The cell walls of all three strains were isolated and enzymatically digested into monomeric muropeptides by mutanolysin and lysostaphin. The O-acetylated and nonacetylated muropeptides were separated by HPLC, and the content of the two most prevalent peak groups was determined by MS. The peak group at retention time 60 to 75 min contains nonacetylated muropeptides, while the muropeptides at the peak retention times of 75 to 85 min are O-acetylated.
Table 2.
Comparison of proportions of muropeptide O-acetylation
| Muropeptide type | Valuea for strain: |
||
|---|---|---|---|
| 616 | 701 | 703 | |
| Nonacetylated | 55.38 ± 0.1 | 56.31 ± 2.0 | 55.09 ± 0.49 |
| O-acetylated | 44.62 ± 0.1 | 43.69 ± 2.0 | 44.91 ± 0.49 |
The muropeptides were separated by HPLC into nonacetylated and O-acetylated compounds. The values are percentages of the sums of both area peaks (± SD). The experiments were done twice.
Peptidoglycan precursors.
One possible explanation for a relatively thicker cell wall observed in the daptomycin-resistant strains, 701 and 703, is that they are merely synthesizing more peptidoglycan. To address this possibility, the peptidoglycan precursor, UDP-MurNAc-pentapeptide, was quantified. Figure 4 shows the HPLC profile of the UDP-MurNAc-pentapeptide precursor present in the study strains. This chromatogram indicates that the amount of this peptidoglycan precursor was actually somewhat greater in the parental strain (strain 616) than in the two daptomycin-resistant mutant strains.
Fig. 4.
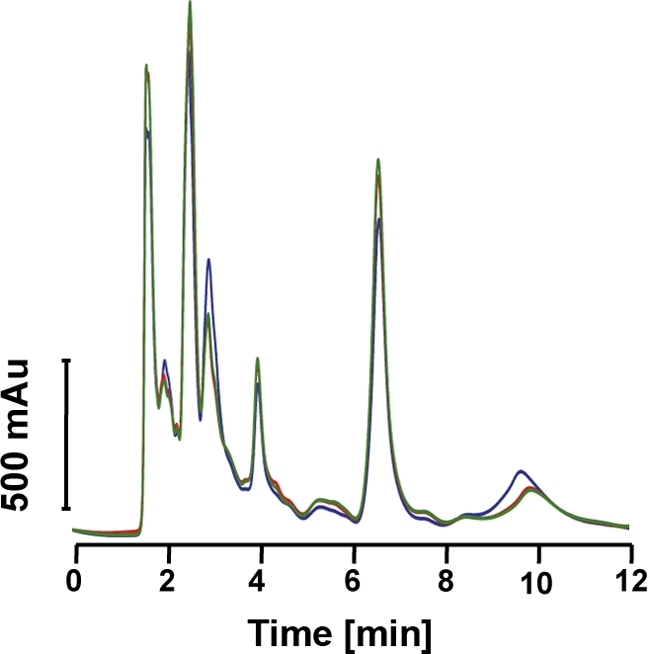
Analysis of the amount of the peptidoglycan precursor UDP-MurNAc-pentapeptide. The peptidoglycan precursor UDP-MurNAc-pentapeptide was isolated from growing cells, and its amount for each strain was detected by HPLC (blue, 616; red, 701; green, 703).
Total cell wall and WTA content.
We detected significant differences in the amount of total cell wall produced by the daptomycin-susceptible versus daptomycin-resistant isolates. The cell wall dry weight per gram of cell wall wet weight in strain 616 was 15.32 (± 5.6) mg versus those in strain 701 at 24.44 (± 4.8) mg and strain 703 at 25.64 (± 5.5) mg. The differences in cell wall dry weight reached statistical significance when strain 616 was compared with either strain 701 (P = 0.0125) or strain 703 (P = 0.0089). The cell wall dry weight exhibited by strain 621 (vancomycin exposed, not daptomycin exposed) was not significantly different from that of strain 616 (18.17 ± 3.3 mg, P = 0.0638) (Table 3). Importantly, there were significant differences in the amounts of WTA found in the cell walls of this strain set, with both strains 701 (84.80 ± 4.4) and 703 (85.75 ± 2.4) producing more WTA than strain 616 (50.76 ± 4.1) (P = 0.0006 and P = 0.0002, respectively). The amount of WTA exhibited by strain 621 (64.64 ± 8.5) was not significantly different from that of strain 616 (P = 0.24) but significantly different from those of both strain 701 and strain 703 (P = 0.0219 and P = 0.0144, respectively) (Table 3).
Table 3.
Cell wall dry weight, amount of WTA, and degree of WTA d-alanylation in studied strainsa
| Strain | Cell wall dry wt |
Amt of WTA in cell wall prepn |
Degree of WTA d-alanylation |
|||
|---|---|---|---|---|---|---|
| mg cell wall dry wt/g cell wall wet wt | P | nmol phosphorus/mg cell wall dry wt | P | nmol d-alanine/nmol phosphorus compared to strain 616 | P | |
| 616 | 15.32 ± 5.55 | 50.76 ± 4.12 | 0.41 ± 0.130 | |||
| 621 | 18.17 ± 3.25 | P = 0.0638 | 64.64 ± 8.51 | P = 0.2435 | 0.48 ± 0.142 | P = 0.5534 |
| 701 | 24.44 ± 4.83 | P = 0.0125, P = 0.0246 | 84.80 ± 4.42 | P = 0.0006, P = 0.0219 | 0.81 ± 0.135 | P = 0.0215, P = 0.045 |
P values are based on comparisons with corresponding results for strain 616 or 621.
WTA d-alanylation.
In addition to the significant increases in overall WTA content of the daptomycin-resistant strains above, there were also substantial differences in the proportion of WTA that was d-alanylated when comparing the study isolates. Thus, the amounts of d-alanine contained within the WTA (nmol d-alanine/nmol Pi) in strains 701 (0.81 ± 0.14) and 703 (0.62 ± 0.21) were higher than that observed in strain 616 (0.41 ± 0.13), although only the difference between strains 616 and 701 reached statistical significance (P = 0.0215). The proportion of WTA that was d-alanylated in strain 621 (0.48 ± 0.14) was not significantly different from that of strain 616 (P = 0.55) but was significantly lower than those of the daptomycin-resistant strains (Table 3).
Quantitative RT-PCR analyses.
Transcription levels of tagA, an early gene in the WTA biosynthesis pathway, were higher in strain 701 than in strain 616 at log phase (1.4-fold ± 0.21; P < 0.05). There were no differences in tagA transcription between strains at stationary growth (Fig. 5). Transcription of the dlt operon was significantly enhanced in the daptomycin-resistant strain 701, compared with that of the parental 616 strain, during both exponential growth (3.1-fold ± 0.56 versus strain 616; P < 0.01) and stationary growth (5.2-fold ± 1.94 versus strain 616; P < 0.01) (Fig. 5), although the total expression levels were relatively low in the latter growth phase.
Fig. 5.

Relative transcript levels of the dltA gene and tagA gene in strains 616 and 701. Values from exponential and stationary growth phase RNA samples were normalized versus housekeeping gene, gyrB, expression levels; data from strain 616 were set to 1 to allow comparison of data from different samples. * P < 0.05 and ** P < 0.001 versus 616.
DISCUSSION
Daptomycin is felt to principally target the bacterial cell membrane and exert microbicidal activity via membrane perturbation, small ion leakage, and dissipation of the membrane potential (25, 26, 30). Thus, adaptations of the cell membrane (e.g., enhanced membrane fluidity/rigidity, altered phospholipid production and translocation profiles, increased relative positive surface charge) (12, 18, 37, 39) have been documented in daptomycin-resistant strains generated in vitro or isolated in vivo. However, a number of lines of evidence have suggested that the cell wall, especially in staphylococci, may play a role in the daptomycin-resistant phenotype. Several recent investigations have shown that daptomycin-resistant S. aureus isolates from in vitro selection or clinical sources exhibited significantly thicker cell walls than their respective daptomycin-susceptible parental strains (5, 6, 18). Of note, in some of these reports, the daptomycin-resistant S. aureus strain concomitantly demonstrated the VISA phenotype, making it difficult to discern which phenotype was “driving” the adaptive cell wall response (5, 6). In a recent survey, Yang et al. (38) confirmed among non-VISA strains that daptomycin-resistant S. aureus strains commonly, but not universally, displayed cell wall thickening (∼50% frequency). In addition to these cell wall structural studies, Muthaiyan et al. (19) investigated the transcriptional profile of daptomycin in vitro-exposed S. aureus cells, and showed that in consort with inducing genes consistent with membrane depolarization, a cadre of genes were affected by daptomycin exposures which are involved in the cell wall stress stimulon. Of importance, when the transcriptomic profiles of daptomycin, vancomycin, and oxacillin inductions were compared, there was a consensus in the activation of a number of key genes involved in cell wall synthesis by all three, including vraSR, murAB, pbpB, tcaA, and the various tag genes. Thus, clearly, daptomycin can induce the cell wall stress stimulon in a manner similar to those of other cell wall-active agents. Finally, Julian et al. (13) evaluated 29 clinical VISA daptomycin-resistant isolates for cell wall profiles. They showed that in comparison to a control daptomycin-susceptible VISA strain, the daptomycin-resistant isolates showed (i) no variation in qualitative cell wall muropeptide composition, (ii) reduced cross-linking, and (iii) an ∼2-fold decrease in the extent of O-acetylation of muramic acid. They hypothesized that such “drastic” reductions in O-acetylation could lead to altered hydrophobicity and surface charge, as well as altered substrate properties in terms of cell wall autolytic enzymes (13).
Our current studies were designed to extend and amplify upon these previous investigations by (i) performing a more extensive profiling of cell wall parameters in isogenic daptomycin-susceptible and daptomycin-resistant strain sets, (ii) correlating these cell wall compositional features with surface charge and cell wall thickness profiles, and (iii) determining the transcriptional profiles of specific genes involved in pivotal steps in cell wall biosynthesis. Several key themes emerged from the present studies. First, our daptomycin-resistant isolates did show thickened cell walls by TEM compared to those of the daptomycin-susceptible parental strain, even though this strain was not a VISA by MIC testing (12, 38). Paralleling these TEM findings, both daptomycin-resistant isolates produced significantly more total cell wall (by weight) than the parental strain and strain 621 (vancomycin exposed, daptomycin unexposed).
Second, similar to the published studies cited above, our detailed cell wall muropeptide analyses did not identify any major differences in predominant muropeptide species between strains. We also found indirect evidence for differences in the O-acetylation profiles. The ratios of non-O-acetylated to O-acetylated compounds were similar in comparing the daptomycin-resistant versus daptomycin-susceptible strains. However, given the overall increase in the amount of WTA in the daptomycin-resistant strains, it is likely that WTA-containing muropeptides (which cannot be analyzed by the HPLC method utilized in our study) were increased. This, in turn, might be considered an actual decrease in net peptidoglycan O-acetylation in the daptomycin-resistant strains. However, as opposed to previous investigations, we did not observe any comparative shifts in degrees of cross-linking in our strain set (13, 15). The disparity between our muropeptide data sets and the results of these latter investigations could well be based in strain differences, especially in the context of the VISA phenotype displayed in the isolates used in previous studies (not seen in our strain set).
Third, since excess peptidoglycan synthesis itself might account for the thickened cell wall phenotype, we quantified the major peptidoglycan precursor, UDP-MurNAc-pentapeptide, and found no differences among the strain set. If anything, the amount of peptidoglycan precursor was reduced in the daptomycin-resistant mutants.
Fourth, reductions in cell wall autolysis might also underlie a thickened cell wall phenotype; however, in recent analyses, only modest differences among this strain set were detected in terms of detergent-induced, vancomycin-induced, and daptomycin-induced autolysis (12).
Fifth, and most importantly, we demonstrated that the daptomycin-resistant phenotype was clearly correlated with the enhanced capacity of these isolates to synthesize and d-alanylate WTA compared to the daptomycin-susceptible parental strain. Of note, we have recently compared the gene expression profiles of the same strain set by microarray analyses (9). These studies confirmed a significant upregulation of the tag gene ensemble responsible for WTA production in the daptomycin-resistant versus daptomycin-susceptible strain (tagO, 1.2-fold increase; tagA, 3.5-fold increase; tagB, 1.2-fold increase; tagD, 2.2-fold increase; tagG, 2.4-fold increase; and tagH, 1.2-fold increase). Of interest, in the current study, we also detected substantial upregulation of the early WTA biosynthesis gene, tagA, in daptomycin-resistant strain 701. Finally, expression profiling of the dlt gene cluster (responsible for d-alanylation of WTA), a major contributor to the maintenance of relative cell wall positive charge (20, 34, 37), confirmed its upregulation in the daptomycin-resistant versus daptomycin-susceptible isolates. Collectively, these transcriptional profiles for tagA and dlt correlate well with the phenotypic observations noted in the daptomycin-resistant strains in the present investigation: (i) thickened cell walls ultrastructurally, (ii) increased cell wall dry weight, (iii) increased WTA production and d-alanylation, and (iv) enhanced net surface positive charge (12). Of interest, strain 703 did not exhibit a significantly increased proportionality of d-alanylation of WTA versus that of the parental 616 strain. However, it should be underscored that, because of the significantly greater amount of WTA synthesized in strain 703 then in strain 616, the composite result is undoubtedly more net amounts of d-alanylated cell wall species. This notion is supported by the increased net positive surface charge seen in both strains 701 and 703 versus parental strain 616 as described previously (12).
Vancomycin exposures in S. aureus can induce some of the same phenotypic perturbations seen in our daptomycin-resistant strains, particularly thickened cell walls (6). Thus, it was important to document whether the cell wall abnormalities we observed were induced only by daptomycin exposures and not by prior vancomycin exposures in the patient strains of interest. By a number of parameters, including cell wall thickness measurements, cell wall dry weights, WTA quantitations, and d-alanylation proportionalities (isolated after vancomycin treatment, but before daptomycin treatment), strain 621 was not significantly different from the parental strain (strain 616). Also, the muropeptide profiles revealed that strain 621 was clearly different from strains 701 and 703. Collectively, these findings unambiguously demonstrate that the cell wall perturbations we observed were not due to the short duration of vancomycin treatment, prior to daptomycin treatment. However, we recognize that vancomycin exposure may have “primed” parental strain 616 to subsequently develop a daptomycin-resistant phenotype during daptomycin exposure.
The integrated biosynthesis of both peptidoglycan and WTA occurs in the context of an undecaprenyl phosphate backbone, which is also utilized for transport of the respective precursors across the cytoplasmic membrane. It has been speculated before that blocking WTA biosynthesis at later stages is lethal to the cell, as accumulation of WTA precursors leads to a depletion of free lipid carrier, thereby impairing peptidoglycan biosynthesis (8, 31, 36). Therefore, it is tempting to hypothesize that upregulation of WTA biosynthesis in the daptomycin-resistant isolates explains the reduced production of UDP-MurNAc-pentapeptide, compared to that of the daptomycin-susceptible isolates. We propose that in the current strain set, the main impetus for enhanced cell wall thickness is a perturbation in tag operon expression and translation. It will be of interest to study additional daptomycin-resistant staphylococcal isolates for similar cell wall synthetic gene perturbations. Moreover, it will be important to determine the genetic mechanism(s) and pathways underlying both upregulated WTA synthesis and its d-alanylation, in relation to the daptomycin-resistant phenotype. However, our investigations emphasize, for the first time, that upregulation of the biosynthesis and d-alanylation of the major cell wall polymer (WTA) is an important component of a daptomycin-resistant phenotype. Of note, WTA has considerable impact on the pathogenic potential of S. aureus (32, 33) and plays an important role in experimental endocarditis by modulating and enhancing S. aureus adhesion to endothelial surfaces and cardiac vegetations (34).
We recognize that our study has a number of limitations. We were not able to study detailed metabolic pathways in our investigation. Also, we did not analyze certain cell wall properties that might influence either cell wall structure or charge, such as glycan chain length (2) and d-glutamate amidation within muropeptides (16, 29), respectively. Further, we did not determine the relative cocontributions of overall increases in WTA synthesis (via the tag ensemble) versus net amounts of d-alanylated species (via the dlt operon) to the daptomycin-resistant phenotype. Such investigation will require the construction of a number of strategic knockouts and complemented variants and are beyond the scope of the current study. Such important studies are in progress in our laboratories. Finally, we appreciate that we analyzed only a single methicillin-susceptible S. aureus strain set, and our findings may well be strain specific and not generalizable to MRSA. This detailed cell wall profiling needs to be carried out with additional well-characterized daptomycin-susceptible–daptomycin-resistant strain sets.
ACKNOWLEDGMENTS
U.B. was supported by German Research Foundation grant SFB766. C.W. was supported by German Research Foundation grants SFB766 and TR-SFB34 and Fortüne Grant 1846-0-0 by the Medical Faculty of the University of Tübingen. J.S. and P.F. are supported by the Swiss National Science Foundation grants 31003A-124717/1 and 3100A0 116075, respectively. A.S.B. and M.R.Y. were supported by grants from the National Institute of Allergy and Infectious Diseases (grant AI-39108 and grants AI-39001 and AI-48031, respectively).
We thank Andreas Peschel (Tübingen, Germany) for many helpful discussions and guidance in these investigations. We thank Andreas Kulik (Tübingen) for MS analysis. We also thank Larissa Kull for WTA isolation and Mulugeta Nega for assistance with d-alanine content determination.
Footnotes
Published ahead of print on 23 May 2011.
REFERENCES
- 1. Bera A., Herbert S., Jakob A., Vollmer W., Gotz F. 2005. Why are pathogenic staphylococci so lysozyme resistant? The peptidoglycan O-acetyltransferase OatA is the major determinant for lysozyme resistance of Staphylococcus aureus. Mol. Microbiol. 55:778–787 [DOI] [PubMed] [Google Scholar]
- 2. Boneca I. G., Huang Z. H., Gage D. A., Tomasz A. 2000. Characterization of Staphylococcus aureus cell wall glycan strands, evidence for a new beta-N-acetylglucosaminidase activity. J. Biol. Chem. 275:9910–9918 [DOI] [PubMed] [Google Scholar]
- 3. Boucher H. W., Sakoulas G. 2007. Perspectives on daptomycin resistance, with emphasis on resistance in Staphylococcus aureus. Clin. Infect. Dis. 45:601–608 [DOI] [PubMed] [Google Scholar]
- 4. Burian M., et al. 2010. Temporal expression of adhesion factors and activity of global regulators during establishment of Staphylococcus aureus nasal colonization. J. Infect. Dis. 201:1414–1421 [DOI] [PubMed] [Google Scholar]
- 5. Camargo I. L., Neoh H. M., Cui L., Hiramatsu K. 2008. Serial daptomycin selection generates daptomycin-nonsusceptible Staphylococcus aureus strains with a heterogeneous vancomycin-intermediate phenotype. Antimicrob. Agents Chemother. 52:4289–4299 [DOI] [PMC free article] [PubMed] [Google Scholar]
- 6. Cui L., Tominaga E., Neoh H. M., Hiramatsu K. 2006. Correlation between reduced daptomycin susceptibility and vancomycin resistance in vancomycin-intermediate Staphylococcus aureus. Antimicrob. Agents Chemother. 50:1079–1082 [DOI] [PMC free article] [PubMed] [Google Scholar]
- 7. de Jonge B. L., Chang Y. S., Gage D., Tomasz A. 1992. Peptidoglycan composition of a highly methicillin-resistant Staphylococcus aureus strain. The role of penicillin binding protein 2A. J. Biol. Chem. 267:11248–11254 [PubMed] [Google Scholar]
- 8. D'Elia M. A., et al. 2006. Lesions in teichoic acid biosynthesis in Staphylococcus aureus lead to a lethal gain of function in the otherwise dispensable pathway. J. Bacteriol. 188:4183–4189 [DOI] [PMC free article] [PubMed] [Google Scholar]
- 9. Fischer A., et al. 28 May 2011, posting date Daptomycin resistance mechanisms in clinically derived Staphylococcus aureus strains assessed by a combined transcriptomics and proteomics approach. J. Antimicrob. Chemother. doi:10.1093/jac/dkr195 [DOI] [PMC free article] [PubMed] [Google Scholar]
- 10. Hayashi K. 1975. A rapid determination of sodium dodecyl sulfate with methylene blue. Anal. Biochem. 67:503–506 [DOI] [PubMed] [Google Scholar]
- 11. Hayden M. K., et al. 2005. Development of Daptomycin resistance in vivo in methicillin-resistant Staphylococcus aureus. J. Clin. Microbiol. 43:5285–5287 [DOI] [PMC free article] [PubMed] [Google Scholar]
- 12. Jones T., et al. 2008. Failures in clinical treatment of Staphylococcus aureus infection with daptomycin are associated with alterations in surface charge, membrane phospholipid asymmetry, and drug binding. Antimicrob. Agents Chemother. 52:269–278 [DOI] [PMC free article] [PubMed] [Google Scholar]
- 13. Julian K., et al. 2007. Characterization of a daptomycin-nonsusceptible vancomycin-intermediate Staphylococcus aureus strain in a patient with endocarditis. Antimicrob. Agents Chemother. 51:3445–3448 [DOI] [PMC free article] [PubMed] [Google Scholar]
- 14. Kohlrausch U., Holtje J. V. 1991. One-step purification procedure for UDP-N-acetylmuramyl-peptide murein precursors from Bacillus cereus. FEMS Microbiol. Lett. 62:253–257 [DOI] [PubMed] [Google Scholar]
- 15. Kosowska-Shick K., et al. 2006. Abstr. 46th Intersci. Conf. Antimicrob. Agents Chemother., San Francisco, CA, 27 to 30 September 2006, abstr. C1-685, p. 77 [Google Scholar]
- 16. Kraus D., et al. 2007. Muropeptide modification-amidation of peptidoglycan d-glutamate does not affect the proinflammatory activity of Staphylococcus aureus. Infect. Immun. 75:2084–2087 [DOI] [PMC free article] [PubMed] [Google Scholar]
- 17. Kristian S. A., et al. 2005. d-Alanylation of teichoic acids promotes group a streptococcus antimicrobial peptide resistance, neutrophil survival, and epithelial cell invasion. J. Bacteriol. 187:6719–6725 [DOI] [PMC free article] [PubMed] [Google Scholar]
- 18. Mishra N. N., et al. 2009. Analysis of cell membrane characteristics of in vitro-selected daptomycin-resistant strains of methicillin-resistant Staphylococcus aureus. Antimicrob. Agents Chemother. 53:2312–2318 [DOI] [PMC free article] [PubMed] [Google Scholar]
- 19. Muthaiyan A., Silverman J. A., Jayaswal R. K., Wilkinson B. J. 2008. Transcriptional profiling reveals that daptomycin induces the Staphylococcus aureus cell wall stress stimulon and genes responsive to membrane depolarization. Antimicrob. Agents Chemother. 52:980–990 [DOI] [PMC free article] [PubMed] [Google Scholar]
- 20. Peschel A., et al. 1999. Inactivation of the dlt operon in Staphylococcus aureus confers sensitivity to defensins, protegrins, and other antimicrobial peptides. J. Biol. Chem. 274:8405–8410 [DOI] [PubMed] [Google Scholar]
- 21. Sakoulas G., et al. 2003. Staphylococcus aureus accessory gene regulator (agr) group II: is there a relationship to the development of intermediate-level glycopeptide resistance? J. Infect. Dis. 187:929–938 [DOI] [PubMed] [Google Scholar]
- 22. Sakoulas G., et al. 2008. Evaluation of endocarditis caused by methicillin-susceptible Staphylococcus aureus developing nonsusceptibility to daptomycin. J. Clin. Microbiol. 46:220–224 [DOI] [PMC free article] [PubMed] [Google Scholar]
- 23. Schneider T., et al. 2009. The lipopeptide antibiotic friulimicin B inhibits cell wall biosynthesis through complex formation with bactoprenol phosphate. Antimicrob. Agents Chemother. 53:1610–1618 [DOI] [PMC free article] [PubMed] [Google Scholar]
- 24. Schneider T., et al. 2004. In vitro assembly of a complete, pentaglycine interpeptide bridge containing cell wall precursor (lipid II-Gly5) of Staphylococcus aureus. Mol. Microbiol. 53:675–685 [DOI] [PubMed] [Google Scholar]
- 25. Schriever C. A., Fernandez C., Rodvold K. A., Danziger L. H. 2005. Daptomycin: a novel cyclic lipopeptide antimicrobial. Am. J. Health Syst. Pharm. 62:1145–1158 [DOI] [PubMed] [Google Scholar]
- 26. Silverman J. A., Perlmutter N. G., Shapiro H. M. 2003. Correlation of daptomycin bactericidal activity and membrane depolarization in Staphylococcus aureus. Antimicrob. Agents Chemother. 47:2538–2544 [DOI] [PMC free article] [PubMed] [Google Scholar]
- 27. Skiest D. J. 2006. Treatment failure resulting from resistance of Staphylococcus aureus to daptomycin. J. Clin. Microbiol. 44:655–656 [DOI] [PMC free article] [PubMed] [Google Scholar]
- 28. Stranden A. M., Ehlert K., Labischinski H., Berger-Bachi B. 1997. Cell wall monoglycine cross-bridges and methicillin hypersusceptibility in a femAB null mutant of methicillin-resistant Staphylococcus aureus. J. Bacteriol. 179:9–16 [DOI] [PMC free article] [PubMed] [Google Scholar]
- 29. Stranden A. M., Roos M., Berger-Bachi B. 1996. Glutamine synthetase and heteroresistance in methicillin-resistant Staphylococcus aureus. Microb. Drug Resist. 2:201–207 [DOI] [PubMed] [Google Scholar]
- 30. Straus S. K., Hancock R. E. 2006. Mode of action of the new antibiotic for Gram-positive pathogens daptomycin: comparison with cationic antimicrobial peptides and lipopeptides. Biochim. Biophys. Acta 1758:1215–1223 [DOI] [PubMed] [Google Scholar]
- 31. Weidenmaier C., et al. 2004. Role of teichoic acids in Staphylococcus aureus nasal colonization, a major risk factor in nosocomial infections. Nat. Med. 10:243–245 [DOI] [PubMed] [Google Scholar]
- 32. Weidenmaier C., McLoughlin R. M., Lee J. C. 2010. The zwitterionic cell wall teichoic acid of Staphylococcus aureus provokes skin abscesses in mice by a novel CD4+ T-cell-dependent mechanism. PLoS One 5:e13227. [DOI] [PMC free article] [PubMed] [Google Scholar]
- 33. Weidenmaier C., Peschel A. 2008. Teichoic acids and related cell-wall glycopolymers in Gram-positive physiology and host interactions. Nat. Rev. Microbiol. 6:276–287 [DOI] [PubMed] [Google Scholar]
- 34. Weidenmaier C., et al. 2005. Lack of wall teichoic acids in Staphylococcus aureus leads to reduced interactions with endothelial cells and to attenuated virulence in a rabbit model of endocarditis. J. Infect. Dis. 191:1771–1777 [DOI] [PubMed] [Google Scholar]
- 35. Wootton M., MacGowan A. P., Walsh T. R. 2006. Comparative bactericidal activities of daptomycin and vancomycin against glycopeptide-intermediate Staphylococcus aureus (GISA) and heterogeneous GISA isolates. Antimicrob. Agents Chemother. 50:4195–4197 [DOI] [PMC free article] [PubMed] [Google Scholar]
- 36. Xia G., Peschel A. 2008. Toward the pathway of S. aureus WTA biosynthesis. Chem. Biol. 15:95–96 [DOI] [PubMed] [Google Scholar]
- 37. Yang S. J., et al. 2009. Enhanced expression of dltABCD is associated with the development of daptomycin nonsusceptibility in a clinical endocarditis isolate of Staphylococcus aureus. J. Infect. Dis. 200:1916–1920 [DOI] [PMC free article] [PubMed] [Google Scholar]
- 38. Yang S. J., et al. 2010. Cell wall thickening is not a universal accompaniment of the daptomycin nonsusceptibility phenotype in Staphylococcus aureus: evidence for multiple resistance mechanisms. Antimicrob. Agents Chemother. 54:3079–3085 [DOI] [PMC free article] [PubMed] [Google Scholar]
- 39. Yang S. J., et al. 2005. A LysR-type regulator, CidR, is required for induction of the Staphylococcus aureus cidABC operon. J. Bacteriol. 187:5893–5900 [DOI] [PMC free article] [PubMed] [Google Scholar]
- 40. Yang S. J., et al. 2009. Regulation of mprF in daptomycin-nonsusceptible Staphylococcus aureus strains. Antimicrob. Agents Chemother. 53:2636–2637 [DOI] [PMC free article] [PubMed] [Google Scholar]