Abstract
Hepatitis B virus (HBV) carrying the A1762T/G1764A double mutation in the basal core promoter (BCP) region is associated with HBe antigen seroconversion and increased risk of liver cirrhosis and hepatocellular carcinoma (HCC). Quantification of the mutant viruses may help in predicting the risk of HCC. However, the viral genome tends to have nucleotide polymorphism, which makes it difficult to design hybridization-based assays including real-time PCR. Ultrasensitive quantification of the mutant viruses at the early developmental stage is even more challenging, as the mutant is masked by excessive amounts of the wild-type (WT) viruses. In this study, we developed a selective inhibitory PCR (siPCR) using a locked nucleic acid-based PCR blocker to selectively inhibit the amplification of the WT viral DNA but not the mutant DNA. At the end of siPCR, the proportion of the mutant could be increased by about 10,000-fold, making the mutant more readily detectable by downstream applications such as real-time PCR and DNA sequencing. We also describe a primer-probe partial overlap approach which significantly simplified the melting curve patterns and minimized the influence of viral genome polymorphism on assay accuracy. Analysis of 62 patient samples showed a complete match of the melting curve patterns with the sequencing results. More than 97% of HBV BCP sequences in the GenBank database can be correctly identified by the melting curve analysis. The combination of siPCR and the SimpleProbe real-time PCR enabled mutant quantification in the presence of a 100,000-fold excess of the WT DNA.
INTRODUCTION
Chronic infection by hepatitis B virus (HBV) is one of the major risk factors for liver cirrhosis and hepatocellular carcinoma (HCC) (13, 15, 16). While immune-mediated chronic liver injury appears to be one of the major mechanisms of disease progression, the viruses, including certain mutant viruses, may contribute to the pathogenesis and carcinogenesis at multiple levels (1, 10, 20, 25). In particular, the A1762T/G1764A double mutation in the basal core promoter (BCP) region of the viral genome has been linked to increased virulence and disease progression to cirrhosis and HCC (3, 7, 11, 12, 26). This mutation can be found in the common HBV genotypes (A to D), although the prevalence may vary (2, 9). A recent study indicated that quantification of the BCP A1762T/G1764A mutant titers helps to predict the risk of HCC (27). However, the assay requires improvement to cope with viral genome polymorphisms, which may significantly affect any hybridization-based assays including real-time PCR.
The A1762T/G1764A mutation is also associated with the loss of hepatitis B e antigen (HBeAg) in the serum and the concomitant appearance of anti-HBeAg antibody, a process known as HBeAg seroconversion (4, 17). However, previous investigations of the A1762T/G1764A double mutation relied on DNA sequencing, which is qualitative in nature. Thus, many questions regarding the quantitative dynamics or the evolutionary patterns of the mutant virus during the natural disease course remain unanswered. For example, it is not clear when the mutant virus begins to appear during the long course of chronic infection, how quickly it becomes dominant, and what factors contribute to its dominance. Clarification of these questions requires a highly sensitive mutation quantification assay.
In this study, we report the development of a locked nucleic acid (LNA)-containing selective PCR blocker with a much improved inhibitory effect on the amplification of the wild-type (WT) viral DNA but minimal effect on the mutant DNA. We also describe the primer-blocker-probe partial-overlap (PBPPO) design to minimize the influence of viral genome polymorphism on assay performance. A two-step quantitative PCR was developed, taking advantage of the selective PCR blocker and the rationally designed SimpleProbe, for ultrasensitive quantification of the HBV A1762T/G1764A mutants.
MATERIALS AND METHODS
Plasmid standards and other reagents.
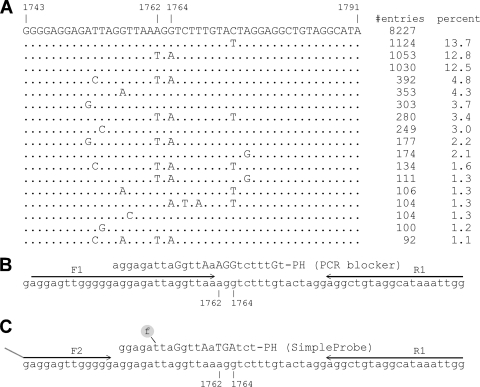
A DNA fragment comprised of HBV nucleotides (nt) 1399 to 1977 (inclusive of the target BCP region) was amplified by PCR from a patient serum sample. The PCR primers were 5′-ATGGATCCTGCGCGGGACGTCCTTTGT-3′ (nt 1399 to 1424) and 5′-GAAGGAAAGAAGTCAGAAGGC-3′ (nt 1977 to 1957). PFU enzyme (Agilent Technologies) was used for amplification, and the blunt-end PCR product was cloned directly into the pPCR-Script Amp SK(+) vector using the PCR-Script Amp cloning kit (Agilent Technologies). The plasmid was further modified, using a combinational PCR approach (8), to remove the mutations that are not represented in the consensus sequence obtained from the BLAST analysis (Fig. 1 A) and to generate various desired mutations. All the clones were confirmed by DNA sequencing (GeneWiz). These plasmids were quantified using NanoDrop 2000 (Thermal Fisher Scientific). They were used in assay development and as assay standards for quantification and melting curve analysis. Oligonucleotides were synthesized by Integrated DNA technologies, and the SimpleProbes were made by Tib Molbiol.
Fig. 1.
Target mutation site and assay design. (A) A noncontiguous Megablast search was performed using a query sequence of HBV nucleotides 1734 to 1793. A total of 8,227 sequences were compiled here for nucleotides 1743 to 1791, excluding the ones with incomplete and uncertain sequence readings. The sequence patterns are sorted according to their numbers in GenBank, and their percent representation in the total number of sequences is also listed. (B and C) First (B) and second (C) rounds of the two-step PCR design, together with the wild-type selective PCR blocker, the SimpleProbe, and the primers.
Patient samples and DNA purification.
A total of 62 patient serum samples were randomly retrieved from W. Thomas London's collection at the Fox Chase Cancer Center (5, 6, 14). HBV viral DNA was isolated from 200-μl patient serum samples using the QIAamp DNA blood minikit (Qiagen) and eluted into 50 μl buffer EB according to manufacturer's instructions.
Direct PCR sequencing.
The HBV BCP region was amplified from the patient samples and sequenced. As direct sequencing has limited reading length, new primers were designed. The forward and reverse primers used for amplification were 5′-GCCACTTACATAAGAGGACTCTTGGACT-3′ (nt 1649 to 1672) and 5′-GAGAGTAACTCCACAGWAGCTCCAAATTCTTT-3′ (nt 1950 to 1919), respectively. The AmpliTaq Gold Fast PCR master mix (Applied Biosystems) was used for amplification. The thermal program was 95°C for 15 s, 55°C for 30 s, and 72°C for 30 s, for a total of 40 cycles. The PCR products were separated by electrophoresis, purified using a Qiagen gel extraction kit, and sequenced (GeneWiz).
General quantitative PCRs.
All real-time PCRs were carried out in a LightCycler 480 (Roche Applied Sciences) using the SYBR green master mix (Roche Applied Sciences) or the genotyping master mix (Roche Applied Sciences); the latter was for the SimpleProbe PCRs. Serially diluted plasmids of known concentrations were used to generate a standard concentration curve for quantification. Quantification calculations were performed using the LightCycler480 SW1.5 software.
BCP A1762T/G1764A double mutation quantification assay.
A two-step assay was developed for the quantification of the BCP A1762T/G1764A double mutation. The first-step PCR was performed in a 15-μl reaction mixture containing 0.5 μM (each) F1 (5′-AGGAGTTGGGGGAGGAGATTAGGTTAA-3′) and R1 (5′-CCAATTTATGCCTACAGCCT-3′) primers, 5 μl of the purified patient sample DNA as the template, and 2 μM selective PCR blocker (5′-aggagattaGgttAaAGGtctttGt-PH) (Fig. 1B). PCR was carried out at 95°C for 10 s, 57°C for 10 s, and 65°C for 5 s, for a total of 20 cycles. The first-step PCR products were diluted 1:32 and used as templates in the second step real-time PCR which was composed of LightCycler480 genotyping master mix, 0.1 μM primer F2 (5′-GATAAGTTGAGGAGTTGGGGG-3′), 0.5 μM primer R1, and 0.1 μM SimpleProbe (5′-ggagattaGgttAaTGAtct-PH). Capital letters in the selective PCR blocker and SimpleProbe sequences indicate LNAs, and the 3′-end “-PH” stands for phosphorylation. The fluorescence label is indicated by an underline (also see Fig. 1C). As a standard format, SimpleProbe PCR uses primers in asymmetric concentrations to generate more of the probe-binding DNA strand. The real-time PCR was performed in a LightCycler480 instrument at 95°C for 10 min to activate the polymerase, followed by 40 cycles of 95°C for 10 s, 55°C for 10 s (with fluorescence acquisition), and 72°C for 5 s. Amplification was followed by a melting curve analysis over a linear temperature increase (0.06°C per second) from 30°C to 80°C. Plasmids carrying A1762T, G1764A, and A1762T/G1764A mutations or the wild-type BCP sequence were included as melting peak standards. Serially diluted plasmids carrying the A1762T/G1764A mutation were included in the first-step PCR so that a standard concentration curve can be generated in the second step PCR. Quantification calculations were performed using the LightCycler480 SW1.5 software.
The amplicon using primers F1 and R1 was too small for direct sequencing. When verification of the melting analysis by DNA sequencing was required, primer R2 (5′-CCAAATTCTTTATAAGGGTCAATGTCCATG-3′; HBV nucleotides 1929 to 1900) was used in place of R1 to increase the amplicon size so that direct sequencing could be performed.
Nucleotide sequence accession numbers.
The GenBank accession numbers for the viral DNAs sequenced in this study are HQ907993 to HQ908054.
RESULTS
Design and evaluation of a selective PCR blocker for HBV A1762/G1764 WT DNA.
A BLAST sequence search/alignment was performed to obtain a consensus wild-type (WT) sequence in the target area as well as the most common nucleotide polymorphism patterns (Fig. 1A). The percentage of each sequence pattern gave a rough estimate of its relative prevalence. It is apparent that nucleotide polymorphism is common around the BCP double-mutation site. Taking this into consideration, the assay was designed in such a way that the forward primer is partially overlapped with both the selective PCR blocker and the SimpleProbe (Fig. 1B and C). We named this the primer-blocker-probe partial-overlap (PBPPO) design.
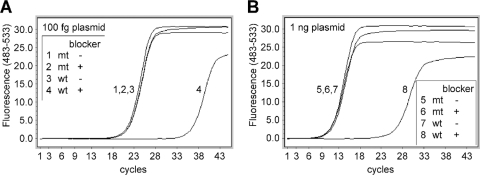
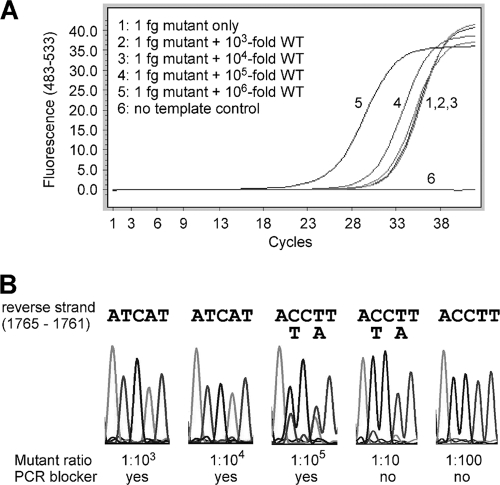
A WT-selective PCR blocker was designed to match the WT sequence and had LNAs incorporated at certain sites to increase the affinity of binding (24) to the WT DNA. Evaluation of this selective PCR blocker was performed with a SYBR green PCR. As shown in Fig. 2 A, addition of the PCR blocker caused significant inhibition of amplification of the WT viral DNA, indicated by the delay of the crossing point (the cycle number at which the amplification curve crosses with the threshold; also named threshold cycle CT), by an average of 13.5 cycles. Assuming that each cycle represents a 2-fold amplification, a 13.5-cycle delay indicates more than a 10,000-fold inhibition. In contrast, the blocker had minimal effect on the amplification of the A1762T/G1764A double mutation. The inhibitory effect was consistent over the tested range of WT DNA concentrations of up to 3 ×10⁸ copies (Fig. 2B). The effect of the PCR blocker was further tested using mixtures of WT and mutant plasmid DNAs at different ratios. Addition of the WT PCR blocker successfully suppressed the amplification of the WT DNA at mutant/WT ratios of up to 1:10,000, as the amplification signals were similar in the presence or absence of the WT DNA (Fig. 3 A, lines 1, 2, and 3). At 1:100,000, however, the WT amplification escaped the blocker, causing the amplification signal to increase (Fig. 3A, line 4). This was confirmed by direct sequencing of the PCR products (Fig. 3B). In the presence of the WT blocker, the mutant DNA could be clearly identified by DNA sequencing at a mutant/WT ratio of 1:10,000. Even at a ratio of 1:100,000, the mutant signals could still be detected, though as a minor fraction of the total DNA. In contrast, the mutant was barely detectable at a mutant/WT ratio of 1:10 in the absence of the WT PCR blocker (Fig. 3B).
Fig. 2.
Evaluation of a WT-selective PCR blocker by SYBR green real-time PCR. Approximately 100 femtograms (∼3 × 10⁴ copies) (A) or 1 nanogram (∼3 × 10⁸ copies) (B) of plasmids carrying either the WT sequence (lines 3, 4, 7, and 8) or the A1762T/G1764A mutation (lines 1, 2, 5, and 6) was amplified in the presence (lines 2, 4, 6, and 8) or absence (lines 1, 3, 5, and 7) of the PCR blocker for 45 cycles of 95°C for 10 s, 57°C for 10 s, and 65°C for 5 s using the forward primer F1 and the reverse primer R1.
Fig. 3.
Evaluation of a WT-selective PCR blocker by direct sequencing. (A) Plasmids carrying WT sequence or the A1762T/G1764A mutation were mixed at different ratios and served as PCR templates in a SYBR green real-time PCR. The amplification conditions were the same as for Fig. 2 except that the reverse primer was changed to R2 to generate a longer amplicon suitable for sequencing. (B) Sequencing data (for the reverse strand) for nucleotide positions 1765 to 1761. ACCTT represents 1761-AAGGT-1765 (WT), while ATCAT represents 1761-ATGAT-1765 (A1762T/G1764A double mutation).
Ultrasensitive quantification of the BCP A1762T/G1764A mutant.
A two-step real-time PCR was developed to quantify the BCP A1762T/G1764A mutant with high sensitivity. The first-step amplification was carried out in the presence of the PCR blocker to selectively suppress the amplification of the WT viral DNA while allowing the mutant, if present, to be amplified. The second-step PCR employed a SimpleProbe to quantify the mutant, via the amplification signals, as well as to distinguish which mutant or mutants have been amplified via the melting curve analysis. To avoid interference of the PCR blocker with the PCR probe, the PCR product from the first-round amplification was diluted before further amplification in the second-round PCR. The detailed method is described in Materials and Methods.
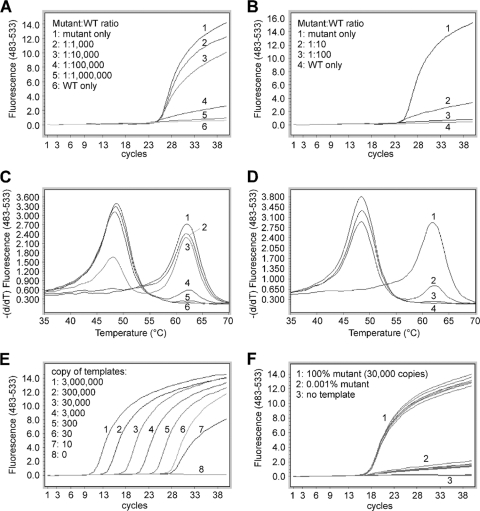
For quantification purpose, serially diluted A1762T/G1764A plasmids in known concentrations were amplified side by side with the samples in the first round of amplification. They were further amplified in the second-round PCR, in the presence of a SimpleProbe, to generate a quantification standard curve (Fig. 4 E). Quantification of the mutants was achieved by comparing the sample signals with those of the standards.
Fig. 4.
Quantification of A1762T/G1764A mutation by a two-step SimpleProbe PCR. (A to D) Templates containing 300 copies of A1762T/G1764A mutant, with and without WT plasmids at different ratios, were first amplified in the presence (A and C) or absence (B and D) of the WT-selective PCR blocker for 20 cycles and then amplified in a SimpleProbe PCR. The amplification curves are shown in panels A and B, and the corresponding melting curves are in panels C and D. (E) Amplification of known concentrations of A1762T/G1764A plasmids as concentration standards. (F) Seven identical siPCRs for 30,000 copies of A1762T/G1764A plasmid alone (line group 1) or 0.001% mutant plasmid (line group 2) were done with SimpleProbe PCR to assess the reproducibility.
The mutant detection sensitivity of the real-time PCR was verified using mixed plasmids carrying WT and mutant HBV sequences. As shown in Fig. 4A and C, the mutant was detectable in the presence of a 100,000-fold excess of the WT DNA. The presence of the WT DNA depressed the signals generated by the mutant but did not significantly alter the crossing point (Fig. 4A and B); thus, quantification of the mutant was still achievable. In the absence of the PCR blocker, however, the mutant was not detectable at a mutant/WT ratio of 1:100 (Fig. 4B and D).
To test the reproducibility of the two-step amplification, septuplicate siPCRs were further amplified in SimpleProbe PCRs (Fig. 4F). The CT values were 16.85 ± 0.099 (mean ± standard deviation) for 100% mutant (Fig. 4F, line group 1) and 17.54 ± 0.298 for 0.001% mutant (line group 2). These results indicate that the two-step amplification is highly reproducible.
We tested 20 patient samples which had “100% WT” (A1762/G1764) in the sequencing reactions (by manual reading). Our assay revealed the presence of A1762T/G1764A mutants in 10 samples (Table 1). The percentage of mutants was in the range from 0.004 to 6.006% (Table 1). In all cases, the presence of mutants was verified by direct sequencing of the amplicon (data not shown) as described in Fig. 3.
Table 1.
Ultrasensitive quantification of the HBV A1762T/G1764A mutation from 20 HBeAg-positive patients
| Sample no. | Mutant titer (copies/ml) | Total viral loada (copies/ml) | % Mutant | Serum ALTb (U/liter) |
|---|---|---|---|---|
| 1 | 4.41E + 08 | 0 | 8 | |
| 2 | 2.39E + 09 | 0 | 23 | |
| 3 | 8.20E + 04 | 3.21E + 08 | 0.026 | 10 |
| 4 | 3.75E + 04 | 8.65E + 08 | 0.004 | 8 |
| 5 | 6.43E + 06 | 1.03E + 09 | 0.624 | 11 |
| 6 | 1.91E + 09 | 0 | 7 | |
| 7 | 1.58E + 09 | 0 | 44 | |
| 9 | 4.37E + 09 | 0 | 10 | |
| 10 | 7.15E + 08 | 0 | 10 | |
| 11 | 1.93E + 08 | 0 | 34 | |
| 12 | 2.28E + 04 | 8.05E + 07 | 0.028 | 10 |
| 13 | 1.79E + 09 | 0 | 8 | |
| 15 | 5.58E + 06 | 5.80E + 08 | 0.963 | 8 |
| 16 | 4.75E + 07 | 1.09E + 09 | 4.358 | 46 |
| 18 | 1.22E + 09 | 0 | 13 | |
| 19 | 4.39E + 03 | 5.25E + 06 | 0.084 | 18 |
| 29 | 1.62E + 07 | 2.69E + 08 | 6.006 | 8 |
| 30 | 2.29E + 06 | 0 | 69 | |
| 32 | 1.65E + 04 | 1.92E + 06 | 0.863 | 155 |
| 33 | 9.60E + 02 | 2.26E + 04 | 4.248 | 21 |
Total viral load was measured in a two-step PCR similar to the mutation quantification assay except that the WT-selective PCR blocker was omitted and the annealing/fluorescence acquisition temperature was at 48°C.
ALT, alanine aminotransferase. A serum ALT level of >40 U/liter generally indicates existing liver injury.
PBPPO design.
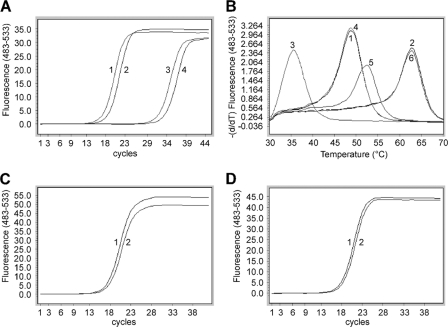
The nucleotide polymorphisms around the target mutation site (Fig. 1A) could negatively affect any probe-based assay, causing false positives or false negatives. Nucleotide polymorphism could also diminish the inhibitory effect of the PCR blocker on the amplification of the WT DNA (A1762/G1764 is designated WT in this study regardless of potential mutations nearby), causing blocker “leakage” which could in turn reduce the mutation detection sensitivity. To minimize the impact of nucleotide polymorphism, the forward primer (F1) was designed to partially overlap with both the PCR blocker and the probe (Fig. 1B and C) (primer-blocker-probe partial-overlap [PBPPO] design). Mutations 5′to nucleotide 1762, such as T1753C, G1757A, and T1753C/G1757A (Fig. 1A), would be converted to the primer sequence during amplification, thereby eliminating the mismatch(es) between the WT template and the PCR blocker. As shown in Fig. 5 A, using the forward primer F1, which covers nucleotides 1753 and 1757, the PCR blocker had the same inhibitory effect on the T1753C/G1757A/WT template (lines 2 and 4) as the WT template without polymorphism (lines 1 and 3). The primer-probe overlap also effectively eliminated the mismatch between the template and the PCR probe and avoided a melting curve shift caused by mutations upstream of nucleotide 1762 (Fig. 5B). As these upstream mutations create mismatches between the template and the forward primer F1, we were concerned about whether this would reduce the amplification efficiency and cause underestimation of the mutant quantity. Plasmids with one (T1753C or G1757A) or two (T1753C/G1757A) mutations in the background of A1762T/G1764A were amplified using two different forward primers, F1 and F2. Primer F1 has 0 to 2 mismatches with these templates, while primer F2 does not have any mismatch with the templates. Amplification efficiencies were found to be similar whether or not the template had one (data not shown) or two (Fig. 5C) mismatches with primer F1. Therefore, the majority of the A1762T/G1764A mutants could be quantified accurately using the PBPPO design strategy.
Fig. 5.
Effect of primer-blocker-probe partial overlap (PBPPO) on the performance of the PCR. (A) PBPPO prevents blocker leakage. Line 1, WT, no blocker; line 2, WT/1753C/1757A, no blocker; line 3, WT, with blocker; line 4, WT/1753C/1757A, with blocker. (B) PBPPO simplifies melting curve patterns. Line 1, WT template amplified with F1 and R1; line 2, A1762T/G1764A template amplified with F1 and R1; line 3, WT/1753C/1757A template amplified with F2 and R1; line 4, WT/1753C/1757A template amplified with F1 and R1; line 5, A1762T/G1764A/1753C/1757A template amplified with F2 and R1; line 6, A1762T/G1764A/1753C/1757A template amplified with F1 and R1. (C and D) The amplification efficiencies of A1762T/G1764A (line 1) and A1762T/G1764A/1753C/1757A (line 2) plasmids were examined in a SYBR green PCR using primers F1/R1 (C) or F2/R1 (D).
Evaluation of probe performance.
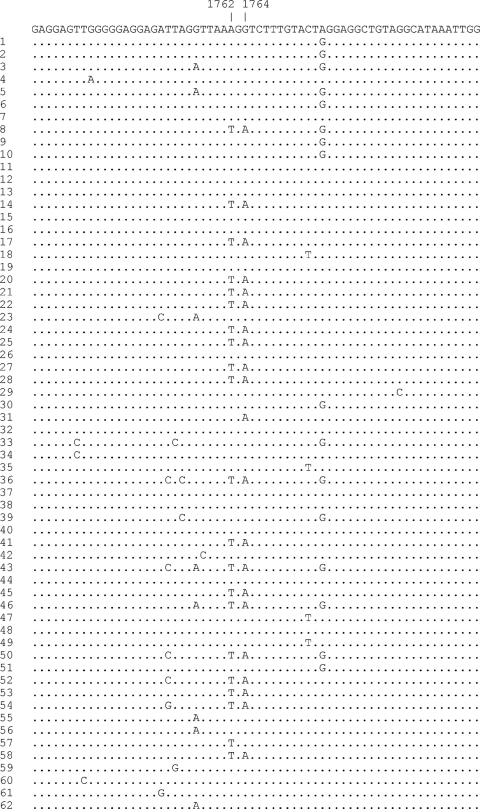
The PBPPO design reduced the effective probe length to only six nucleotides, corresponding to nucleotides 1762 to 1767 (Fig. 1B). To evaluate the performance of the probe, we isolated viral DNAs from 62 chronic hepatitis B patients. DNA sequencing (Fig. 6) showed that 20 samples had the A1762T/G1764A double mutation by automated reading. Nucleotide positions 1762 and 1764 had four patterns: the WT, the A1762T/G1764A double mutation, and two different single mutations (A1762T or G1764A). Nucleotide polymorphism was apparent upstream of the mutation site but not immediately downstream of the mutation site (Fig. 6). Out of 20 samples positive for the A1762T/G1764A double mutation, 6 (30%) had a nucleotide polymorphism immediately upstream of the mutation site. However, owing to the PBPPO design, the melting curve analysis showed only three types of peaks in these samples: the WT, the A1762T/G1764A double mutation, and the two single mutations, which were indistinguishable (data not shown; patterns are shown in Fig. 7). Not surprisingly, these patterns matched completely with the DNA sequencing data. Four of the 42 “WT” samples had the A1762T/G1764A double mutation as a minor fraction by manual reading; these samples gave two peaks in the melting analysis, representing a mixture of WT and the mutant (data not shown; similar to Fig. 4E, lines 3 and 4).
Fig. 6.
Analysis of the HBV BCP region by DNA sequencing. Viral DNAs from 62 patients were amplified and sequenced directly without cloning. Shown at the top is the consensus sequence. Identical sequences are shown in dots. GenBank accession numbers are HQ907993 to HQ908054.
Fig. 7.
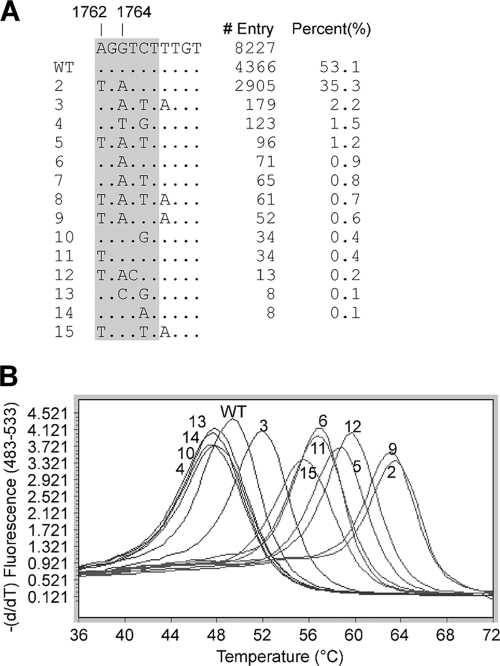
Effect of nucleotide polymorphism at positions 1765 to 1771 on probe performance. (A) A noncontiguous Megablast search was performed using a query sequence of HBV nucleotides 1734 to 1793. A total of 8,227 sequences were compiled here for nucleotides 1762 to 1771, excluding the ones with incomplete and uncertain sequence readings. The sequence patterns are sorted according to their appearance frequencies in the GenBank, and their percent representation in the total number of sequences is listed. The area covered by the probe is highlighted. (B) Melting analysis of the different sequence patterns listed in panel A. Patterns 7 and 8 (data not shown) showed the same melting curves as patterns 3 and 5, respectively.
The complex polymorphisms downstream of nucleotide 1764, although not present in our patient samples, have been previously reported and can be retrieved by BLAST analysis (Fig. 7A). To predict how the probe would respond to these known nucleotide variations, plasmids representing these mutation patterns were constructed and amplified in a SimpleProbe PCR. Postamplification melting analysis showed that A1762T/G1764A, even with extra mutations (Fig. 7A, patterns 2, 5, 8, 9, and 12), could be identified because their melting temperatures were higher than that for the A1762T or G1764A single mutation (Fig. 7B). Collectively, more than 97% of HBV BCP sequences in GenBank (Fig. 7A) can be correctly identified by melting curve analysis.
DISCUSSION
Detection and quantification of HBV mutations in general have been problematic, mainly because the viral genome has a high rate of nucleotide polymorphisms. HBV replication lacks proofreading (21, 23), and thus mutant viruses are produced as a result of replication errors. Consequently, in any given individual the virus exists as a mixed population, though the mutant (often defective) viruses tend to be a minor fraction. However, some of the viable mutant viruses may become dominant over time, causing viral genome variations or polymorphisms among different individuals.
Detection of HBV mutations has been largely dependent on direct DNA sequencing, which has been considered to be the “gold standard.” However, DNA sequencing is a qualitative assay which cannot measure mutant titers. Quantification of HBV BCP mutants by using a TaqMan real-time PCR was reported previously (19, 27). However, the effect of viral genome polymorphism on the performance of the probe, and thus the quantification, was not taken into consideration. The probe was 19 nucleotides long (corresponding to viral nucleotide positions 1755 to 1773) and was likely affected by the fairly common polymorphism at position 1757 (Fig. 6), not to mention other potential variations. With the recent finding that quantification of HBV BCP A1762T/G1764A mutant titer helps to predict the risk of HCC (27), it is of importance to improve the accuracy of the BCP mutant detection/quantification assay.
The TaqMan PCR uses a probe which is hydrolyzed during amplification, and thus postamplification melting curve analysis is not possible. Consequently, any false-positive or false-negative results caused by the nucleotide polymorphisms may be unnoticed if the results are not compared with a gold standard. In contrast, the SimpleProbe PCR includes a melting analysis after the amplification. Unexpected sequence variations will often create “atypical” melting curves. Thus, the SimpleProbe PCR has a built-in “self-check” function. Detection of HBV mutations by melting curve analysis using hybridization probes (also named Hyb probes or fluorescence resonance energy transfer [FRET] probes) was reported (22, 28). However, the hybridization probes consist of an anchor probe and a sensor probe, and the total probe length is more than 50 nucleotides (the sensors were 27 to 29 nucleotides in length). Thus, the probe performance in both amplification and melting curve analysis is more likely to be affected by viral genome polymorphisms. In this study, we used a PBPPO approach to reduce the effective length of the probe to only six nucleotides. This significantly reduced melting curve variations in response to unexpected mutations. Consequently, no atypical melting curves were observed when 62 patient samples were tested, and the patterns were confirmed by the sequencing results. This was because the nucleotide polymorphisms upstream of position 1762 were eliminated during amplification. We did not encounter polymorphisms downstream of the mutation site in our limited number of patient samples. However, even if polymorphisms are present, our probe could distinguish the samples with A1762T/G1764A mutation from the ones without (Fig. 7B). Thus, our PBPPO approach significantly improved assay accuracy, making the assay more suitable for clinical diagnostic purposes or for epidemiological studies.
We also improved the assay sensitivity significantly using a WT-selective PCR blocker. High sensitivity is necessary for investigating the evolution of mutant viruses, especially at the early developmental stages when the mutant is a very small fraction of the total viruses. Most studies on HBV BCP mutation employed DNA sequencing for qualitative (or at most semiquantitative) mutation detection, and highly sensitive quantification of the BCP mutant has not been reported. A positive mutation detection by DNA sequencing requires a mutant/WT ratio of >1:1 (i.e., the mutant is >50%) by automated reading or of >1:10 (>10 to 20% mutant) if the result is read manually. With our WT-selective PCR blocker, the mutant can be identified by direct sequencing following the siPCR at a mutant/WT ratio of as high as 1:100,000 (0.001% mutant). This is a 10,000-fold increase in mutation detection sensitivity compared with regular sequencing. When the siPCR is combined with the SimpleProbe PCR, the mutant can be quantified with the same high level of sensitivity. To the best of our knowledge, this is the first study to achieve such a high mutation detection sensitivity using an LNA-based oligonucleotide as a WT-selective PCR blocker. The primer-blocker partial-overlap design is different from the PCR “clamp” first described in reference 18, and it has the advantage of reducing the chance of blocker “leakage.”
It should be pointed out that next-generation sequencing or deep sequencing is a powerful tool for determining relative quantities of mutants. It will eventually replace regular sequencing as the gold standard for mutation detection due to its higher sensitivity. Compared with our new assay, however, it cannot measure the mutant titers and its sensitivity is ∼100-fold lower; thus, it cannot be used to validate our assay independently.
In summary, we have developed a highly sensitive SimpleProbe-based real-time PCR assay for the quantification of the HBV BCP A1762T/G1764A mutation. The unique assay design reduced the effective length of the probe, making the assay more resistant to false or uncertain results caused by viral genome polymorphism. This assay platform may be useful in mutation detection or nucleic acid quantification for other viruses, such as HCV and HIV, which also have high levels of nucleotide polymorphisms. The approach for highly sensitive mutation detection may also be applied to the detection of other clinically significant mutations.
ACKNOWLEDGMENTS
This work was supported by grants from the Commonwealth of Pennsylvania and the National Cancer Institute Early Detection Research Network to T.M.B. and by grants from the Hepatitis B Foundation and the Ben Franklin Technology Partners to X.D.R.
Footnotes
Published ahead of print on 11 May 2011.
REFERENCES
- 1. Block T. M., Mehta A. S., Fimmel C. J., Jordan R. 2003. Molecular viral oncology of hepatocellular carcinoma. Oncogene 22:5093–5107 [DOI] [PubMed] [Google Scholar]
- 2. Chan H. L., Hussain M., Lok A. S. 1999. Different hepatitis B virus genotypes are associated with different mutations in the core promoter and precore regions during hepatitis B e antigen seroconversion. Hepatology 29:976–984 [DOI] [PubMed] [Google Scholar]
- 3. Chen C. H., et al. 2008. Combined mutations in pre-S/surface and core promoter/precore regions of hepatitis B virus increase the risk of hepatocellular carcinoma: a case-control study. J. Infect. Dis. 198:1634–1642 [DOI] [PubMed] [Google Scholar]
- 4. Chotiyaputta W., Lok A. S. 2009. Hepatitis B virus variants. Nat. Rev. Gastroenterol. Hepatol. 6:453–462 [DOI] [PubMed] [Google Scholar]
- 5. Evans A. A., Fine M., London W. T. 1997. Spontaneous seroconversion in hepatitis B e antigen-positive chronic hepatitis B: implications for interferon therapy. J. Infect. Dis. 176:845–850 [DOI] [PubMed] [Google Scholar]
- 6. Evans A. A., et al. 1998. Geographic variation in viral load among hepatitis B carriers with differing risks of hepatocellular carcinoma. Cancer Epidemiol. Biomarkers Prev. 7:559–565 [PubMed] [Google Scholar]
- 7. Fang Z. L., et al. 2008. HBV A1762T, G1764A mutations are a valuable biomarker for identifying a subset of male HBsAg carriers at extremely high risk of hepatocellular carcinoma: a prospective study. Am. J. Gastroenterol. 103:2254–2262 [DOI] [PMC free article] [PubMed] [Google Scholar]
- 8. Higuchi R. 1989. Using PCR to engineer DNA, p. 61–70 In Erlich H. A. (ed.), PCR Technology. Stockton Press, New York, NY [Google Scholar]
- 9. Kao J. H., Chen P. J., Lai M. Y., Chen D. S. 2003. Basal core promoter mutations of hepatitis B virus increase the risk of hepatocellular carcinoma in hepatitis B carriers. Gastroenterology 124:327–334 [DOI] [PubMed] [Google Scholar]
- 10. Liaw Y. F., Chu C. M. 2009. Hepatitis B virus infection. Lancet 373:582–592 [DOI] [PubMed] [Google Scholar]
- 11. Liu C. J., et al. 2006. Role of hepatitis B viral load and basal core promoter mutation in hepatocellular carcinoma in hepatitis B carriers. J. Infect. Dis. 193:1258–1265 [DOI] [PubMed] [Google Scholar]
- 12. Liu S., et al. 2009. Associations between hepatitis B virus mutations and the risk of hepatocellular carcinoma: a meta-analysis. J. Natl. Cancer Inst. 101:1066–1082 [DOI] [PMC free article] [PubMed] [Google Scholar]
- 13. Lok A. S., McMahon B. J. 2007. Chronic hepatitis B. Hepatology 45:507–539 [DOI] [PubMed] [Google Scholar]
- 14. London W. T., Atleson J., Eto T., Fine M., Hwang C. 1991. Early detection of hepatocellular carcinoma among Asians living in the United States. Portfolio Publishing Company, Houston, TX [Google Scholar]
- 15. London W. T., et al. 1995. Viral, host and environmental risk factors for hepatocellular carcinoma: a prospective study in Haimen City, China. Intervirology 38:155–161 [DOI] [PubMed] [Google Scholar]
- 16. McClune A. C., Tong M. J. 2010. Chronic hepatitis B and hepatocellular carcinoma. Clin. Liver Dis. 14:461–476 [DOI] [PubMed] [Google Scholar]
- 17. McMahon B. J. 2009. The natural history of chronic hepatitis B virus infection. Hepatology 49:S45–55 [DOI] [PubMed] [Google Scholar]
- 18. Orum H., et al. 1993. Single base pair mutation analysis by PNA directed PCR clamping. Nucleic Acids Res. 21:5332–5336 [DOI] [PMC free article] [PubMed] [Google Scholar]
- 19. Pang A., Yuen M. F., Yuan H. J., Lai C. L., Kwong Y. L. 2004. Real-time quantification of hepatitis B virus core-promoter and pre-core mutants during hepatitis E antigen seroconversion. J. Hepatol. 40:1008–1017 [DOI] [PubMed] [Google Scholar]
- 20. Park N. H., Song I. H., Chung Y. H. 2007. Molecular pathogenesis of hepatitis-B-virus-associated hepatocellular carcinoma. Gut Liver 1:101–117 [DOI] [PMC free article] [PubMed] [Google Scholar]
- 21. Pult I., Abbott N., Zhang Y. Y., Summers J. 2001. Frequency of spontaneous mutations in an avian hepadnavirus infection. J. Virol. 75:9623–9632 [DOI] [PMC free article] [PubMed] [Google Scholar]
- 22. Ren X. D., et al. 2009. Rapid and sensitive detection of hepatitis B virus 1762T/1764A double mutation from hepatocellular carcinomas using LNA-mediated PCR clamping and hybridization probes. J. Virol. Methods 158:24–29 [DOI] [PMC free article] [PubMed] [Google Scholar]
- 23. Ren X. D., Nie H., Guo J. T. 2010. HBV drug resistance development, testing, and prevention. Curr. Hepatitis Rep. 9:223–230 [Google Scholar]
- 24. Singh S. K., Koshkin A. A., Wengel J., Nielsen P. 1998. LNA (locked nucleic acids): synthesis and high-affinity nucleic acid recognition. Chem. Commun. (Camb.) 1998:455–456 [Google Scholar]
- 25. Tsai W. L., Chung R. T. 2010. Viral hepatocarcinogenesis. Oncogene 29:2309–2324 [DOI] [PMC free article] [PubMed] [Google Scholar]
- 26. Yang H. I., et al. 2008. Associations between hepatitis B virus genotype and mutants and the risk of hepatocellular carcinoma. J. Natl. Cancer Inst. 100:1134–1143 [DOI] [PMC free article] [PubMed] [Google Scholar]
- 27. Yuan J. M., et al. 2009. Prospective evaluation of hepatitis B 1762(T)/1764(A) mutations on hepatocellular carcinoma development in Shanghai, China. Cancer Epidemiol. Biomarkers Prev. 18:590–594 [DOI] [PMC free article] [PubMed] [Google Scholar]
- 28. Zhang M., Gong Y., Osiowy C., Minuk G. Y. 2002. Rapid detection of hepatitis B virus mutations using real-time PCR and melting curve analysis. Hepatology 36:723–728 [DOI] [PubMed] [Google Scholar]


