Abstract
Analytical performance characteristics of the QIAsymphony RGQ system with artus cytomegalovirus (CMV) reagents were determined. Measurable range spanned 2.0 to ≥7.0 log10 copies/ml. The detection limit was 23 copies/ml. Intrarun and interrun coefficients of variation were ≤2.1% at 3.0 and 5.0 log10 copies/ml. In clinical specimens, RGQ values were ∼0.2 log10 copies/ml higher than those in an assay using a BioRobot M48 extraction/manual reaction setup/7500 Real-Time PCR instrument. No cross-contamination was observed.
TEXT
Cytomegalovirus (CMV) DNA quantification in peripheral blood has become the standard of care for disease diagnosis in symptomatic individuals; detection of CMV replication in asymptomatic patients, allowing for preemptive treatment; monitoring of antiviral treatment response; and detection of antiviral drug resistance (4, 5). Instrumentation systems that incorporate automated nucleic acid extraction with volumetric pipetting stations for reaction setup are highly desirable solutions to meet mounting testing needs. The aim of this study was to investigate the performance of the QIAsymphony RGQ system for CMV DNA quantification in plasma using artus CMV reagents (Qiagen). The QIAsymphony RGQ system is comprised of an automated extraction instrument (QIAsymphony SP), an automated volumetric pipetting system for reaction setup (AS module), and a real-time PCR instrument (Rotor-Gene Q). CMV reagents are available as analyte-specific reagents (ASR). They are currently designated research use only (RUO) when adapted for use on RGQ. Analytical performance characteristics of the RUO assay were determined.
Extraction was performed on the QIAsymphony SP (QIAsymphony Virus/Bacteria Midi Test Kit reagents and Cell-free 1000 instrument protocol). Plasma input/elution volumes were 1.2 ml (1,000 μl processed)/95 μl, respectively. Internal control and carrier RNA volumes were calculated by instrument software. These were added manually to buffer AVE and then placed in the designated QIAsymphony SP slot. After extraction, eluates in 96-microwell plates were transferred by the instrument to the AS module. Instrument software calculated worktable requirements for assay setup. The AS module assembled the master mix and then aliquoted reaction components (30 μl master mix plus 20 μl assay standards, assay controls, or extracted samples) into individual strip tubes. Strip tubes were then manually removed, capped, placed in the 72-position rotor disc, and positioned onto the Rotor-Gene Q. Amplification parameters were as follows: 95°C for 10 min and then 45 cycles of 95°C for 15 s, 65°C for 30 s, and 72°C for 20 s.
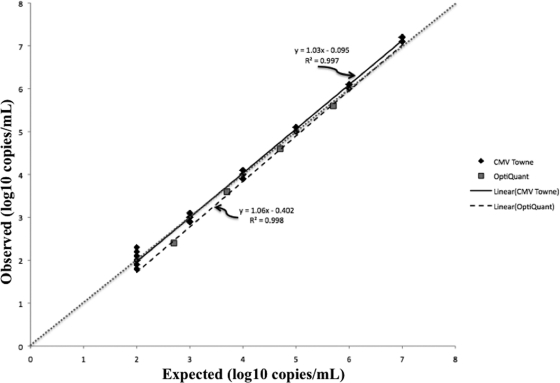
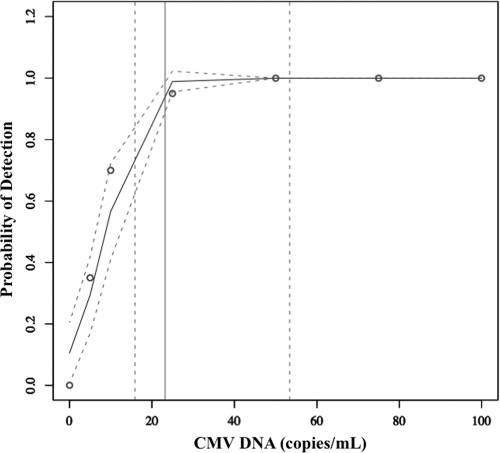
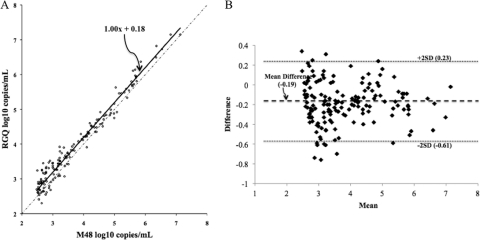
CMV Towne strain (VR-977; American Type Culture Collection, Manassas, VA) was used for analytical studies. Genome equivalents were determined with a laboratory-developed US17-based real-time PCR test (151-bp amplicon [6], using purified spectrophotometrically quantified US17 subclone plasmid as calibrator). The stock concentration was defined as the mean geometric (log10) genome copies/ml of 10 replicates and was confirmed with a different real-time PCR assay (artus CMV PCR ASR; Qiagen, Germantown, MD). Measurable range was determined with serial 10-fold virus dilutions (7.0 to 2.0 log10 copies/ml, n = 10 per concentration) and the OptiQuant CMV quantification panel (5.7, 4.7, 3.7, and 2.7 log10 copies/ml, n = 1 per concentration; AcroMetrix, Benicia, CA). The criteria of linearity and precision (standard deviation, ≤0.4) were used to define the upper and lower limits of quantification. Using CMV Towne, quantification was linear from 2.0 log10 copies/ml to 7.0 log10 copies/ml (Fig. 1). The greatest imprecision in the measurable range was observed at 2.0 log10 copies/ml (standard deviation, 0.34 log10 copies/ml). The OptiQuant panel data affirmed this linearity (Fig. 1). To determine the limit of detection (LOD), dilutions of CMV Towne were tested (100 to 5 copies/ml, n = 20 per concentration). The LOD was defined as the concentration at which 95% of replicates were detected (1). The dose-response 95th percentile (with 95% confidence interval [CI]) was estimated using probit analysis (2, 3). The goodness-of-fit of the model was assessed using the Pearson chi-square test (2, 3). The calculated LOD by probit was 23 copies/ml (95% confidence interval, 16 to 53 copies/ml; Fig. 2). Precision was assessed at 3.0 and 5.0 log10 copies/ml. For intra-assay precision, 20 replicates of each concentration were assayed. For interassay precision, 10 additional replicates were tested on two additional runs performed on two separate days, and the data were combined with the initial run of 20 replicates. Variability was greater at 3.0 log10 copies/ml (intrarun and interrun percent coefficient of variation [%CV], 1.9 and 2.1) than at 5.0 log10 copies/ml (intrarun and interrun %CV, 0.7 and 1.4). To assess correlation between quantitative results obtained with the QIAsymphony RGQ and BioRobot M48 extraction/manual reaction setup/7500 Real-Time PCR instrument (which uses 400 μl input plasma/125-μl elution volume, 10 μl extracted nucleic acid, and 15 μl reagent master mix), 157 specimens that had been previously quantified with the latter method were quantified with the QIAsymphony RGQ. Specimens throughout the quantification range were tested. General linear models were created to assess the linear relationship between the log10-transformed QIAsymphony and BioRobot M48 results. Normality of correlation data distribution was assessed using the Shapiro-Wilk test. Log10-transformed data were found to be significantly nonnormal (P < 0.0001); therefore, correlations were assessed using Spearman correlation coefficients (ρ). All calculations were performed using SAS software, version 9.1 (SAS System; SAS Institute Inc., Cary, NC). The data obtained by the two tests were highly correlated (Spearman correlation coefficient [ρ] for log10-transformed data, 0.95614 [P < 0.0001]), indicating a strong linear relationship (slope of Deming regression, 1.00) but not identity (Fig. 3A). Values obtained with the RGQ system were usually higher than the comparator as demonstrated by the Deming regression y-intercept (0.18, 95% confidence interval [CI], 0.05 to 0.3; Fig. 3A) and by an analysis of the difference in quantification between the two methods, which demonstrated a mean difference in quantification of −0.19 (Fig. 3B). The quantification bias appeared to be constant throughout the measuring range rather than proportional, since Deming regression of correlation (Fig. 3A) demonstrated a slope of 1.00 (95% CI, 0.97 to 1.03) and linear regression of the difference data (Fig. 3B) demonstrated a slope close to zero (0.004), with a nonsignificant P value (0.77) (data not shown). To assess the potential for cross-contamination on the QIAsymphony RGQ, a checkerboard experiment in which spiked plasma samples (7.0 log10 CMV copies/ml, n = 34) were tested in an alternating pattern with known negative plasma samples (n = 33) was performed. The mean threshold cycle (CT) of positive specimens was 17.0. No intersample cross-contamination was observed, since no CMV DNA was detected in any of the negative specimens (data not shown).
Fig. 1.
Measurable range of CMV DNA quantification using two different CMV preparations. The dotted line indicates the theoretical trend line of complete agreement between expected and observed measurements.
Fig. 2.
Limit of detection. Probability of detection corresponds to percentage of replicates detected (n = 20 tested at each concentration). Open circles, LOD data (percentage of replicates detected). Arched solid line, probit regression line. Arched dashed lines, 95% confidence intervals of the regression line. Solid vertical line, predicted concentration of 95% detection limit. Dashed vertical lines, 95% confidence intervals for 95% detection limit.
Fig. 3.
(A) Comparison of quantification by QIAsymphony RGQ and M48/manual setup/ABI7500 platforms throughout the measuring range, using clinical plasma specimens (n = 157). Solid line, Deming regression; dotted/dashed line, identity. (B) Difference in quantification between QIAsymphony RGQ and M48/manual setup/ABI7500 platforms. Mean, average of QIAsymphony RGQ and M48/manual setup/ABI7500 platforms; difference, M48/manual setup/ABI7500 platforms minus QIAsymphony RGQ; SD, standard deviation (0.21).
Data with a version of this system employing manual rather than automated reaction setup have been reported previously (7). The measurable range was similar to that in our study (2.0 to 7.0 log10 copies/ml), but no LOD was reported. One important difference was the input volume required to attain a lower quantification limit (LQL) of 2.0 log10 copies/ml. In the previous report, this was attained with 200 μl of plasma. In our studies, 1.2 ml (1.0 ml processed) plasma was required to attain this LQL. Using 200 μl of plasma, the LQL was 3.0 log10 copies/ml (data not shown). The source of this discrepancy is unclear since elution volumes were similar in the two studies. The need for such a large volume to obtain a broad, clinically useful quantification range is a disadvantage of this assay. No other published data are available comparing CMV quantification on the QIAsymphony RGQ system with that on other platforms. Other automated extraction/reaction setup instruments are available globally (Abbott m2000 RealTime System; Abbott Molecular); no data on CMV quantification using this system have been published.
Approval was received from the Johns Hopkins Medicine Institutional Review Board to conduct these experiments.
Acknowledgments
Extraction materials and artus CMV reagents were kindly provided by Qiagen.
Footnotes
Published ahead of print on 11 May 2011.
REFERENCES
- 1. CLSI 2010. Quantitative molecular methods for infectious diseases. Approved guideline, 2nd ed. CLSI document MM06-A2 CLSI, Wayne, PA [Google Scholar]
- 2. Finney D. J. 1971. Probit analysis, 3rd ed. Cambridge University Press, New York, NY [Google Scholar]
- 3. Finney D. J. 1978. Statistical method in biological assay, 3rd ed. Charles Griffin & Co., London, United Kingdom [Google Scholar]
- 4. Kotton C. N., et al. 2010. International consensus guidelines on the management of cytomegalovirus in solid organ transplantation. Transplantation 89:779–795 [DOI] [PubMed] [Google Scholar]
- 5. Ljungman P., Hakki M., Boeckh M. 2010. Cytomegalovirus in hematopoietic stem cell transplant recipients. Infect. Dis. Clin. North Am. 24:319–337 [DOI] [PubMed] [Google Scholar]
- 6. Machida U., et al. 2000. Real-time automated PCR for early diagnosis and monitoring of cytomegalovirus infection after bone marrow transplantation. J. Clin. Microbiol. 38:2536–2542 [DOI] [PMC free article] [PubMed] [Google Scholar]
- 7. Raggam R. B., et al. 2010. Rapid quantitation of cytomegalovirus DNA in whole blood by a new molecular assay based on automated sample preparation and real-time PCR. Med. Microbiol. Immunol. 199:311–316 [DOI] [PubMed] [Google Scholar]


