Abstract
A tertiary care center-based prospective case–control study was undertaken to evaluate the association of contrast sensitivity with LogMAR visual acuity and glycosylated hemoglobin (HbA1c) in 205 cases of non-insulin dependent diabetes mellitus and 115 controls. LogMAR visual acuity and contrast sensitivity were scored using ETDRS and Pelli-Robson charts, respectively. Bivariate correlation between contrast sensitivity and LogMAR visual acuity showed significant inverse correlation in cases without retinopathy (r = −0.466) and with non-proliferative retinopathy (r = −0.307). In a multivariate model, on applying linear regression analysis, LogMAR visual acuity (p < 0.001) and HbA1c (p = 0.002) had significant association with contrast sensitivity. Significant difference in contrast sensitivity was not observed between cases without diabetic retinopathy and with non-proliferative diabetic retinopathy, implying no association with retinal microvascular changes. Contrast sensitivity dysfunction observed in diabetes mellitus results from changes in retinal function secondary to alteration in carbohydrate metabolism depicted in glycosylated hemoglobin.
Keywords: Contrast sensitivity, Non-insulin dependent diabetes mellitus, LogMAR visual acuity, Glycosylated hemoglobin
Introduction
The prevalence of diabetes mellitus, a multisystem disorder, has been on an increase. As per the WHO statistics, the number of adults with diabetes in the world is estimated to increase by 122% from 135 million in 1995 to 300 million in 2025 [1]. Diabetic retinopathy is emerging as one of the important causes of blindness.
Visual impairment due to diabetes mellitus is indicated by reductions in visual acuity (VA) and contrast sensitivity. VA is a measure of the spatial resolution of eye. The measurement of VA alone does not account for complete assessment of the visual status. The VA function of a patient with diabetes mellitus is markedly impaired even in the presence of a normal and near normal VA [2–5]. This is explained by an impaired contrast sensitivity which is the ability to differentiate an object from its background. Loss in contrast sensitivity is the consequence of functional disturbances at the level of the retina or of the post-retinal neuronal pathways. Contrast sensitivity seems to be related to the involvement of the ganglion cells causing changes in retinal function secondary to carbohydrate metabolism alteration rather than a microvascular complication. In addition, retinal parenchyma is very susceptible to the modification of carbohydrate metabolism [6].
A tertiary care center-based prospective case–control study was undertaken to study the association of contrast sensitivity with LogMAR VA and glycosylated hemoglobin (HbA1c) values.
Material and methods
Patients included were between 40 and 65 years of age and diagnosed as non-insulin dependent diabetes mellitus (fasting blood sugar > 100 mg/dl, post prandial >140 mg/dl; at the time of presentation) who presented in this tertiary care center from August 2008 to July 2009. All the patients had best corrected monocular visual acuity between 0 and 1.0 log units on ETDRS chart. None of the patients had lens opacities more than grade 1 nuclear sclerosis (Lens Opacity Classification System III) [7] or IOP > 21 mmHg on Goldmann applanation tonometry. Fasting and post prandial blood sugar levels as well as HbA1c were estimated to assess metabolic control.
After informed consent was obtained, all the subjects underwent detailed ophthalmological examination including slit lamp examination, indirect ophthalmoscopy, and slit lamp biomicroscopy with 90D lens. Patients were categorized on the basis of presence or absence of diabetic retinopathy. Levels of diabetic retinopathy were defined as per early treatment diabetic retinopathy study report # 12 (1991). Patients with evidence of clinically significant macular edema, macular ischemia, vitreous hemorrhage, subhyaloid hemorrhage, and retinal detachment were excluded from our study. Patients with history of any other ocular disease affecting visual acuity and contrast sensitivity such as glaucoma, other macular disease, optic nerve disease, uveitis, amblyopia, or myopia > 6D were not included. Patients who had received intravitreal triamcinolone or anti-vascular endothelial growth factor therapy, prior photocoagulation, or have had any intraocular surgery were also excluded. Normal healthy non-diabetic volunteers of similar age group as that of cases were taken as controls.
Tests of visual function were performed on all the subjects. Best corrected visual acuity was assessed using ETDRS chart [8] at a distance of 3 m. Scoring was done by identifying the last row where all five letters were identified. The log score for that row (these scores are shown in the margin of the ETDRS test) was determined. 0.02 log units for every letter were subtracted that was correctly identified beyond the last row where all of the letters are correctly identified.
Contrast sensitivity was assessed using Pelli-Robson chart [9] at 1 m distance under the same illumination conditions in the same consultation room. Each letter correctly read was scored as 0.05 log units and the test was terminated when two letters of the triplet with same contrast were not identified correctly.
Statistical analysis was done using chi-square test, Student’s t test, correlation analysis, and linear regression analysis. A p value of 0.05 or less was considered statistically significant.
Results
Two hundred and five cases (mean age, 52.8 ± 7.06 years) out of which 121 were males and 84 were females and 115 controls (mean age, 54.07 ± 9.05 years) out of which 73 were males and 42 were females were included. There was no statistically significant difference between the age and gender in the cases and controls (chi-square test, t test, p > 0.05). Three hundred and 82 eyes of cases and 226 eyes of controls, fulfilling the inclusion criteria were included in the statistical analysis. Mean HbA1c value in cases with diabetes mellitus was 6.837 ± 1.68. LogMAR VA and contrast sensitivity in the cases and controls is shown in Table 1. Statistically significant difference was observed between the two groups (p < 0.001).
Table 1.
LogMAR visual acuity and contrast sensitivity in the cases and controls
| Variable | Controls (n = 226) mean ± SD | Cases (n = 382) mean ± SD | t | p |
|---|---|---|---|---|
| LogMAR visual acuity | 0.187 ± 0.232 | 0.340 ± 0.222 | 8.4 | <0.001 |
| Contrast sensitivity | 1.428 ± 0.271 | 1.10 ± 0.276 | 12.9 | <0.001 |
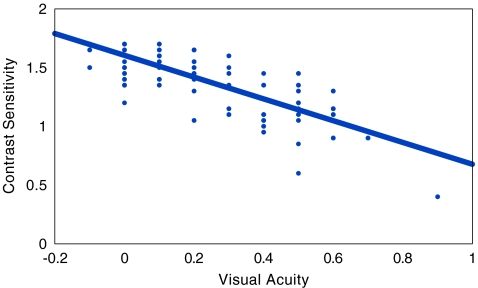
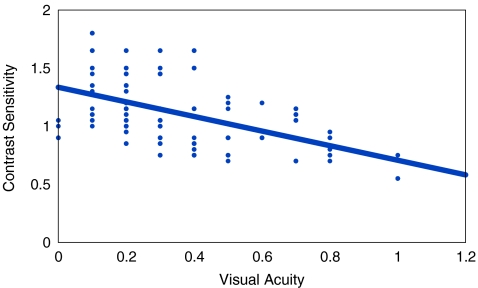
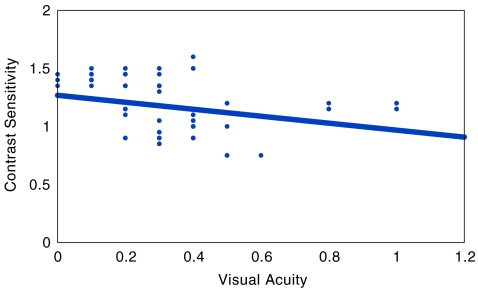
In the cases without diabetic retinopathy, mean LogMAR VA was 0.344 ± 0.221, whereas mean contrast sensitivity was 1.119 ± 0.286. In cases with non-proliferative diabetic retinopathy, mean LogMAR VA was 0.353 ± 0.231, whereas mean contrast sensitivity was 1.161 ± 0.233. In cases with early proliferative diabetic retinopathy, mean LogMAR VA was 0.300 ± 0.020, whereas mean contrast sensitivity was 0.920 ± 0.027. In the controls, mean LogMAR VA was 0.187 ± 0.232, whereas mean contrast sensitivity was 1.428 ± 0.271. Statistically significant difference was observed between controls and cases with diabetes mellitus but without retinopathy (t test, p < 0.001), and cases with non-proliferative diabetic retinopathy (t test, p < 0.001) respectively, both for LogMAR VA and contrast sensitivity. However, no statistically significant difference was observed between cases without retinopathy and cases with diabetic retinopathy group (t test, p > 0.05). Bivariate correlation between LogMAR VA and contrast sensitivity was calculated. Statistically significant correlation was observed in all the study groups except in cases with proliferative diabetic retinopathy (Table 2, Figs. 1, 2, and 3).
Table 2.
LogMAR visual acuity and contrast sensitivity in different study groups
| Sample no. | Subjects | No. of eyes | LogMAR visual acuity | Contrast sensitivity | Correlation | Significance |
|---|---|---|---|---|---|---|
| Mean ± SD | Mean ± SD | r | p | |||
| 1 | Controls | 226 | 0.187 ± 0.232 | 1.428 ± 0.271 | −0.824 | <0.001 |
| 2 | Cases without diabetic retinopathy | 281 | 0.344 ± 0.221 | 1.119 ± 0.286 | −0.466 | <0.001 |
| 3 | Cases with non-proliferative diabetic retinopathy | 93 | 0.353 ± 0.231 | 1.161 ± 0.233 | −0.307 | 0.003 |
| 4 | Cases with proliferative diabetic retinopathy | 8 | 0.300 ± 0.020 | 0.920 ± 0.027 | −0.456 | 0.440 |
Fig. 1.
Scatter plot, in controls, showing a statistically significant inverse correlation between visual acuity and contrast sensitivity (r = −0.824; p < 0.001)
Fig. 2.
Scatter plot, in patients of diabetes mellitus without retinopathy, showing a statistically significant inverse correlation between visual acuity and contrast sensitivity (r = −0.466) (p < 0.001)
Fig. 3.
Scatter plot, in patients of diabetes mellitus with retinopathy, showing a statistically significant inverse correlation between visual acuity and contrast sensitivity (r = −0.307) (p = 0.003)
In a multivariate model including fasting and post prandial blood sugar, only LogMAR VA (p < 0.001) and HbA1c (p = 0.002) had significant association with contrast sensitivity (Table 3). LogMAR VA and HbA1c were taken as the independent variables and their impact on the outcome, i.e., contrast sensitivity was calculated. The relationship between contrast sensitivity, LogMAR VA and Hb1Ac was derived in the form of an equation as following:
 |
Table 3.
Multivariate model to predict contrast sensitivity in patients of non-insulin dependent diabetes mellitus
| Beta | Standard error | t | p | |
|---|---|---|---|---|
| (Constant) | 1.526 | 0.071 | 21.392 | 0.000 |
| LogMAR visual acuity | −0.427 | 0.067 | −6.328 | 0.000 |
| HbA1c | −0.030 | 0.010 | −3.171 | 0.002 |
| Dependent variable: contrast sensitivity | ||||
Applicability of the equation derived was tested by calculating contrast sensitivity and comparing the calculated values with observed values. The calculated values of contrast sensitivity were found to match with the observed values with a mean variance of 15.63 ± 9.88%. The middle 50% values were found to lie in the range of 9% to 20%. The difference in observed values and predicted values was not found to be beyond 20% in 80% of cases.
Discussion
Contrast sensitivity can be used as an early index of changes in retina not demonstrated by measurements of visual acuity. Our study demonstrated significantly reduced contrast sensitivity in cases of diabetes mellitus without retinopathy and in cases with diabetic retinopathy in comparison to controls. Similar observations have been made in earlier studies [2–6, 10–14].
Statistically significant correlation was observed, between contrast sensitivity and LogMAR VA, in cases without diabetic retinopathy and in cases with non-proliferative diabetic retinopathy. For the first time, we were able to calculate and establish an inverse correlation between LogMAR VA and contrast sensitivity in such cases. However, in cases with proliferative diabetic retinopathy, such a correlation was not observed due to small sample size.
Studies have been done earlier with a common denominator of dissociation of contrast sensitivity and visual acuity in diabetes mellitus [2–6]. This dissociation suggests that the measurement of contrast sensitivity discloses visual functions that are different from those that underlie visual acuity. With the added advantage of it being a non-invasive functional test; measurement of contrast sensitivity has been found to be useful in detecting the early effects of diabetic retinopathy on neural activity. Several methods of measuring contrast sensitivity have been used with reliable results [2–4, 6, 10–16] The discriminative ability of letter contrast sensitivity in Pelli-Robson chart has been used as an effective screening tool to assess damage to the visual pathway of patients with diabetes mellitus both with and without retinopathy [5].
In a multivariate model, LogMAR VA (p < 0.001) and HbA1c (p = 0.002) were observed to have a significant association with contrast sensitivity, in cases of diabetes mellitus. Interestingly, significant difference in contrast sensitivity was not observed between diabetic cases without and with diabetic retinopathy, i.e., without and with retinal microvascular changes. These significant findings imply that contrast sensitivity is altered in diabetes mellitus but is not affected by development of retinal microvascular changes as the disease progresses to non-proliferative stage.
Our study has highlighted that contrast sensitivity and LogMAR VA have significant inverse correlation in cases without retinopathy and with non-proliferative retinopathy. Retinal microvascular changes do not have significant effect on contrast sensitivity. However, glycosylated hemoglobin values have significant association with contrast sensitivity. Contrast sensitivity dysfunction observed in diabetes mellitus results from changes in retinal function secondary to alteration in carbohydrate metabolism depicted in glycosylated hemoglobin.
References
- 1.Wild S, Roglic G, Green A, Sicree R, King H. Global prevalence of diabetes, estimates for the year 2000 and projections for 2030. Diab Care. 2004;27:1047–1053. doi: 10.2337/diacare.27.5.1047. [DOI] [PubMed] [Google Scholar]
- 2.Sokol S, Moskowitz A, Skarf B, Evans E, Molitch M, Senior B. Contrast sensitivity in diabetics with and without background retinopathy. Arch Ophthalmol. 1985;103:51–54. doi: 10.1001/archopht.1985.01050010055018. [DOI] [PubMed] [Google Scholar]
- 3.Nah H, Kwon OW, Kim HB, Lim SJ. Contrast sensitivity in non-insulin dependent diabetics. J Korean Ophthalmol Soc. 1986;27:317–320. [Google Scholar]
- 4.Nordmann JP, Guiqui A, Laroche L, Denis P, Saraux H. Contrast sensitivity and diabetes. Bull. 1990;90:465–469. [PubMed] [Google Scholar]
- 5.Stavrou EP, Wood JM. Letter contrast sensitivity changes in early diabetic retinopathy. Clin Exp Optom. 2003;86(3):152–156. doi: 10.1111/j.1444-0938.2003.tb03097.x. [DOI] [PubMed] [Google Scholar]
- 6.Dosso AA, Yenice-Ustun F, Sommerhalder J, Golay A, Morel Y, Leuenberger PM. Contrast sensitivity in obese dyslipidemic patients with insulin resistance. Arch Ophthalmol. 1998;116:1316–1320. doi: 10.1001/archopht.116.10.1316. [DOI] [PubMed] [Google Scholar]
- 7.Chylack LT, Wolfe JK, Singer DM, Leske C, Bullimore MA, Bailey IL, et al. The lens opacity classification system III. Arch Ophthalmol. 1993;111:831–836. doi: 10.1001/archopht.1993.01090060119035. [DOI] [PubMed] [Google Scholar]
- 8.Ferris FL, III, Kassoff A, Bresnick GH, Bailey I. New visual acuity charts for clinical research. Am J Ophthalmol. 1982;94:91–96. [PubMed] [Google Scholar]
- 9.Pelli DG, Robson JG, Wilkins AJ. The design of a new letter chart for measuring contrast sensitivity. Clin Vis Sci. 1988;2:187–199. [Google Scholar]
- 10.Ghafour IM, Foulds WS, Allan D, McClure E. Contrast sensitivity in diabetic subjects with or without retinopathy. Br J Ophthalmol. 1982;66:492–495. doi: 10.1136/bjo.66.8.492. [DOI] [PMC free article] [PubMed] [Google Scholar]
- 11.Hyvarinen L, Laurinen P, Rovamo J. Contrast sensitivity in evaluation of visual impairment due to diabetes. Acta Ophthalmol. 1983;61:94–101. doi: 10.1111/j.1755-3768.1983.tb01399.x. [DOI] [PubMed] [Google Scholar]
- 12.Khosla PK, Talwar D, Tewari HK. Contrast sensitivity changes in background diabetic retinopathy. Can J Ophthalmol. 1991;26:7–11. [PubMed] [Google Scholar]
- 13.Dosso AA, Bonvin ER, Morel Y, Golay A, Assal JP, Leuenberger PM. Risk factors associated with contrast sensitivity loss in diabetic patients. Graefes Arch Clin Exp Ophthalmol. 1996;234:300–305. doi: 10.1007/BF00220704. [DOI] [PubMed] [Google Scholar]
- 14.Abrishami M, Heravian J, Derakhshan A, Mousavi M, Banaee T, Daneshvar R, et al. Abnormal Cambridge low-contrast grating sensitivity results associated with diabetic retinopathy as a potential screening tool. East Med Health J. 2007;13:4. [PubMed] [Google Scholar]
- 15.Leo MAS, Falsini B, Caputo S, Ghirlanda G, Porciatti V, Greco AV. Spatial frequency–selective losses with pattern electroretinogram in type I diabetic patients without retinopathy. Diabetologia. 1990;33:726–730. doi: 10.1007/BF00400342. [DOI] [PubMed] [Google Scholar]
- 16.Arden GB, Jacobson JJ. A simple grating test for contrast sensitivity: preliminary results indicate value in screening for glaucoma. Invest Ophthalmol Vis Sci. 1978;17:23–25. [PubMed] [Google Scholar]


