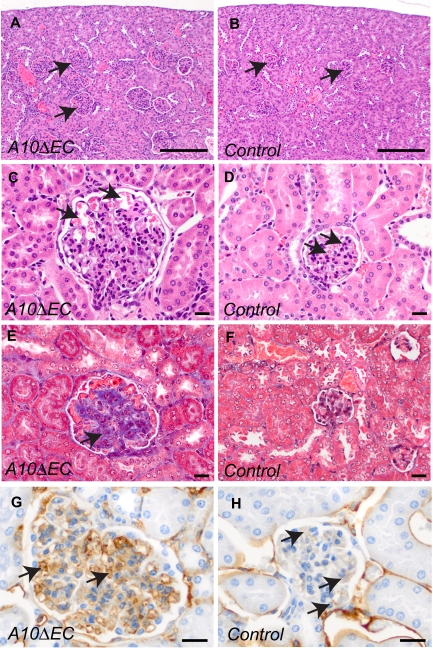
Figure 6.
A10ΔEC mice display marked glomerular pathology. (A-D) H&E staining of kidney sections revealed enlarged glomeruli (A) with increased cellularity (C) in A10ΔEC mice (A,C) compared with control mice (B,D; arrows point to glomeruli in panels A and B, and to glomerular microvessels in panels C and D). (E-F) Masson trichrome staining revealed increased amounts of blue-staining material consistent with increased collagen deposition within glomeruli of A10ΔEC individuals (indicated by arrow in panel E) not present in control individuals (F). MECA-32 immunohistochemistry of kidney sections showed positive staining of most cells present within glomeruli of an A10ΔEC mouse (H, arrows), with only few capillaries stained in a glomerulus of a control mouse (G, arrows). Scale bars in panels A-B: 200 μm; C-H: 20 μm.

