Abstract
The transcription factor Forkhead box protein 2 (FoxP2) is expressed in two cell groups of the brainstem that have been implicated in sodium appetite regulation: the pre-locus coeruleus (pre-LC) and parabrachial nucleus - external lateral-inner subdivision (PBel-inner). Because the connections of these two groups are unknown, neuroanatomical tracing methods were used to define their central projections. The pre-LC outputs were first analyzed using an anterograde axonal tracer - Phaseolus vulgaris leucoagglutinin (PHAL) to construct a brain map. Next, we examined whether the FoxP2 immunoreactive (FoxP2+) neurons of the pre-LC contribute to these projections using a retrograde neuronal tracer - cholera toxin β-subunit (CTb). CTb was injected into selected brain regions identified in the anterograde tracing study. One week later the rats were killed, and brainstem sections were processed by a double immunohistochemical procedure to determine whether the FoxP2+ neurons in the pre-LC and/or PBel-inner contained CTb. FoxP2+ pre-LC neurons project to: 1) ventral pallidum; 2) substantia innominata and bed nucleus of the stria terminalis; 3) paraventricular, central medial, parafascicular, and subparafascicular parvicellular thalamic nuclei; 4) paraventricular (PVH), lateral, perifornical, dorsomedial (DMH), and parasubthalamic hypothalamic nuclei; and 5) ventral tegmental area (VTA), periaqueductal gray matter (PAG), dorsal and central linear raphe nuclei. FoxP2+ PBel-inner neurons project to the PVH and DMH, with weaker connections to the LHA, VTA, and PAG. Both the pre-LC and PBel-inner project to central sites implicated in sodium appetite, and related issues, including foraging behavior, hedonic responses to salt intake, sodium balance, and cardiovascular regulation, are discussed.
Keywords: bed nucleus of stria terminalis, parabrachial nucleus, pre-locus coeruleus, hypothalamus, thalamus, substantia innominata, ventral pallidum, ventral tegmental area
1. Introduction
Prolonged periods of sodium deprivation elicit a strong drive to find and ingest salt in virtually all terrestrial vertebrates. This behavior has been termed ‘sodium appetite’ and its biological basis has been studied for 75 years, starting with the original investigations of Curt Richter (Richter, 1936) who observed that rats consume large quantities of saline following adrenalectomy. Thirty years later, this response was shown to be due to the absence of the mineralocorticoid hormone – aldosterone, which is critical for sodium retention by the kidneys (Fregly and Waters, 1966). Later work documented that aldosterone alone is not the sole factor driving sodium appetite, but acts in concert with a set of specific brain pathways – for a review see (Geerling and Loewy, 2008).
Sodium appetite regulation has been hypothesized to be dependent on brainstem sensory pathways as well as two forebrain sensory circumventricular organs - the organum vasculosum of the lamina terminalis (OVLT) and subfornical organ (SFO) (Johnson and Thunhorst, 1997, McKinley et al., 2003, Geerling and Loewy, 2008). As summarized in these three review articles, a considerable amount of work has been published that demonstrates that circulating angiotensin II acts on chemosensitive neurons in the OVLT, SFO, and area postrema (AP) to exert stimulatory and inhibitory effects on salt intake but it still remains unclear what other brain cell groups are involved. An important issue that has not been addressed is whether any of the central cell groups that regulate sodium homeostasis can also affect central sympathetic networks, and this is of interest because there is controversy over whether increased levels of dietary salt cause certain types of hypertension and lead to increases in morbidity in humans (McCarron et al., 2009).
For the last several years, our laboratory has been analyzing the brainstem cell groups involved in sodium homeostasis. Three separate salt-sensing pathways may exist (Geerling and Loewy, 2007, 2008). One pathway detects sodium need, and relies upon a specific group of neurons in nucleus tractus solitarius (NTS) which express mineralocorticoid receptors and the glucocorticoid-inactivating enzyme 11-β-hydroxysteroid dehydrogenase type 2 (HSD2), making them selective for the detection of aldosterone (Geerling et al., 2006). These neurons, which we refer to as the ‘HSD2 neurons’, become c-Fos activated after sodium depletion (Geerling et al., 2006). The efferent projections of these neurons have been analyzed (Geerling and Loewy, 2006), and they contribute to a projection system that is distinct from the central taste pathways but direct testing of this hypothesis has not yet been made.
Two other independent pathways are involved in sodium detection. One transmits the taste sensation of salt and the other provides post-ingestive feedback regarding the internal sodium status. Sodium taste receptors localized primarily on the anterior two-thirds of the tongue send information via the chorda tympani of the VIIth cranial nerve to the NTS. The NTS then connects to the parabrachial nucleus and taste information is subsequently sent to the gustatory part of the thalamus which, in turn, projects to the insular cortex. Another component of the parabrachial taste area projects to limbic forebrain areas which are part of the reward system (Hajnal and Norgren, 2005, Norgren et al., 2006, Mungarndee et al., 2008).
Post-ingestive information reaches the NTS by two routes: a direct neural pathway and an indirect hormonal pathway that acts via the area postrema. The direct pathway involves a vagal sensory projection from the pyloric region of the stomach and duodenum to the HSD2 neurons and to other medial NTS neurons (Shin and Loewy, 2009). The NTS also receives inputs from sodium receptors localized in the hepatic portal vein (Kahrilas and Rogers, 1984), but it is unknown whether these afferents contact the HSD2 neurons.
The area postrema (AP) is a medullary circumventricular organ that is directly exposed to substances carried in the plasma (e.g., solutes, peptides, steroid hormones). For example, one of these peptides implicated in sodium balance is angiotensin II which binds to and excites AP neurons (Yamada and Mendelsohn, 1989, Price et al., 2008). AP neurons project directly to both sodium-sensitive HSD2 neurons of the NTS as well as to other NTS neuronal phenotypes including the neurotensin-immunoreactive neurons (Sequeira et al., 2006). The AP neurons also project directly to the FoxP2 immunoreactive (FoxP2+) neurons of the pre-locus coeruleus nucleus (pre-LC) and the inner division of the external lateral parabrachial subnucleus (PBel-inner) (Stein and Loewy, 2010). The HSD2 neurons of the NTS and FoxP2+ neurons of the pre-LC and PBel-inner express c-Fos one week after sodium deprivation (Geerling et al., 2006, Geerling et al., 2011).
All of the neurons in the pre-LC and PBel-inner that become c-Fos activated during extended periods of sodium deprivation also constitutively express FoxP2 (Geerling et al., 2011). This was demonstrated with the use of two different commercial antibodies directed against this transcription factor. Thus, FoxP2 is a useful marker for defining a specific functional class of neurons implicated to sodium homeostasis.
The pre-LC is small cell group that is localized in the lateral part of the periventricular gray matter at the level of the pons. It lies just rostral to the locus coeruleus. Virtually all previous published retrograde tracing studies that have analyzed the brainstem projections to the midbrain and forebrain have overlooked this unique population of neurons. Hence, many of the published reports describing efferent projections arising from the locus coeruleus may, in fact, actually have originated from the pre-LC. This error is understandable, and is present in our own research (Krout and Loewy, 2000) (see Discussion). Moreover, the discovery of a unique subset of FoxP2-expressing neurons in the PBel-inner offers a new approach in the analysis of the efferent connections of the parabrachial nucleus (PB) that may further extend earlier contributions showing the heterogeneity of the cell groups that form the PB (Fulwiler and Saper, 1984, Krout and Loewy, 2000).
Because the pre-LC and PBel-inner contribute to an ascending projection system implicated in sodium appetite regulation, we analyzed the efferent connections of these two cell groups. Initially, this study was designed to investigate only the ascending projections of the pre-LC, but as the data were being accumulated from the retrograde tracing experiments, it became clear that the PBel-inner region projects to most of the same forebrain sites as the pre-LC, so these latter findings are included in this report as well. The present report describes the efferent connections of the FoxP2+ neurons of both cell groups.
2. Materials and Methods
All animal procedures were approved by the Washington University School of Medicine Animal Care Committee, conformed to NIH guidelines, and were performed on Sprague-Dawley rats under sodium pentobarbital (50 mg/kg, intraperitoneal) anesthesia. At the termination of each experiment, the rats were anesthetized and killed by transcardiac perfusion with 200 ml of saline, followed by 500 ml of 4% paraformaldehyde in 0.1 M sodium phosphate buffer (pH = 7.4). Brains were removed and stored in fixative for 1–2 weeks.
2.1 Normal rat brainstem: FoxP2 Immunohistochemistry
The transcription factor- Forkhead box protein P2 (FoxP2) exhibits a specific expression pattern within the dorsolateral pons, being present in several subpopulations of neurons in the PB (Stein and Loewy, 2010). Two such populations include the pre-LC and PBel-inner, enabling us to identify these two cell groups implicated in sodium appetite regulation with immunohistochemical methods (see below).
A series of rats were prepared for cytoarchitectonic analysis of the pre-LC for this study and a previous one (Geerling et al., 2011). Paraformaldehyde-fixed brainstems from male and female rats (n=31; 250–350g; Harlan, Indianapolis, IN) were cut in the coronal, horizontal, or sagittal planes at 75 µm on a freezing microtome. Serial sections were immunostained with antibodies directed against FoxP2 by the ABC-DAB method. Sections were incubated overnight in rabbit antibodies to FoxP2 (1:8,000; ab6046, Abcam, Cambridge, MA) made in 0.3% Triton-X solution (Sigma, St. Louis, MO) and 5% donkey serum in 0.1 M sodium phosphate buffer (pH = 7.4). This Triton-donkey serum- phosphate buffer solution was for all incubations containing either primary or secondary antibodies. These sections were then washed in potassium phosphate buffered saline (KPBS; 0.01M, pH = 7.4), transferred to a biotinylated donkey anti-rabbit secondary antibody (1:250; Jackson ImmunoResearch, West Grove, PA) solution made up in 5% donkey serum in 0.1 M sodium phosphate buffer. The sections were washed in KPBS, treated for 1 hour in the avidin-biotin complex (ABC, Vectastain kit, Vector Labs, Burlingame, CA) solution, washed in KPBS (3x), and colorized in a cobalt-diaminobenzidine (Co-DAB) solution (D-0426, Sigma). A single Co-DAB tablet was dissolved in 20–25 ml of distilled water with one tablet of urea. Following a 15 minute reaction in this solution, sections were washed in KPBS (3x), mounted on gelatinized slides, and air dried. Subsequently, some of the sections were stained with 0.1% thionin (pH = 4.6) and coverslipped, while others were coverslipped directly.
The rabbit polyclonal antibody to FoxP2 was made against a synthetic peptide from residues 700 to the C-terminus of human FoxP2 which was conjugated to keyhole limpet hemocyanin. This antibody showed a single band in Western blots performed by the manufacturer and was specific to human and mouse FoxP2. Based on sequence homology, this antibody was predicted by the vendor to be specific against rat FoxP2 as well. This antibody has been successfully used in two previous publications (Stein and Loewy, 2010, Geerling et al., 2011). This antibody was further characterized in a series of immunohistochemical tests on sections through the PB. A solution containing both the rabbit anti-FoxP2 along with another highly specific sheep FoxP2 antibody (1:5000; Product #AF5647; R&D Systems, Minneapolis, MN) was used in a double immunohistochemical procedure that was used to analyze the efficiency of these two antibodies, and we found that 99% of the FoxP2+ neurons in the dorsal lateral PB subnucleus were co-labeled with the two antibodies (Geerling et al., 2010).
2.2 PHAL anterograde experiments: injections and histology
Anesthetized rats were placed in a stereotaxic frame with their skull fixed in the level position (n= 42). A small craniotomy was made on the dorsal surface of the skull. The anterograde axonal tracer Phaseolus vulgaris leucoagglutinin (PHAL, 2.5% solution made in 0.02 M potassium phosphate buffer, pH 8.0; Vector Labs, Burlingame, CA) was loaded into a glass micropipette (tip ≈ 25 µm) under microscopic control, and then, the pipette was stereotaxically positioned in the pre-LC with the aid of a micromanipulator. The stereotaxic coordinates used were: 1.20 mm lateral to the midline, −0.28 mm caudal to the interaural line, and 5.4 mm deep to the dural surface. PHAL was iontophoresed for 20 minutes using 7 µA positive pulses delivered for 7 second on/off intervals from a Midguard precision current source (Stoelting, Wood Dale, IL). The glass pipette was left in place for another 5–10 min to minimize diffusion of PHAL along the pipette track. The pipette was removed, and the wound closed in layers. Seven days later, the rats were anesthetized, perfused through the heart with saline followed by 4% buffered paraformaldehyde, and their brains were removed and stored in fixative for 1–2 weeks prior to histological processing.
Brains were cut at a 50 µm thickness in the transverse plane on a freezing microtome and stored as a one-in-five series in 0.1 M sodium phosphate buffer containing 0.1% sodium azide at room temperature. Sections through the pre-LC were immunostained with antibodies against PHAL using the ABC-DAB technique. Four cases were obtained that had injections involving this nucleus, and then, a complete one-in-five series of sections throughout the brains from these animals were processed for PHAL immunohistochemistry. In a few cases, the PHAL immunostained sections containing the injection site were intensified by gold staining (Krout et al., 1998).
The PHAL histology protocol was as follows: Sections were incubated overnight in a goat anti-PHAL antiserum (AS 2224, Vector) that was diluted 1:20,000 with the Triton-donkey serum-sodium phosphate buffer solution described above. Sections were washed in KPBS, transferred to a biotinylated donkey anti-goat secondary antibody solution (1:200; Jackson), then washed in KPBS, incubated in the ABC solution (Vector) for 1 hour, washed in KPBS, and colorized in diaminobenzidine for 5–10 min (D-4418; Sigma). Sections were washed in KPBS, mounted on gelatin-coated glass slides, air-dried, counterstained with 0.1% thionin (pH = 4.6), and coverslipped.
2.3 CTb retrograde tracing experiments: injections and histology
Stereotaxic injections of cholera toxin β-subunit (CTb, #104; List Biological, Campbell, CA; 0.1% solution made in distilled water) were made in various brain regions that are described below. CTb was iontophoresed for 20–30 minutes using 7 µA positive pulses for 7 seconds on/off periods (as described above) in anesthetized rats (n=577) that had been positioned in a stereotaxic apparatus. Twenty-eight different brain regions were analyzed. The sites selected for analysis were determined on the basis of the anterograde axonal labeling data (Fig. 3). The stereotaxic coordinates were taken from Paxinos and Watson (1997). The rats were allowed to survive for 5–7 days. Anesthetized rats were killed by vascular perfusion as described for the PHAL experiments. Their brains were removed, stored in fixative for 1–2 weeks, and processed for CTb immunohistochemistry.
Figure 3.
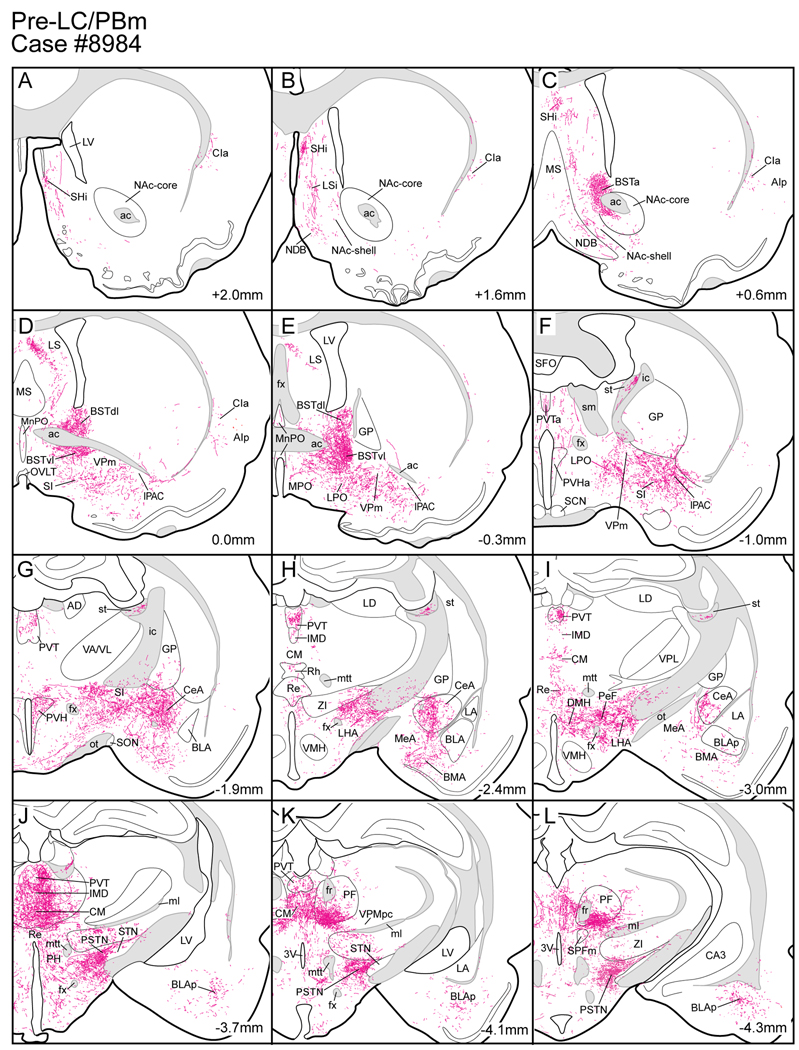
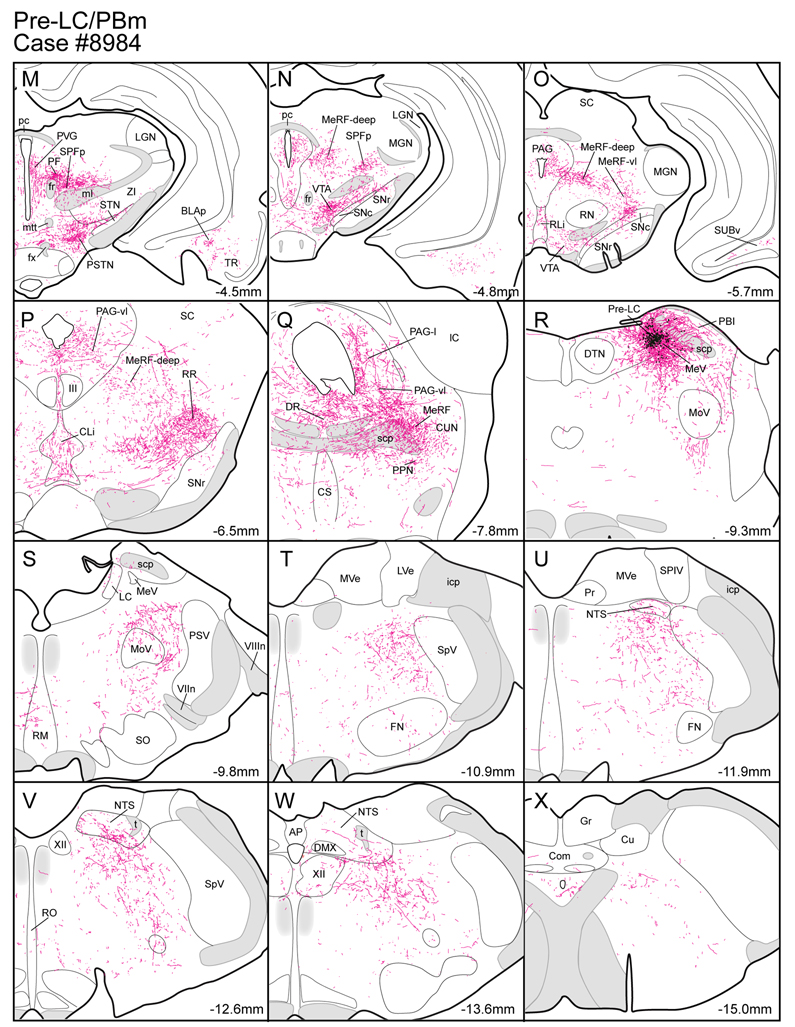
Line drawings arranged from rostral (A) to caudal (X) to show the distribution of axonal labeling throughout a rat brain (case #8984) seven days after a PHAL injection in the pre-LC region. The numbers in the lower right hand corner refer to the bregma levels. Drawings were adapted and modified from a standard rat brain atlas (Paxinos and Watson, 2005a).
Transverse sections (50 µm) containing the injection sites were incubated in a goat polyclonal antiserum against cholera toxin β subunit (CTb; 1:25,000 dilution #703; List Biologicals, Campbell, CA) for 16 hours and immunostained by the ABC-DAB method, mounted on glass slides, air-dried, counter-stained with 0.1% thionin, and coverslipped. The sections were examined microscopically to determine whether the CTb injection had been successfully injected in the specific brain region under study.
Typically, groups of 5 to 10 rats were injected with CTb aimed at a particular brain region that had been selected on the basis of the anterograde axonal labeling shown in Figure 3. If the injections failed to involve the region of interest, the stereotaxic coordinates were modified and a second set of rats were injected with CTb. Subsequently, the resulting injection sites were examined. In some cases, a third set of rats had to be used to obtain an optimal injection. Once this was achieved, then the brainstem from the optimal case was processed as described below.
Sections from the upper brainstem containing both the pre-LC and parabrachial nuclei were processed by a direct double-immunofluorescence method. Free-floating sections were incubated in a mixture of two antibodies: rabbit anti-FoxP2 (1:10,000; ab16046; Abcam, Cambridge, MA) and goat anti-CTb (1:25,000, List) overnight, washed in KPBS, and transferred to a solution containing both Cy2-donkey anti-rabbit (1:500; Jackson) and Cy3-donkey anti-goat (1:500; Jackson). The sections were washed in KPBS, mounted on glass slides, dried at room temperature, and coverslipped using a fade-retardant glycerol mounting solution containing sodium azide and n-propyl gallate.
2.4 Photography
Brightfield digital images were taken using a CCD camera and Nikon ACT-1 software (v2.62). Image cropping, resizing, and adjustments in brightness, contrast, sharpness, and color balance were performed using Adobe Photoshop CS.
Confocal imaging was performed with an Olympus Fluoview FV500b laser-scanning microscope. Images were acquired as multiple individual stacks using a 20x oil objective (NA 1.17) in 1 µm z-steps through the full thickness of the tissue section – usually 50 µm transverse sections. Next, 30–40 z-frames were collapsed into a two-dimensional (2-D), maximum-projection image to produce individual tiles (642 × 642 µm) each at a resolution of 1024 × 1024 pixels (one pixel in the X–Y plane, the minimum unit of resolution, covers roughly 0.6 µm × 0.6 µm). Finally, individual 2D projection images were aligned into photomontages using Adobe Photoshop, with adjustments in brightness and contrast as necessary.
All manipulations of confocal stacks and z-frame projections were performed using MetaMorph software (Molecular Devices, Sunnyvale, CA, USA). Pseudocoloration was added using MetaMorph. The brightness, and contrast adjustments of the photomicrographs were made using Abode Photoshop. Line drawings of the cytoarchitectonic boundaries were added to all of the photomicrographs using the Adobe Illustrator program. The key neuroanatomical landmarks were obtained from a separate series of digital images from dark field material. These images were superimposed on the photomontages of the fluorescence material, and outlines of the various relevant structures were then added manually to these digital images
Various symbols representing the individual labeled neurons (e.g., CTb, FoxP2, and CTb+FoxP2) seen in the confocal montages were added to the Adobe Illustrator drawings. Figures 5–15 present data from the optimal CTb cases. Quantitative data presented in the Results section were based cell counts from 2 sections from the 1-in-5 series of sections. These were spaced 250 µm apart, and thus, the data presented here are an underestimation of the populations of CTb, FoxP2+, and co-labeled CTb and FoxP2+ neurons found in these sites.
Figure 5.
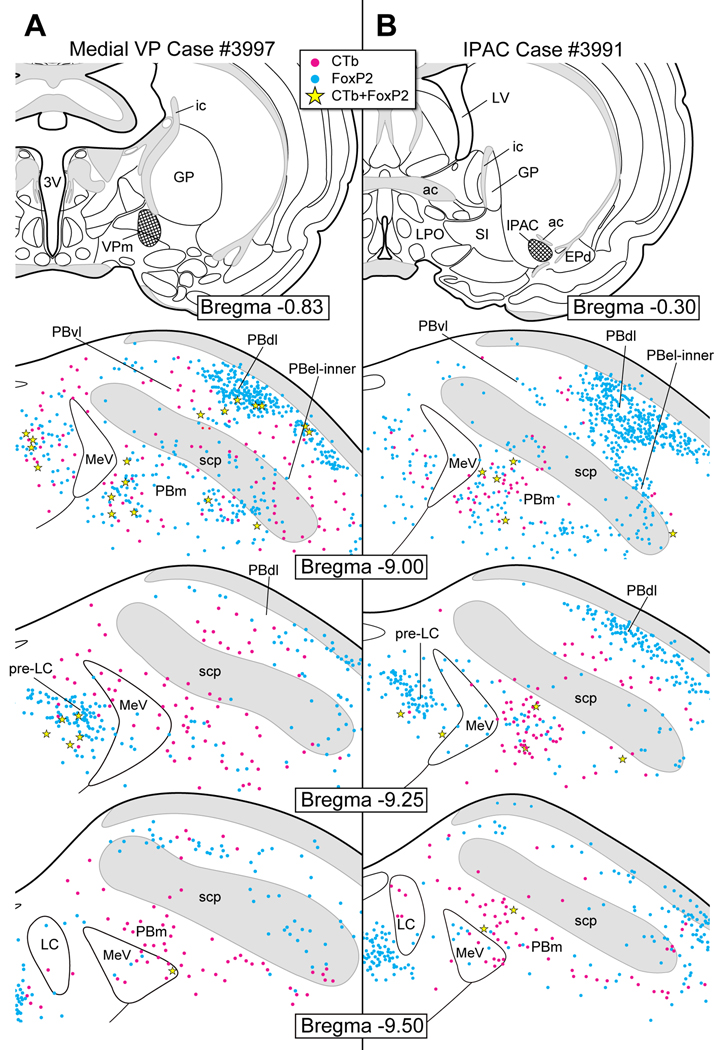
A. CTb injection in the medial part of the ventral pallidum (VPm). The lower three line drawings show CTb, FoxP2+, and CTb and FoxP2+ co-labeled neurons in the dorsolateral pons. B. CTb injection in the interstitial portion of the anterior commissure (IPAC). Very few CTb and FoxP2+ co-labeled were found in the pre-LC or the PBel-inner.
Figure 15.
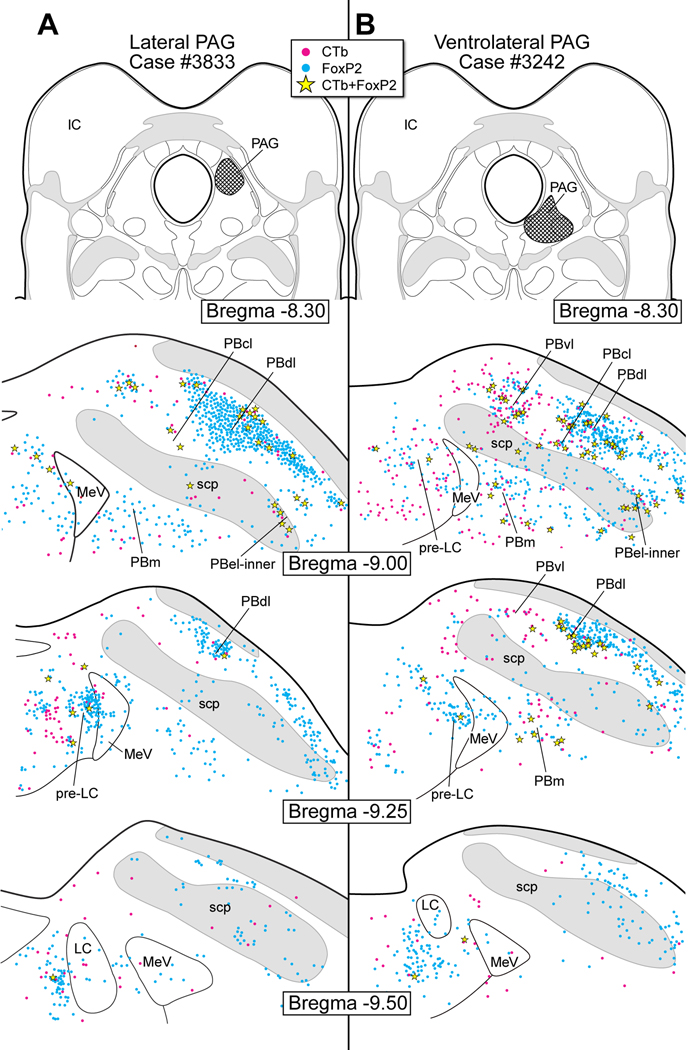
A. CTb injection in the dorsolateral periaqueductal gray matter (PAG). A few co-labeled neurons were found mainly in PBel-inner and PBdl.
B. CTb injection in the ventrolateral PAG. A few co-labeled neurons were observed in PBel-inner and PBdl. Few co-labeled neurons were present in the pre-LC.
3. Results
3.1 Pre-locus coeruleus nucleus: anatomical localization
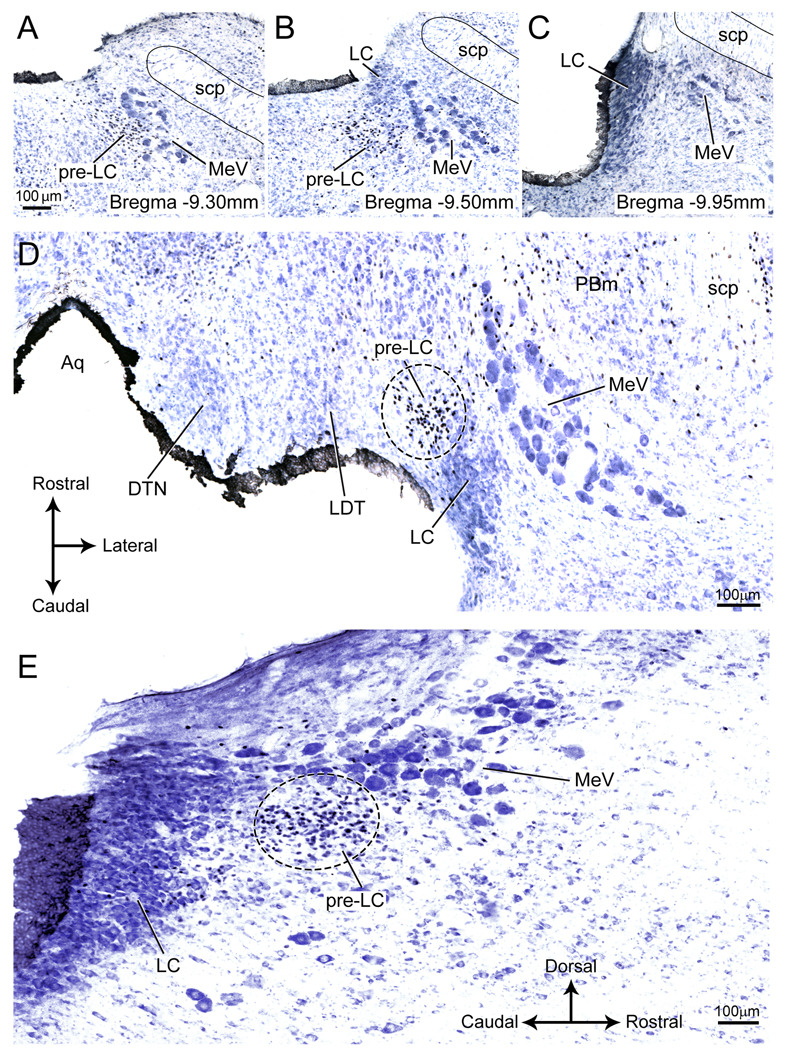
In thionin-stained histological preparations of the dorsolateral pons, the pre-LC does not stand out from the surrounding periventricular gray matter but we discovered that because these neurons express FoxP2, they could be identified by immunostaining (Geerling et al., 2010). By using cobalt-intensified immunostaining followed by thionin-counterstaining, the cytoarchitectonic position of the FoxP2+ neurons in relationship to other pontine cell groups could be established (Fig. 1). The nuclei of the FoxP2+ neurons were stained an intense black color and hence, they could readily be distinguished from the near-by blue-stained neurons and glial cells (Fig.1).
Figure 1.
FoxP2+ neurons in and around the pre-LC shown in the three anatomical planes (transverse, horizontal, and sagittal).
A–C: A series of photomicrographs showing three transverse sections arranged rostral (A) to caudal (C) showing FoxP2+ neurons with their nuclei stained black. In panel A, the pre-LC neurons lie within the periventricular gray matter, and are clustered medial to the mesencephalic nucleus of the trigeminal nerve (MeV). Some of the pre-LC neurons intermingle with the MeV. Panel B shows the rostralmost part of the locus coeruleus (LC), and the pre-LC is positioned more medial to the MeV. Panel C presents a section through the locus coeruleus. No pre-LC neurons are found at this level of the brainstem.
D: Horizontal section showing that the pre-LC lies medial to the mesencephalic nucleus of the trigeminal nerve (MeV) and rostral to the locus coeruleus (LC). The LC is found at the −9.6 to −10.2 mm bregma levels ((Paxinos and Watson, 2005b).
E: Sagittal section showing the rostral position of the pre-LC relative to the LC. Note that many of the pre-LC neurons are intermixed with the MeV.
For abbreviations for all figures, see list.
The pre-LC lies just rostral to the locus coeruleus (LC) and medial to the mesencephalic trigeminal nucleus (MeV) (Fig. 1). Some of the pre-LC neurons are intermixed in the MeV (see Figs. 1A and E). The pre-LC neurons are smaller than the neurons found in Barrington’s nucleus; this difference is illustrated in Figure 50 of Swanson’s rat brain atlas (Swanson, 1998). None of the FoxP2+ cells contain tyrosine hydroxylase immunoreactivity, indicating that they are a separate population from the LC (unpublished observations). Their position relative to the LC can be seen in sagittal and horizontal sections that are illustrated in Figures 1D and E.
Besides the pre-LC, other FoxP2+ neurons lie in the dorsolateral pons, including in several subgroups of the parabrachial region (data not presented). As previously reported, FoxP2+ neurons were localized in the dorsal lateral, medial, ventral, external lateral- inner PB subnuclei as well as in the Kölliker-Fuse nucleus (Stein and Loewy, 2010).
3.2 Anterograde axonal tracing experiments
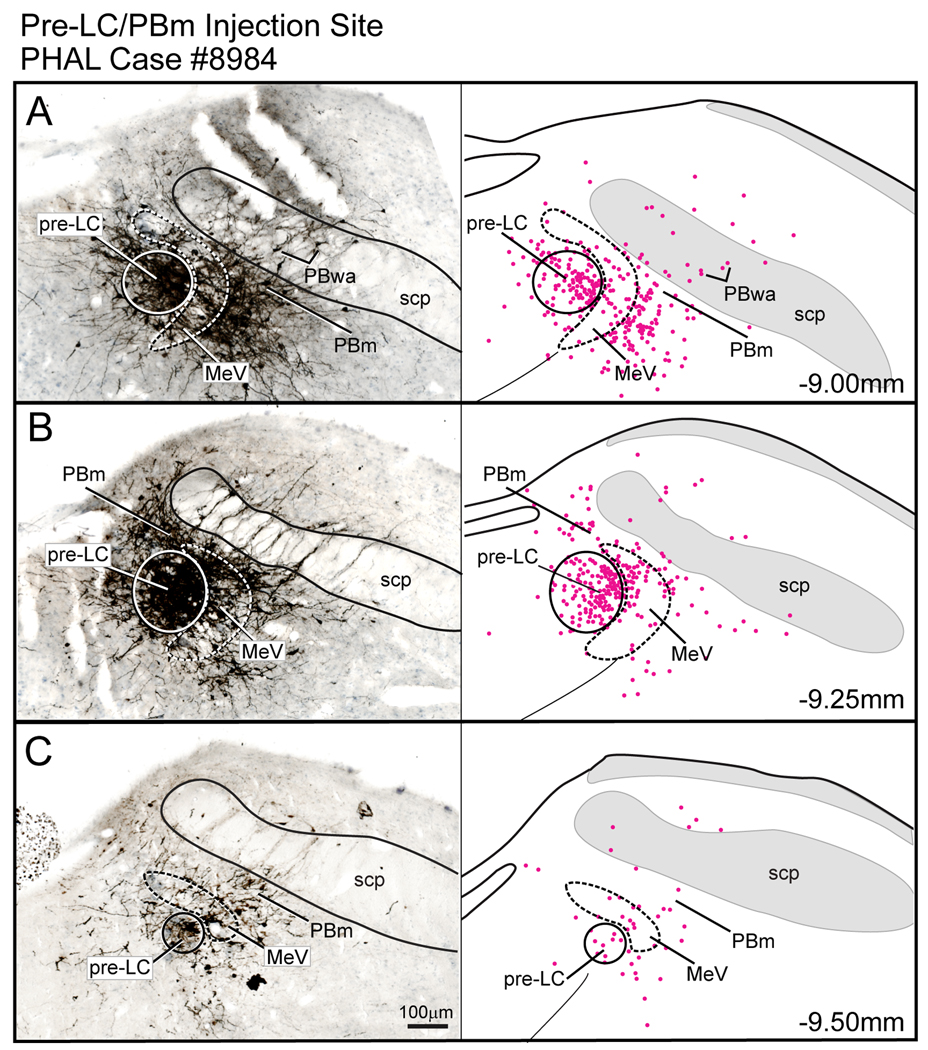
Case #8984 had a PHAL injection centered in the pre-LC region that spread laterally into the MeV (Fig.2). FoxP2+ neurons associated with the pre-LC are also dispersed within the MeV and this latter group of neurons was also probably labeled by this PHAL injection. Additional PHAL-labeled neurons were found in the medial PB and PB waist area. This cell body labeling may have been due to PHAL uptake by dendrites from both regions that extend into the pre-LC/MeV zone. For example, the dendrites of the PB waist area neurons radiate into the MeV (see Fig. 9E in (Herbert and Bellintani-Guardia, 1995)).
Figure 2.
PHAL injection centered in the pre-LC region. In this experiment, some of the tracer spread into the mesencephalic nucleus of the trigeminal nerve (MeV) and medial parabrachial region (PBm). Note there were also a few PHAL labeled neurons in the PB waist area (PBwa) and PB ventral lateral area immediately dorsal to the superior cerebellar peduncle (scp). The accompanying line drawings show the distribution of PHAL labeled neurons. Some of these in the PBm and PBwa areas may be due to uptake of PHAL by the dendrites which extend into the region of the MeV region.
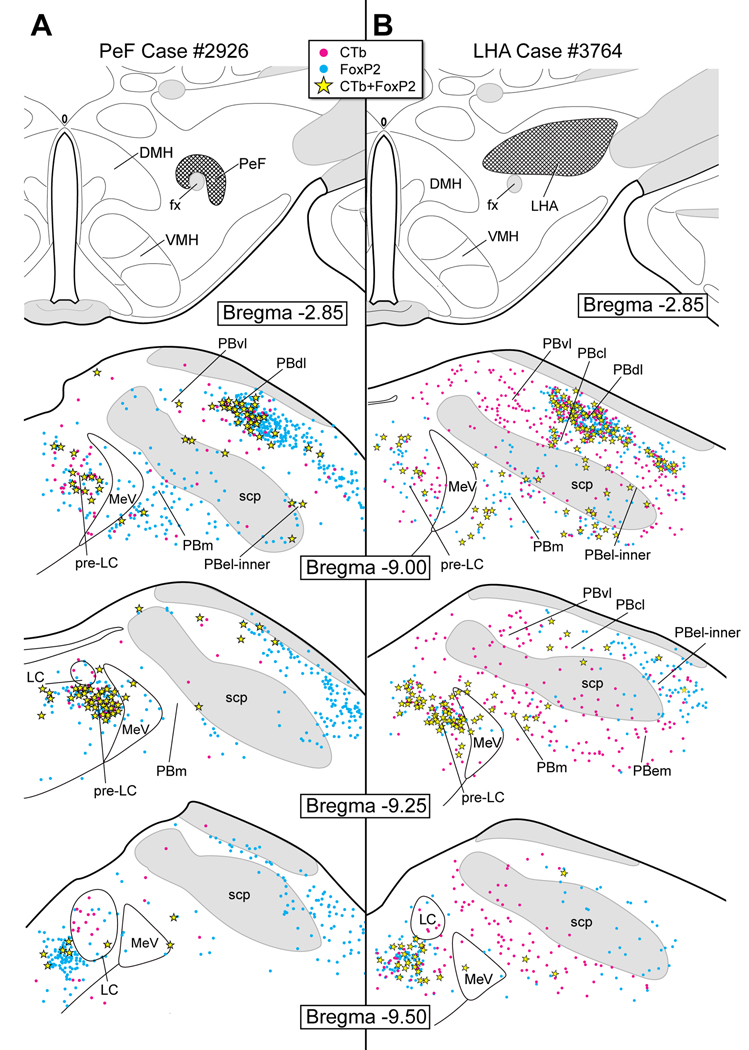
Figure 9.
A. CTb injection site in the perifornical hypothalamic region (PeF). This produced co-labeled neurons primarily in the pre-LC and PBdl.
B. CTb injection in the lateral hypothalamic area (LHA). Co-labeled neurons were found in the pre-LC and PBdl. Only a small number of co-labeled neurons were seen in the PBel-inner. Single CTb-labeled neurons were seen in the PBm, PBvl, PBwa (embedded in the scp) and PBem, although these were not FoxP2+.
Figure 3 shows a series of brain drawings showing the pattern of PHAL axonal labeling in case #8984. The pre-LC axonal trajectory can be seen in Figure 3R. This fiber bundle continues rostrally as illustrated in Figure 3Q where a massive bundle of axons streams into the mesencephalic reticular formation and subsequently sends a collection of fibers into the periaqueductal gray matter (PAG). Axons from this system provide a dense plexus of fibers targeting the dorsal raphe (Fig. 3Q) and the central linear raphe nuclei (Fig. 3P). Other fibers continue rostrally into the periventricular gray matter (Fig. 3M), where they terminate in several of the midline thalamic nuclei (Figs. 3J–L), including the central medial, intermediodorsal, and posterior paraventricular thalamic nuclei (Fig. 3J).
A second bundle of axons entered the mesencephalic reticular formation (MeRF) (Fig. 3Q), and coursed rostrally in its deep part (Figs. 3N–O) to terminate in the parafascicular thalamic nucleus (Fig. 3M). Another prominent fiber bundle was identified medial to the cuneiform nucleus (Fig. 3Q) and passed through the retrorubal region (Fig. 3P). In successively rostral sections, PHAL-labeled fibers were seen in the ventral tegmental area (Fig. 3N).
Axonal labeling was found throughout the hypothalamus beginning with a clustering of axons in the parasubthalamic nucleus (Figs. 3J–M), and at more rostral levels in the lateral hypothalamic area (Figs. 3G–I). Additional labeling was found in the perifornical hypothalamic area (Fig. 3I). Medial hypothalamic sites including the dorsomedial and paraventricular hypothalamic nuclei were also labeled (Figs. 3I and 3G). Labeled fibers were seen in the lateral and medial parvocellular parts of the paraventricular hypothalamic nucleus as well as its magnocellular region. No axonal labeling was found in the supraoptic hypothalamic nucleus or suprachiasmatic nucleus. The bulk of this projection continued to the lateral preoptic region (Fig. 3F), with branches extending into the substantia innominata (Figs. 3F and G), medial part of the central nucleus of the amygdala (Figs. 3G–I), basomedial amygdala (Fig. 3H), and basolateral posterior amygdala (Figs. 3I–M). A small contingent of PHAL-labeled axons was traced to the ventral subiculum (Fig. 3O).
A major termination site was observed in the bed nucleus of the stria terminalis, targeting its anterior, dorsolateral, and ventrolateral subdivisions (Figs. 3C–E). More rostrally, a small group of labeled fibers could be traced through the nucleus of the diagonal band, lateral septum and finally to the septohippocampal nucleus (Figs. 3A–E).
Apart from the ascending projections described above, we observed a descending projection to the medulla oblongata (see Figs. 3S–X). These descending axons traveled in the dorsolateral reticular formation, encircling the trigeminal motor nucleus and shifted medially at more caudal levels. Besides projecting to the medullary reticular formation (Figs. 3S–X), a smaller input was seen in the rostral and ventrolateral NTS (Figs.3U–W).
3.3 Retrograde cell body labeling experiments
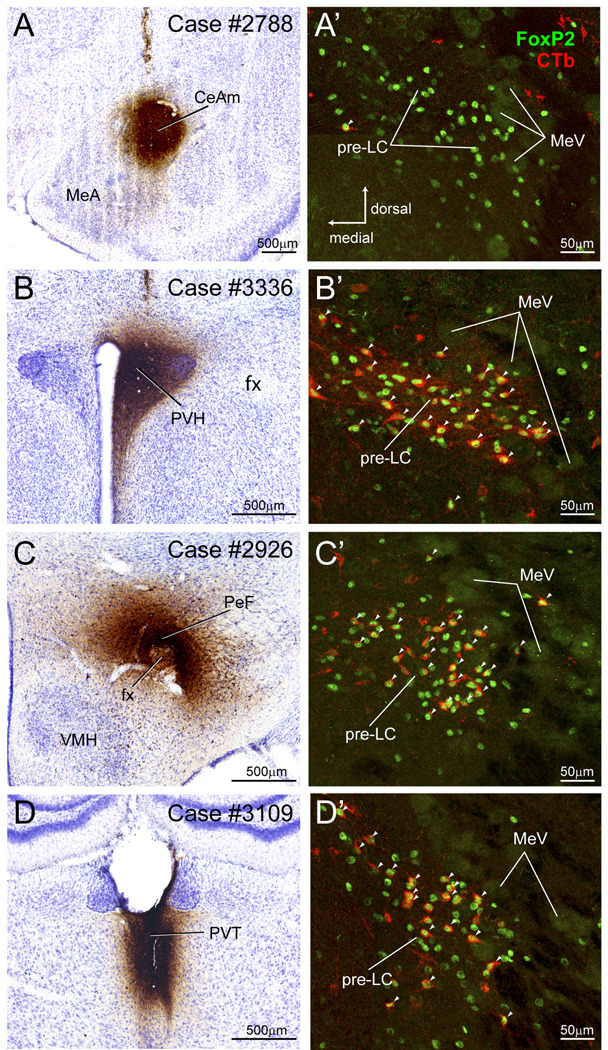
In separate experiments, CTb was injected into 28 different forebrain or midbrain sites that were selected from the PHAL data presented in Figure 3. The purpose of these experiments was to determine whether FoxP2+ neurons of the pre-LC and PBel-inner contributed to these projections. Figure 4 presents the CTb injection sites from four cases, and the accompanying sections through the pre-LC showing CTb and FoxP2+ labeled neurons. Figures 5–15 illustrate the results from 19 of these experiments.
Figure 4.
Four CTb cases used to analyze whether FoxP2+ neurons in the pre-LC and PBel-inner project to the amygdala (A), hypothalamus (B and C), and thalamus (D). A. CTb injection in medial part of the central amygdaloid nucleus (CeAm). A’. FoxP2+ neurons in the pre-LC did not co-label with CTb indicating they do not project to the CeAm. As shown in Fig. 7, CTb labeled neurons were found in the PBel-inner, but none of them were FoxP2+. B. CTb injection in paraventricular hypothalamic nucleus (PVH). B’ Co-labeled CTb and FoxP2+ neurons in the pre-LC (Co-labeled neurons indicated by arrowheads). See Fig. 8B. C. CTb injection in the perifornical hypothalamic region. C’. Co-labeled CTb and FoxP2+ neurons in the pre-LC. See Fig. 9A. D. CTb injection in the paraventricular thalamic nucleus. D’. Co-labeled CTb and FoxP2+ neurons in the pre-LC. See Fig. 11A.
The cell counts presented below regarding the number of co-labeled CTb & FoxP2+ neurons in the pre-LC and PBel-inner provide an approximation of the density of the projections to these various midbrain and forebrain sites. These data were intended to provide a semi-quantitative projection map of these two cell groups (Fig. 16). The pre-LC and PBel-inner numerical counts came from two sections in the 1-in-5 series of sections spaced 250 µm from each other, as shown in Figs. 5–15. The PBel-inner was found somewhat rostral to the pre-LC, and its first section was co-extensive with the caudal part of the inferior colliculus. The pre-LC began approximately 250 µm caudal to this level, so the two cell groups were slightly out of register.
Figure 16.
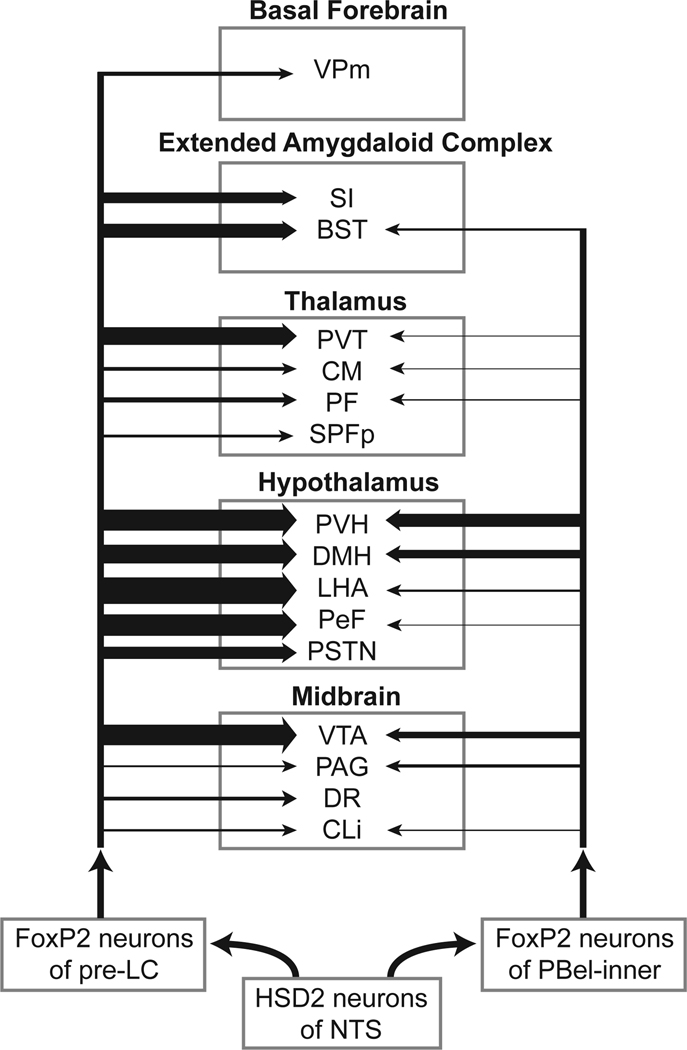
FoxP2+ neurons of the pre-LC and PBel-inner project to midbrain and forebrain sites. The relative strength of each projection is indicated by lines leading to a particular brain structure that has been abbreviated. The strength of the projection is indicated by the line thickness. For the pre-LC experiments, the input to the LHA was the strongest and all the other lines in this chart are represented as a percentage of this line. The numerical data regarding the number of pre-LC and PBel-inner neurons projecting to a particular brain region are presented in the Results section. For the pre-LC projections, the major target is the hypothalamus, which includes five separate nuclei: PVH, DMH, LHA, PeF, and PSTN. FoxP2+ pre-LC neurons also provide strong projections of the PVT and VTA, and moderate inputs to the SI and BST. The VPm also receives a small input from FoxP2+ cells of the pre-LC. FoxP2+ PBel-inner neurons project to many of the same sites as the pre-LC, but in general are weaker. The PVH and DMH are the major sites receiving an input from the PBel-inner. It also provides `a moderate input to the VTA.
3.3.1 Cerebral cortex
Based on the information shown in Figures 3A–D, three cortical areas contained anterograde axonal labeling following a PHAL injection in the pre-LC; these sites were the claustrum, anterior insular cortex (posterior division), and ventral subiculum. Individual CTb experiments were performed targeting each of these sites. None of these experiments resulted in CTb-labeling of the FoxP2+ neurons of the pre-LC and PBel-inner except that in one ventral subiculum case (case #3934), three double-labeled neurons were found in the pre-LC (data not shown).
The CTb injections in the claustrum and anterior insular cortex (posterior division) yielded no co-labeled neurons (FoxP2+ and CTb) in the pre-LC or the PBel-inner. In one claustrum experiment (case #3904), eleven co-labeled neurons were found in the medial PB in the zone between the MeV and the superior cerebellar peduncle (data not shown). A small number of CTb-labeled neurons were found in the PB-el in this case, including one FoxP2+ cell in the PB-el outer division. In insular cortex case #3945, scattered CTb-labeled neurons were distributed in the medial PB, with a few lying in the MeV region (data not shown). The large sensory MeV neurons were not labeled.
As previously mentioned, a CTb injection in the ventral subiculum (case #3934) resulted in three co-labeled cells in the pre-LC and none in the PBel-inner (data not shown). A few CTb and FoxP2+ co-labeled neurons were found in the medial PB in this one-in-five series.
3.3.2 Basal forebrain
The PHAL data presented in Figure 3 show that the pre-LC region projects to several forebrain sites, including the ventral pallidum (VP), bed nucleus of the stria terminalis (BST), and substantia innominata (SI) (Figs. 3C–E), central nucleus of the amygdala (CeA) (Figs. 3H and I), and septum (Figs. 3A–E). CTb experiments were performed to determine whether the FoxP2+ neurons of pre-LC and PBel-inner contribute to these projections.
Figure 5 presents the cell body labeling pattern in the dorsolateral pons in two cases where CTb was injected in different forebrain sites: one in the medial part of the VP and the other in the interstitial nucleus of the posterior limb of the anterior commissure (IPAC). The VP case (#3997) resulted in retrograde labeling in the pre-LC, including co-labeling of a few FoxP2+ neurons (~9 cell bodies) (Fig. 5A). There were also a small number of retrogradely labeled neurons in the lateral and medial PB, but none of the FoxP2+ neurons in PBel-inner were labeled. In the IPAC case (#3991), very few retrogradely labeled neurons were found in the pre-LC region and only two CTb-labeled neurons were FoxP2+ in this subregion. Only one cell body was co-labeled in the PBel-inner. Most of the retrograde cell body labeling was found in the medial PB (Fig. 5B).
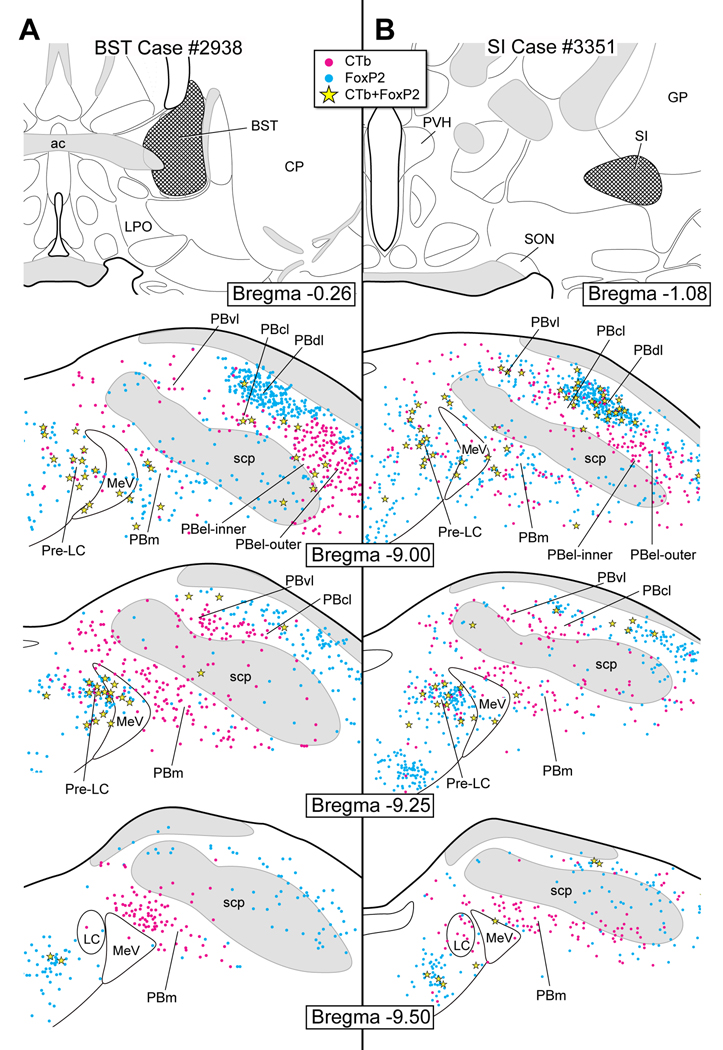
Figure 6 presents two cases with CTb injections in other components of the extended amygdala - the major part of the BST and SI. The CTb injection of case #2938 involved the dorsolateral and ventral BST. The injection included the anterolateral, juxtacapsular, and oval BST subdivisions (Swanson, 1998). It also involved the fusiform and subcommissural subnuclei of the ventrolateral BST (Swanson, 1998). Many FoxP2+ neurons of the pre-LC (viz., 25–30 cells) provided an input to the BST, whereas only a few (5) in the PBel-inner contributed to this projection. As shown in Figure 6B, non-FoxP2 neurons in the PB medial, PB ventral lateral, and PBel-outer also project to the BST. The SI case (#3351) resulted in considerable numbers of co-labeled CTb and FoxP2+ neurons in the pre-LC (~23), but none in the PBel-inner (Fig. 6B). A large number of the FoxP2+ neurons in the dorsal lateral PB were retrogradely labeled. A considerable number of single CTb-labeled neurons were found in the PBel-inner and outer as well as in the medial PB.
Figure 6.
A. CTb injection in the bed nucleus of the stria terminalis (BST). A substantial number of co-labeled neurons were found in the pre-LC and only a few in the PBel-inner. A large number of single CTb neurons were found in the PBel-inner and outer divisions, PBvl, and PBm.
B. CTb injection in the substantia innominata (SI). FoxP2+ neurons neurons in the pre-LC were labeled with CTb, none in the FoxP2+ neurons of the PBel-inner region were labeled. CTb-labeled neurons were distributed in the PBel (inner and outer divisions) and PBvl, and PBm.
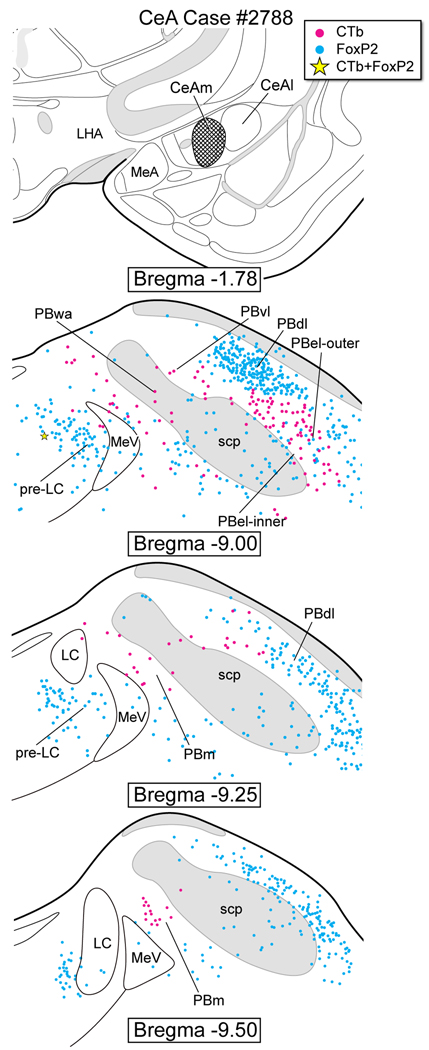
A CTb injection was made in the medial part of the CeA (Fig. 7), the same area where most of the PHAL axonal labeling was localized (cf., Fig. 3H). Case #2788 resulted in retrograde cell body labeling in the PBel-outer with several cells in the PBel-inner. Only one FoxP2+ neuron of the pre-LC was co-labeled; no PBel-inner neurons expressed both FoxP2 and CTb. There were also moderate numbers of single CTb-labeled neurons in the region dorsal to the MeV and PB waist area.
Figure 7.
CTb injection localized in the central nucleus of the amygdala – medial subdivision (CeAm). CTb-labeled neurons were observed in the PBel-inner and outer, PBvl, PBwa, and PBm.
After CTb injections were made in the septum, retrogradely-labeled neurons were observed in the periventricular gray matter region dorsal to the pre-LC region (data not presented). Only one FoxP2+ cell body of the pre-LC was labeled and none in the PBel-inner. Retrogradely labeled neurons, however, were found in the dorsal lateral and medial PB regions, but only a couple of these neurons per section contained FoxP2+.
3.3.3 Diencephalon
3.3.3.1 Hypothalamus
Figures 8–10 are from a series of cases in which CTb was injected into five different hypothalamic nuclei: the dorsomedial (DMH), paraventricular (PVH), perifornical (PeF), lateral (LHA), and parasubthalamic (PSTN) nuclei.
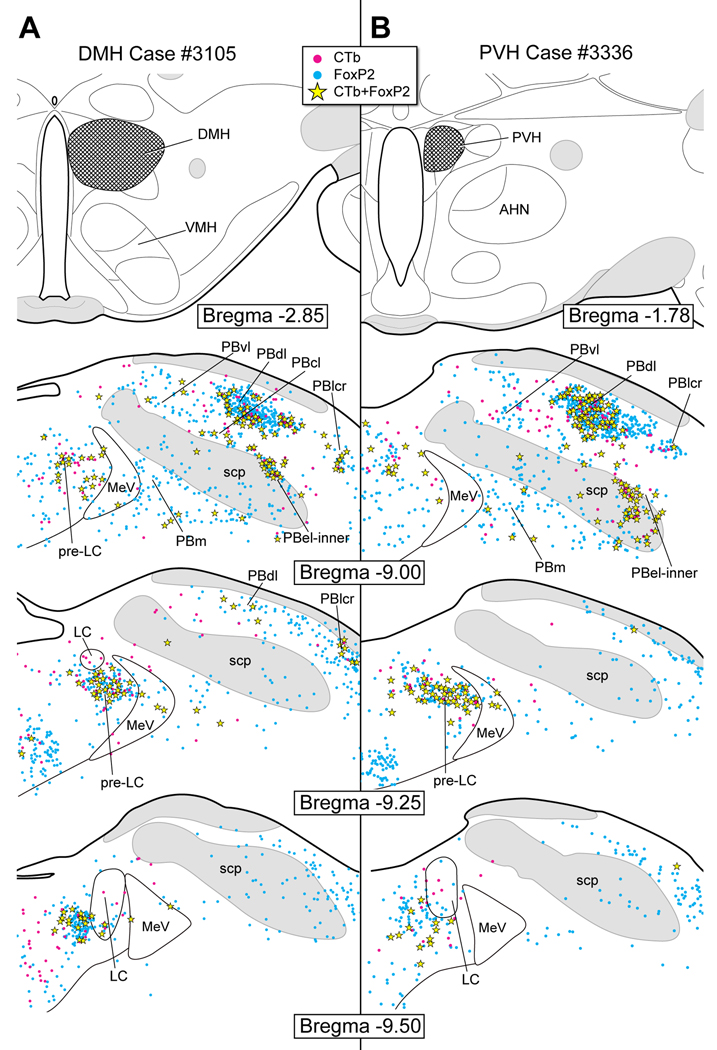
Figure 8.
A. CTb injection in the dorsomedial hypothalamic nucleus (DMH). Co-labeled (FoxP2+ and CTb) neurons were found in the pre-LC and PBel-inner as well as in the PBdl, PBcl, and PBlcr.
B. CTb injection in the paraventricular hypothalamic nucleus (PVH). Large numbers of co-labeled FoxP2+ neurons were present in the pre-LC, PBel-inner, and PBdl. A small number of single CTb-labeled neurons were present in the PBvl.
Figure 10.
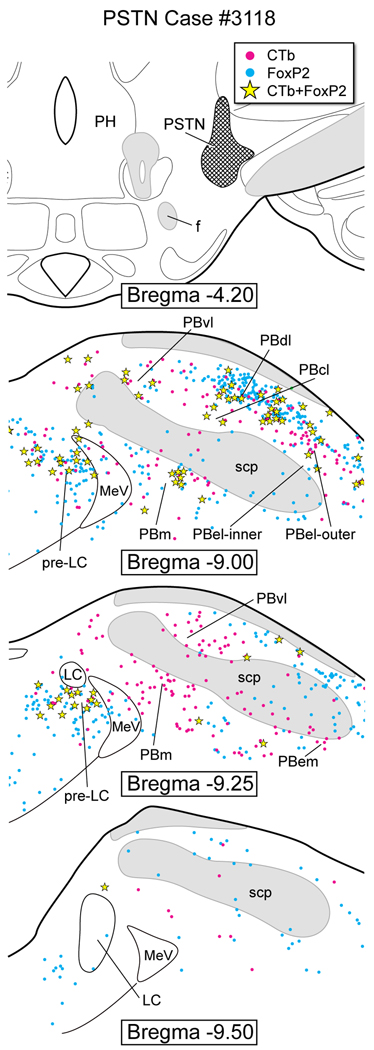
CTb injection in the parasubthalamic nucleus (PSTN). A moderate number of double-labeled (FoxP2+ and CTb) neurons were identified in the pre-LC (~26) and PBdl, but few in the PBel-inner (1–2), PBcl, PBlcr, and PBm. Single CTb-labeled neurons were found in PBvl, PBel-outer, PBem, and PBm.
Figure 8A illustrates the pattern of retrograde cell labeling after a CTb injection in the DMH (case #3105). Numerous co-labeled neurons were identified in the pre-LC (~40), PBel-inner (~18), and the dorsal lateral PB (~33). Occasional co-labeled neurons were localized in the lateral crescent PB region, ventral lateral PB, and central lateral PB.
Figure 8B presents case in which CTb was injected in the PVH (case #3336). Just as we found in the DMH experiment (case #3105), there was a relatively large number of FoxP2+ and CTb co-labeled neurons in the pre-LC (~45) and PBel-inner (~28) as well as in the dorsal lateral PB (~50).
Figure 9A illustrates a case in which CTb was injected into the PeF (case #2926). Whereas many co-labeled neurons were found in the pre-LC (~46), only two were seen in PBel-inner. Like the DMH and PVH cases of Figure 8, a large number of co-labeled neurons were seen in the dorsal lateral PB (~30).
Figure 9B shows a large CTb injection in the LHA (case #3764). In a similar manner as the PeF of Fig. 9A, a relatively large number of co-labeled neurons were found in the pre-LC (~57) and dorsal lateral PB regions (~46), as compared with only a few in the PBel-inner (3–5). This LHA experiment resulted in a considerable number of single CTb-labeled neurons throughout the medial, lateral, and ventral lateral PB subnuclei.
Figure 10 is based on a highly restricted CTb injection in the PSTN of case #3118. This region is also termed the posterolateral hypothalamus (Tsumori et al., 2006), but in the present report we used the terminology of Swanson (Swanson, 1998). This injection resulted in a moderate number of double-labeled neurons in the pre-LC (~26) and only a couple in the PBel-inner.
3.3.3.2 Thalamus
Figures 11 and 12 present four experiments with CTb injections confined to specific midline and intralaminar thalamic nuclei; these include the paraventricular (PVT), central median (CM), parafascicular (PF), and subparafascicular parvicellular part (SPFp) thalamic nuclei.
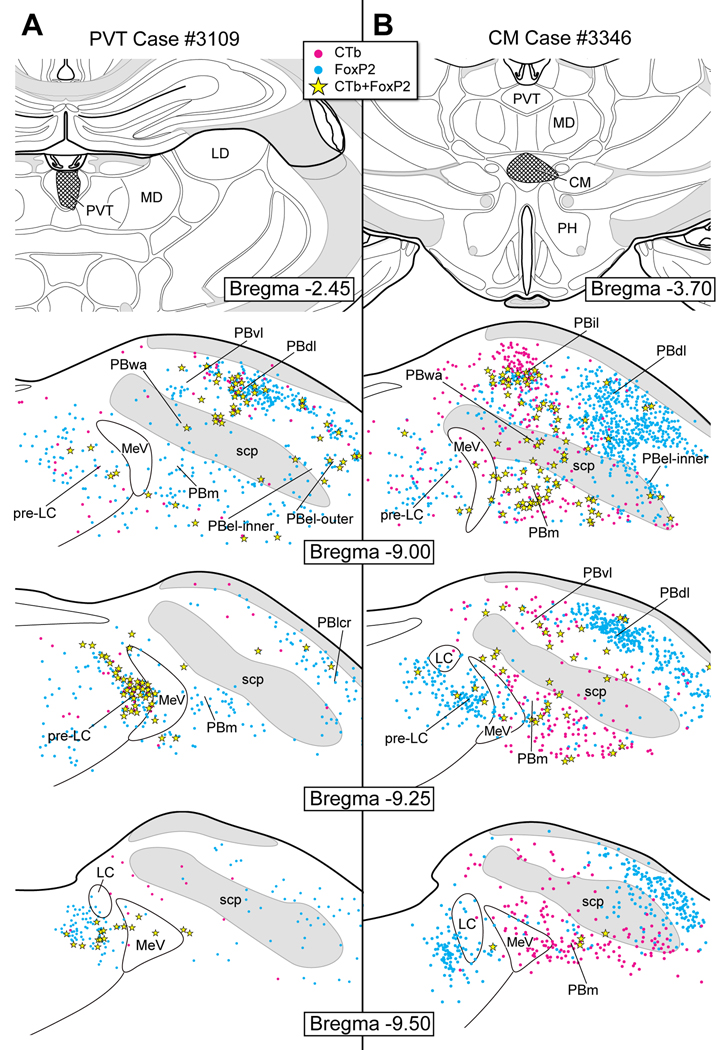
Figure 11.
A. CTb injection in the paraventricular thalamic nucleus (PVT). A moderate number of co-labeled (FoxP2+ and CTb) neurons were found in the pre-LC and PBdl, with only two in the PBel-inner region.
B. CTb injection in the central medial thalamic nucleus (CM). Few co-labeled neurons were found in the pre-LC, PBel-inner, PBdl, PBvl, PBwa, and PBm. A large number of co-labeled cells were located in PBil, PBm and PBvl as well. Single-labeled CTb neurons were observed in the PBm and PBvl.
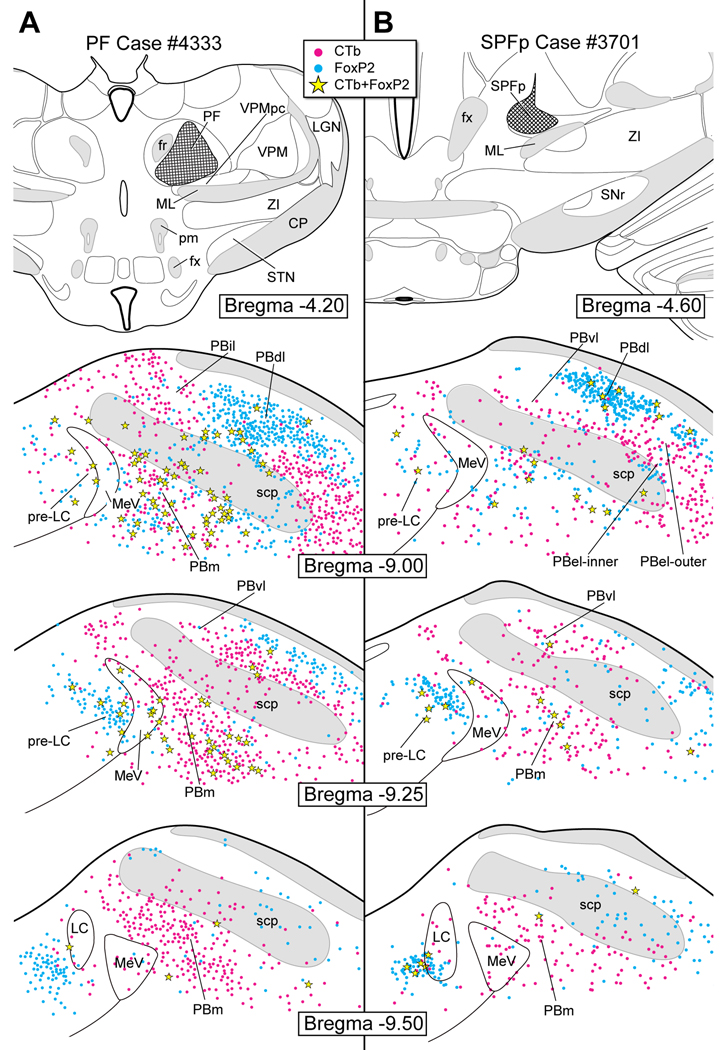
Figure 12.
A: CTb injection in the parafascicular thalamic nucleus (PF). Few co-labeled neurons were found in the pre-LC and the PBel-inner. Numerous single CTb labeled neurons were found in PBvl, PB-el, PBem, and PBm as well as in the region dorsomedial to the superior cerebellar peduncle. B: CTb injection in the subparafascicular thalamic nucleus- parvicellular part (SPFp). Co-labeled FoxP2+ neurons were found in the pre-LC, but none in the PBel-inner.
Figure 11A shows the distribution of retrograde cell body labeling following a small CTb injection in the PVT (case #3109). A prominent number of co-labeled neurons were found in the pre-LC (~38) and dorsal lateral PB (~18), but only two were found in the PBel-inner. The labeling of FoxP2+ neurons was particularly prominent in this PVT case because the overall number of single CTb neurons was relatively small, as compared to other cases involving other midline thalamic areas. For example, the CM case #3346 (Fig. 11B) had extensive retrograde cell body labeling in the medial and lateral PB subnuclei, including co-labeled FoxP2+ cells. This case contained only moderate numbers of co-labeled neurons in the pre-LC (~8) and two in the PBel-inner, although greater amounts were seen in the ventral lateral and rostral medial PB subnuclei.
Figure 12A is based on a case in which CTb was injected into the PF (case #4333). There were eleven co-labeled neurons in the pre-LC, and three in the PBel-inner. Overall, a very large number of CTb-labeled neurons were found throughout the entire PB complex, with significant numbers of co-labeling rostrally in the medial subdivision.
Figure 12B shows case #3701 where CTb was injected into the SPFp. A few co-labeled neurons were found in the pre-LC (~6), and none in the PBel-inner. Just like the previous case, there were considerable numbers of CTb-labeled neurons throughout the PB.
3.3.3.3 Midbrain
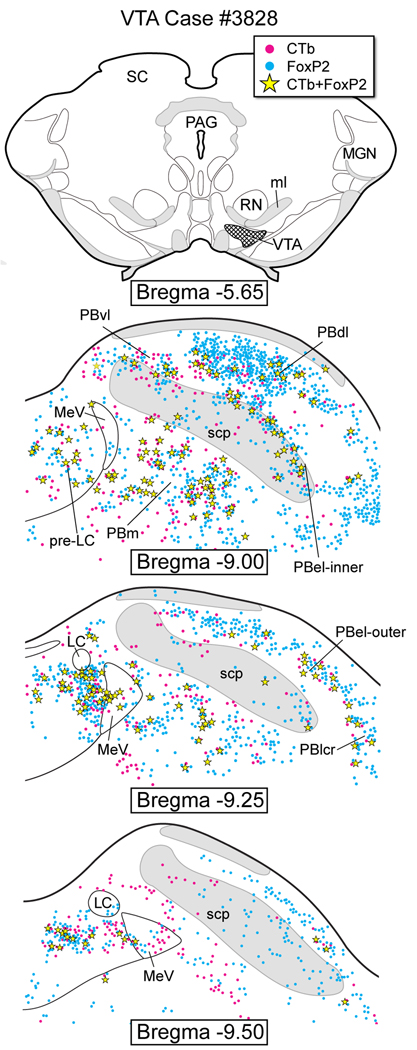
Figure 13 presents data from case #3828 in which CTb was injected into the ventral tegmental area (VTA). The VTA is one of the regions receiving a very dense input from the pre-LC (Fig. 3N). Co-labeled neurons were found in the pre-LC (~44) and PBel-inner (~14). Co-labeled neurons were also found in the medial, ventral lateral, dorsal lateral, and lateral crescent PB areas.
Figure 13.
CTb injection in the ventral tegmental area (VTA). Numerous co-labeled neurons were found in the pre-LC, PBel-inner, and PBm. Single CTb-labeled neurons were observed in the PBvl, PBdl, and PBm.
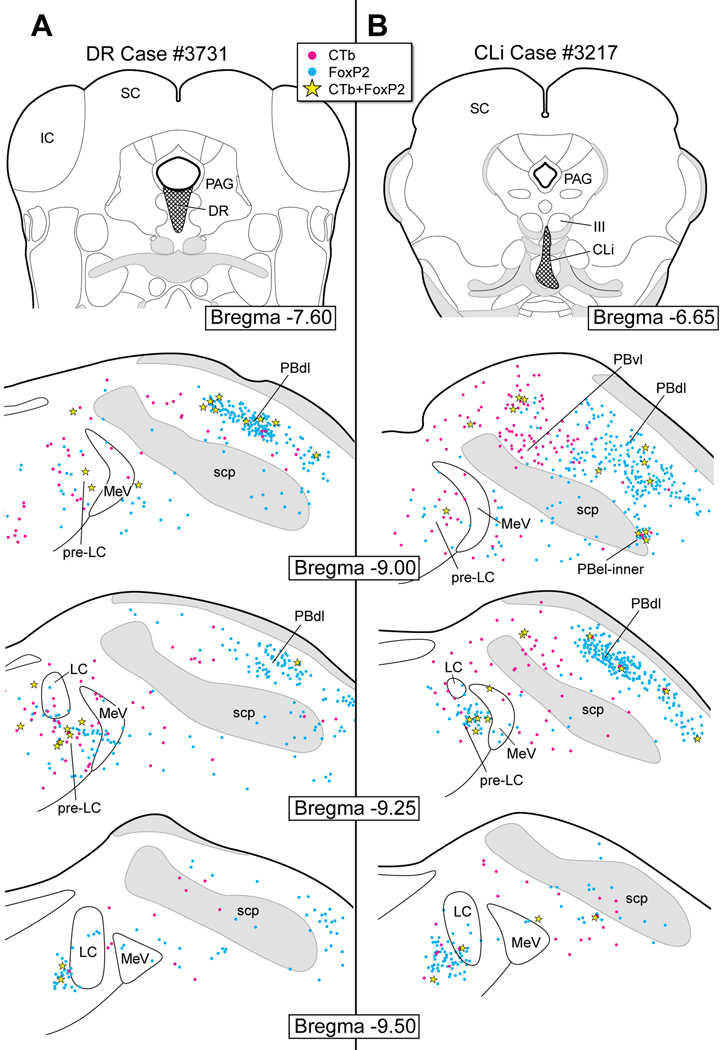
Figure 14 illustrates the neuronal labeling in the pre-LC and PB regions following CTb injections into the midbrain raphe system. In the dorsal raphe (DR) case #3731 (Fig. 14A), only a small number of FoxP2+ neurons originating from the pre-LC (~8) project to the DR. None of the FoxP2+ neurons in the PBel-inner subnucleus contribute to this projection. As shown in Figure 14B, the inputs to the central linear raphe nucleus (CLi) (case #3217) were similar to those seen in the DR case (Fig. 14A). Few double-labeled neurons in the pre-LC (~5) projected to the CLi and three FoxP2+ neurons of the PBel-inner region contributed to this projection. In both experiments, most of the FoxP2+ neurons that project to the midbrain raphe nuclei originate from the PB dorsal lateral subnucleus, and this projection is relatively weak as compared with other cases in this study.
Figure 14.
A. CTb injection in the dorsal raphe nucleus (DR). A few co-labeled neurons were found in the pre-LC and PBdl. None were observed in the PBel-inner.
B. CTb injection in the central linear raphe nucleus (CLi). A few co-labeled neurons were found in the pre-LC, PBel-inner, and PBdl. Single CTb labeled neurons were seen in the PBvl and dorsomedial to the superior cerebellar peduncle.
Figure 15 shows the pre-LC and PB cell body labeling that resulted after CTb injections were made in the dorsolateral (case #3833) and ventrolateral (case #3242) subdivisions of the PAG. Few co-labeled neurons were found in the pre-LC (4 for both) or PBel-inner (4 and 7, respectively). For the ventrolateral PAG, in particular, co-labeled neurons were found in ventral lateral, dorsal lateral, and central lateral PB subnuclei (Fig. 14B).
4. Discussion
The FoxP2+ neurons of the pre-LC and PBel-inner cell groups represent the third-order neurons within an ascending viscerosensory chain of neurons that carries information related to systemic sodium depletion to forebrain sites. This pathway utilizes two different afferent systems: neural and chemosensitive. One part of this sodium-sensing pathway originates from the nodose ganglion neurons which carry vagal afferent fibers from the upper gastrointestinal tract to the first-order HSD2 neurons of the NTS (Shin and Loewy, 2009); the nodose ganglion cells represent one group of 1st-order neurons. The other afferent limb depends on the chemosensitive system which is made up of neurons in the area postrema that sense blood-borne solutes and peptides and convert these chemical signals into neural information. AP neurons project to the HSD2 neurons of the NTS (Sequeira et al., 2006) as well as to the FoxP2+ neurons in the pre-LC and PBel-inner (Stein and Loewy, 2010). Thus, the AP neurons represent a second group of 1st-order neurons even though they reside within the brain. Because the HSD2 neurons (2nd-order) project to the pre-LC and PBel-inner, we defined the two latter groups as the 3rd-order neurons. This scheme is complicated because theAP neurons also project directly to the pre-LC and PBel-inner (Stein and Loewy, 2010). The focus of the present study has been the 3rd-order neurons of this sodium-sensing pathway. A summary of the higher-level projections of the FoxP2+ neurons of the pre-LC and PBel-inner is illustrated in Figure 16.
The ‘sodium need’ projection system, which transmits information regarding sodium depletion, is different than the gustatory pathway. While neurons for both pathways lie in the NTS, they originate from different subnuclei and target separate sites in the parabrachial nucleus, thalamus and hypothalamus. Sodium-sensing HSD2 neurons project to the pre-LC and PBel-inner, whereas the sodium-taste NTS neurons project to the medial PB, PB waist area, and dorsal lateral PB (Yamamoto et al., 2009). These two sodium-sensing pathways also have unique projections to the thalamus: the pre-LC projects to midline and intralaminar thalamic nuclei, whereas the PB taste area (PBm) innervates the thalamic gustatory nucleus (ventral posterior medial thalamic nucleus, parvicellular region -VPMpc). In the hypothalamus, the pre-LC sends strong projections to the PVH, DMH, PeF, LHA, and PSTN, whereas the only hypothalamic site receiving an input from the gustatory system is the PSTN (Karimnamazi and Travers, 1998). Whether the PSTN is a site of convergence for these two ascending systems has not been examined.
The present paper, along with a previous study from our laboratory describing the efferent projections of the HSD2 neurons (Geerling and Loewy, 2006), define the axonal projections originating from functionally- and chemically-defined brainstem neurons; all three groups of neurons (HSD2 of the NTS and FoxP2+ of the pre-LC and PBel-inner) become Fos-activated during sodium depletion (Geerling et al., 2006, Geerling et al., 2011).
Previous studies designed to localize areas of the brain involved in sodium homeostasis have depended on lesions or microinjections with various pharmacological agents in presumed nodal points within the sodium-regulating circuits – for example, see (Wolf, 1967, Wolf et al., 1970, Zardetto-Smith et al., 1994, Lucas et al., 2007) as well as other studies cited in our review (Geerling and Loewy, 2008). The previous studies were quite limited because the selection of various brain sites represented guesswork. No previous neuroanatomical studies existed to support the rationale for selecting these particular sites, although some of the studies selected sites now known to be important such as the LHA. Also, questions can be raised about the various the lesion experiments that have been published because they relied techniques that destroyed both cell bodies and fibers-of-passage, so the accuracy of these results remains been questionable.
One observation of particular importance was the report by Grill and colleagues (Grill et al., 1986). They showed that the behavioral aspects of sodium homeostasis could not be maintained in chronic decerebrate rats – indicating that the key neural machinery for salt appetite resides in the forebrain. The following discussion will consider selected regions of the forebrain and their role in sodium appetite.
4.1 The pre-LC projects to a thalamic site potentially involved in foraging behavior
Sodium depletion is a powerful stimulus that results in an intensive search for salt in land-based vertebrates, but to our knowledge the underlying neural circuitry for this behavior has not been studied. Based on the neuroanatomical findings presented here, we hypothesize that the pre-LC→PF projection, in particular, may be an instrumental pathway affecting this behavior because the only regions of the forebrain implicated in motor functions that receives an input from the pre-LC is the PF. As shown in Figures 3K–M, the pre-LC region projects heavily to the PF, and part of this input arises from the FoxP2+ neurons (Fig. 12A). The PBel-inner subnucleus projects to the PF as well, with only a scant contribution from the FoxP2+ neurons (Fig. 12A). The PF projects to other CNS sites involved in motor processing; these include the subthalamic nucleus, caudate-putamen, globus pallidus, as well as to the primary and secondary motor cortices and somatosensory cortex (Berendse and Groenewegen, 1990, 1991, Van der Werf et al., 2002).
Alternate pathways controlling foraging behavior may exist, and one of them may include the pre-LC projection to the deep part of the mesencephalic reticular formation (MeRF-deep). The MeRF-deep region has been implicated in gaze-related functions (Warren et al., 2008, Perkins et al., 2009). It receives inputs from the superior colliculus which functions to direct eye and neck movements towards objects in the visual field, and also sends outputs to the cervical spinal cord where it controls neck motor activity (Warren et al., 2008, Perkins et al., 2009). Because foraging behavior is dependent on coordinated eye-motor activity, it is not surprising that bilateral electrolytic lesions of the MeRF result in a large reduction in sodium chloride intake (Charaviglio, 1972). An alternative explanation is that these lesions simply destroyed the axons originating from the viscerosensory and gustatory neurons in the pons and medulla, which transverse this region as they course to their target sites in the diencephalon and extended amygdala (Figure 3).
4.2 The pre-LC projects to the reward system
Two areas in the ventral striatum - nucleus accumbens (NAc) and ventral pallidum (VP), along with a midbrain area - the ventral tegmental area (VTA) - have been implicated in the hedonic aspects of food intake, alcohol consumption, and drug addiction (Feltenstein and See, 2008, Soderpalm et al., 2009, Miner et al., 2010). The dopamine-containing neurons of the VTA are part of the reward system, and they project to the NAc and VP; this system has been termed the dopamine mesolimbic pathway (Sesack and Grace, 2010), and several recent reviews have been published on this subject (Saper et al., 2002, Voorn et al., 2004, Pecina et al., 2006, Fields et al., 2007, Smith et al., 2009, Sesack and Grace, 2010, Zellner and Ranaldi, 2010). The discussion presented below focuses on the role of nodal points in this pathway and their potential involvement in sodium appetite. While this discussion remains speculative, it is included here because it may be useful for future studies dealing with the hedonic aspects of salt consumption.
4.2.1 Nucleus accumbens
The present experiments failed to establish a direct input from the pre-LC to the NAc (Figs. 3A–C), but a previous viral tracing study demonstrated that four key brainstem sites that have been implicated in sodium appetite (viz., pre-LC, PBel-inner, HSD2 neurons of the NTS, and area postrema) form a multisynaptic projection that targets the NAc (Shekhtman et al., 2007). Earlier we postulated that the PVT may be a critical relay in this pathway, and show here that the pre-LC provides a dense input to the PVT (Fig. 3F–K). The FoxP2+ pre-LC neurons contribute to this projection, with lesser amounts originating from FoxP2+ neurons of the PBel-inner (Fig. 11A). The PVT projects mainly to the NAc-shell (Berendse and Groenewegen, 1990, Moga et al., 1995, Vertes and Hoover, 2008), with a weaker input to the NAc-core (Van der Werf et al., 2002, Vertes and Hoover, 2008). Because reciprocal connections between the NAc-core and NAc-shell exist (Heimer et al., 1991, van Dongen et al., 2005), the pre-LC may influence the entire NA. Another potential route in which the pre-LC could influence NAc activity is via a linkage through the VTA, and this is discussed below.
Functional changes occur in the NAc following the ingestion of sodium (Hajnal and Norgren, 2001, Zhang and Kelley, 2002, Hajnal et al., 2004, Hajnal and Norgren, 2005, Voorhies and Bernstein, 2006, Lucas et al., 2007, Na et al., 2007). The NAc-shell region becomes c-Fos activated when sodium-depleted rats ingest salt, and this occurs only when post-ingestive feedback signals are removed as demonstrated in rats with gastric fistulas which allow ingested saline to drain immediately from the stomach to the exterior body wall (Voorhies and Bernstein, 2006).
Two other publications examine the issue of whether the NAc is involved in sodium intake and these are based on pharmacological experiments. The first report found that when the mu opioid agonist, D-Ala2, NMe-Phe4,Glyol5-enkephalin (DAMGO) was injected into the NAc, it caused an increase in salt intake in non-deprived rats, and had no effect on water consumption (Zhang and Kelley, 2002). The second study reported that when dopamine receptor blockers or agonists are infused into the NAc-shell, these drugs had no effect on salt intake (Lucas et al., 2007).
4.2.2 Ventral pallidum
VP neurons show very low activity levels during sodium ingestion in salt-replete rats, but when similar recordings were made in sodium-depleted rats, large increases in neural activity were found similar to the neural activity seen during sucrose ingestion, which is an extremely pleasureful taste for rats (Tindell et al., 2006). Under the sodium-depleted conditions, rats will ingest 1.5 M NaCl, which is three times stronger than seawater, and this aversive taste becomes converted into a pleasant one. This switching phenomenon appears to measure the hedonic value of a given taste for a particular momentary need of the animal (Tindell et al., 2006).
CTb injections in the medial VP, as shown here in Figure 5A, result in retrograde cell body labeling in the PB, including the area dorsal to the superior cerebellar peduncle, medial PB, PBel-inner, and neurons embedded in the superior cerebellar peduncle. Previous work has suggested that these PB areas are involved in gustatory functions (Yamamoto et al., 1994). Te FoxP2+ neurons in the pre-LC also project to the VP, and while we have assumed that these neurons only transmit information related to sodium depletion, no information exists on whether other visceral modalities are sensed by these neurons.
4.2.3 Ventral tegmental area
Does the VTA play a role in salt appetite regulation? The anatomical experiments presented in this study show that the FoxP2+ neurons in both the pre-LC and PBel-inner project directly to the VTA (see Fig. 13). Elements of the PB gustatory nuclei, including the medial, dorsal lateral and waist area PB subdivisions, also project to the VTA as well.
A word of caution should be noted regarding this experiment, and that is, we have assumed that the retrograde neuronal labeling seen in the pre-LC and parabrachial region is due to uptake of CTb by axon terminals. As shown in Figs. 3 J–M, there is a dense axonal projection that courses to and rostral to the VTA region (Fig. 3N) into the PSTN and lateral hypothalamic area. Thus, some of the labeling could be due to CTb being taken up by fibers-of-passage that were destined for the hypothalamus.
In the first published report on this subject, large electrolytic lesions in the VTA in rats were found not to impair sodium intake (Wolf, 1967), and because the full extent of the lesions were not presented, it is impossible to determine whether the VTA was completely destroyed. Forty years later, Shibata and co-workers injected the neurotoxin 6-hydroxydopamine into the VTA of rats in order to selectively destroy its dopaminergic neurons. These lesions caused a reduction in sucrose intake, but did not affect the sodium chloride ingestion (Shibata et al., 2009). Unfortunately, these experiments only involved baseline salt ingestion, and did not test intake after sodium deprivation; also, because only 50% of the dopaminergic neurons were destroyed, the surviving dopaminergic neurons may have been sufficient to permit normal sodium intake to continue.
A third study evaluated the local actions of microinjected opioid drugs in the VTA on salt appetite (Lucas et al., 2007). Infusion of the delta opioid receptor blocker – naltrindole into the VTA attenuated salt intake, whereas the delta opioid agonist [D-Ser2, Leu5, Thr6]-enkephalin had no effect. In contrast, when rats were first primed to crave salt by pretreatment with the diuretic furosemide (Lasix), VTA injections of [D-Ser2, Leu5, Thr6]-enkephalin augmented salt intake. Thus, opioids act in the VTA to facilitate salt intake behavior, but the origin of the inputs and their specific post-synaptic targets remain unknown.
4.3 The pre-LC projects to hypothalamic sites involved in the homeostatic aspects of food intake
Figure 16 demonstrates the extremely large contribution that the FoxP2+ neurons of the pre-LC and PBel-inner make to the innervation of the hypothalamus, which greatly exceeds any other forebrain and midbrain targets. Very dense projections from the pre-LC target the PVH, DMH, LHA, PeF, and PSTN. For the PBel-inner neurons, the main hypothalamic targets were the PVH and DMH, with weaker projections to the LHA and PeF.
The central pathways involved in food intake have been summarized by Saper and colleagues (Saper et al., 2002), and there are many similarities between those circuits and these shown here. For example, the ascending brainstem projections from the NTS and PB involved in food intake target the PVH, DMH, and LHA, and we found similar results here with the addition that both the PeF and PSTN may also be involved in salt ingestion. This food intake system, just like the pathways regulating sodium intake, maintains homeostasis and also sends additional axonal linkages to the reward system.
4.4 The pre-LC projects to thalamic sites involved in viscerolimbic and motor functions
FoxP2+ neurons in the pre-LC innervate two midline thalamic nuclei: PVT and CM, as well as two intralaminar thalamic cell groups: PF and subparafascicular thalamic nucleus, parvicellular region (SPFp).
Earlier work from our laboratory analyzed the cell groups in the PB and nearby periventricular gray matter that project to these midline and intralaminar thalamic nuclei using the retrograde tracer CTb (Krout and Loewy, 2000). With our growing awareness of the existence of a unique group of neurons that lies rostral to the locus coeruleus (LC) that is now called the pre-LC (Fig. 1), it is now apparent to us that some of the areas we originally labeled “LC” in the Krout and Loewy (2000) publication in the rostral PB levels (viz., bregma −8.7 and −9.2 mm levels) are, in fact, the pre-LC. Clearly, our earlier work demonstrated that the pre-LC projects to midline thalamic cell groups including the PVT, CM, and nucleus reuniens, as well as to two intralaminar thalamic cell groups, namely the PF and ventromedial thalamic nucleus – caudal part (VMc). When CTb was injected in the thalamic taste region, viz., ventral posterior thalamic nucleus, parvicellular part (VPMpc), a considerable amount of retrograde neuronal labeling was found in the medial PB, ventral lateral PB, and PB waist area (see Fig. 8B of Krout and Loewy, 2000), but none was found in the pre-LC region. While negative evidence is always problematic, the pre-LC does not appear to be linked to the key thalamic site involved in taste.
The pre-LC innervates several midline and intralaminar thalamic nuclei which project to the prefrontal and frontal regions of the cerebral cortex (Berendse and Groenewegen, 1991). The FoxP2+ neurons of the PBel-inner provided only a very weak input to the PVT and almost no innervation to other thalamic sites (Figs. 11 & 12). In contrast, the PB medial, including some of its FoxP2+ neurons, project to CM, SPFp, and PF (Figs. 11 & 12)
Just how these projections affect salt appetite is uncertain. While it may be assumed that thalamic→cortical projections play a role in salt appetite, the data regarding the cortical regulation of salt intake is not strong. Extensive lesions of the cerebral cortex do not reduce salt intake in a major way (Wolf et al., 1970). Clearly, the gustatory region of the cerebral cortex is not essential for basic regulation of sodium intake (Wolf et al., 1970). Later work showed that electrical stimulation of the pre-limbic cortex in awake rats caused an increase in sodium consumption, whereas stimulation of the anterior or ventral parts of the cingulate cortex resulted in a decrease in salt intake (Chiaraviglio, 1984). These areas modulate sodium intake, but are not part of the critical neural machinery controlling sodium appetite.
Finally, the pre-LC projects to the subparafascicular thalamic nucleus, parvicellular region (SPFp). Relatively little is known about this posterior intralaminar thalamic nucleus, except it has been implicated in sexual behavior (Coolen et al., 1996). The SPFp receives inputs from a wide range of sites in the brain and spinal cord, including the NTS, parabrachial region, and pre-LC (see Fig 6A and D in (Coolen et al., 2003)). The outputs of the SPFp have not yet been analyzed (Groenewegen and Witter, 2004). However, the afferent and efferent connections of the nearby SPF has been studied, and the SPF contains a subset of neurons that express a novel peptide termed - tuberinfudibular peptide containing 39 residues -- abbreviated as TIP39 (Wang et al., 2006b, a). This group of neurons appears to lie medial to the SPFp as identified here, and no information currently exists on the function of the SPFp in sodium appetite.
4.5 The pre-LC projects to the extended amygdaloid complex
The pre-LC projects extensively to the BST and SI, but not to the CeA, and the role that these nuclei, which form the extended amygdaloid complex, play in salt appetite regulation has been reviewed (Geerling and Loewy, 2008). Large lesions in the BST reduce sodium intake (Reilly et al., 1994, Zardetto-Smith et al., 1994). To our knowledge, no comparable studies have been completed for the SI. The region lying lateral to the pre-LC provides a weak projection to the medial part of the CeA, and as illustrated in Figure 7, this originates mainly from neurons in the nearby medial PB and not the pre-LC per se.
4.6 The pre-LC projects to central sites potentially involved in regulation of cardiosympathic functions
Basal sympathetic tone and critical cardiosympathetic reflexes are dependent on neurons in the rostral ventrolateral medulla (RVLM) (Guyenet, 2006, Stocker et al., 2010). The RVLM neurons project to the spinal cord, terminate on the sympathetic preganglionic neurons, and thus, modulate regional sympathetic outflow systems affecting a variety of end organs, including the heart and kidney as well as the vascular supply to different body regions such as the gastrointestinal tract. This central sympathetic system can be modulated by numerous feedback signals and in select groups of humans and animals that are ‘salt-sensitive’, increases in dietary salt intake alters the excitability of their central sympathetic networks leading to hypertension (Stocker et al., 2010). In non-salt sensitive humans or rats, excessive dietary salt intake does not affect cardiosympathetic functions, potentially due to numerous compensatory feedback systems that adjust blood pressure and heart rate within a normal range. While states of sodium depletion are detected in the brainstem (Geerling et al., 2006, Geerling and Loewy, 2007), it is still unclear whether increases in dietary sodium intake are detected as well. Thus, it still remains uncertain whether the HSD2, pre-LC, or PBel-inner neurons modulate central sympathetic networks.
The anatomical studies shown here present new information on how the pre-LC could potentially influence the brain sites involved in cardiosympathetic functions. As shown in Figure 3, the key cardiovascular regulatory site of the medulla, which is the RVLM, is devoid of labeling and thus, the pre-LC does not directly modulate neurons in this region. However, other central sympathetic regulatory sites may be influenced by the pre-LC, especially those in the hypothalamus where the PVH, DMH, and LHA receive heavy inputs from the pre-LC. All of these hypothalamic sites contribute to multisynaptic, descending pathways that are linked to a range of different sympathetic outflow systems (Westerhaus and Loewy, 1999). At this time, however, it is uncertain whether the pre-LC → hypothalamic projections establish synaptic connections with any of these hypothalamic pre-motor sympathetic-related neurons. Finally, the pre-LC projects to the BST and SI – which are part of the extended amygdaloid complex- and these cell groups provide multisynaptic connections to different sympathetic outflows (Westerhaus and Loewy, 1999). This may be another level in the neuraxis where the pre-LC or PBel-inner neurons could modulate central sympathetic networks.
5. Conclusions
FoxP2+ neurons in the pre-LC and PBel-inner project to a number of higher-level brain regions, including the basal forebrain, extended amygdaloid complex, thalamus, hypothalamus, and midbrain. The densest projection was to the hypothalamus. The neuroanatomical framework presented here may be important for future work directed at studying individual components related to salt appetite, which include foraging, hedonic effects, homeostatic activities, and potentially the interface between salt balance and cardiosympathetic functions.
Highlight.
The transcription factor FoxP2 is found in salt-sensitive brainstem neurons.
These neurons are localized in the pre-locus coeruleus and parabrachial nucleus.
Their outputs target the basal forebrain, extended amygdala, and diencephalon.
The densest projection was to the hypothalamus.
These data provide a neuroanatomical framework for studying salt appetite.
ACKNOWLEDGMENTS
We thank Xay van Nguygen for excellent technical assistance, Marcy Hartstein for the computer graphics, and Dennis Oakley for help with the confocal microscopy.
Grant sponsor
National Heart, Lung, and Blood Institute of the National Institutes of Health - Grant number: HL025449, Bakewell Imaging Center Fund, and National Institutes of Health - Grant number: NS057105 Neuroscience Blueprint Core Grant.
ABBREVIATIONS
- 3V
third ventricle
- III
oculomotor nucleus
- VIIn
facial nerve
- VIIIn
vestibulocochlear nerve
- XII
hypoglossal nucleus
- ac
anterior commissure
- AD
anterodorsal thalamic nucleus
- AP
area postrema
- AHN
anterior hypothalamic nucleus
- AIp
agranular insular cortex, posterior part
- Aq
cerebral aqueduct
- BLAp
basolateral nucleus of the amygdala, posterior part
- BMA
basomedial nucleus of the amygdala
- BSTa
bed nucleus of the stria terminalis-anterior region
- BSTdl
bed nucleus of the stria terminalis-dorsolateral region
- BSTvl
bed nucleus of the stria terminalis-ventrolateral region
- CA1
CA1 region of hippocampus
- CeA
central nucleus of the amygdala
- CeAl
central nucleus of the amygdala-lateral subdivision
- CeAm
central nucleus of the amygdala-medial subdivision
- Cla
claustrum
- CLi
central linear raphe nucleus
- CM
central medial thalamic nucleus
- Com
commissural nucleus
- CS
central superior raphe nucleus
- Cu
cuneate nucleus
- CUN
cuneiform nucleus
- DMH
dorsomedial hypothalamic nucleus
- DMX
dorsal vagal nucleus
- DR
dorsal raphe nucleus
- DTN
dorsal tegmental nucleus
- EPd
endopiriform nucleus, dorsal part
- FN
facial nucleus
- fx
fornix
- GP
globus pallidus
- Gr
gracile nucleus
- ic
internal capsule
- IC
inferior colliculus
- icp
inferior cerebellar peduncle
- IMD
intermediodorsal thalamic nucleus
- IPAC
interstitial nucleus of the posterior limb of the anterior commissure
- LA
lateral nucleus of the amygdala
- LC
locus coeruleus
- LD
lateral dorsal thalamic nucleus
- LGN
lateral geniculate nucleus
- LDT
laterodorsal tegmental nucleus
- LHA
lateral hypothalamic area
- LPO
lateral preoptic nucleus
- LS
lateral septum
- LSi
lateral septum, intermediate part
- LV
lateral ventricle
- LVe
lateral vestibular nucleus
- MeA
medial nucleus of the amygdala
- MeRF-deep
mesencephalic reticular formation, deep portion
- MeRF-vl
mesencephalic reticular formation, ventrolateral portion
- MeV
mesencephalic nucleus of the trigeminal nerve
- MGN
medial geniculate nucleus
- ml
medial lemniscus
- MnPO
median preoptic nucleus
- MoV
motor trigeminal nucleus
- MS
medial septum
- mtt
mammillothalamic tract
- mtV
tract of the mesencephalic trigeminal nucleus
- NAc-core
nucleus accumbens, core region
- NAc-shell
nucleus accumbens, shell region
- NDB
nucleus of the diagonal band
- NTS
nucleus of the solitary tract
- OVLT
organum vasculosum of the lamina terminalis
- PAG
periaqueductal gray matter
- PBcl
parabrachial nucleus, central lateral subnucleus
- PBel
parabrachial nucleus, external lateral subnucleus
- PBel-inner
parabrachial nucleus, external lateral subnucleus – inner portion
- PBil
parabrachial nucleus, internal lateral subnucleus
- PBl
parabrachial nucleus, lateral region
- PBlcr
parabrachial nucleus, lateral crescent subnucleus
- PBvl
parabrachial nucleus, ventral lateral subnucleus
- PBwa
parabrachial nucleus, waist area
- pc
posterior commissure
- PeF
perifornical hypothalamic region
- PF
parafascicular thalamic nucleus
- PMv
premammillary nucleus, ventral part
- PPN
peripeduncular nucleus
- pre-LC
pre-locus coeruleus nucleus
- PSTN
parasubthalamic nucleus
- Pr
prepositius nucleus
- PSV
principal sensory trigeminal nucleus
- PVG
periventricular gray matter
- PVH
paraventricular hypothalamic nucleus
- PVHa
paraventricular hypothalamic nucleus, anterior part
- PVT
paraventricular thalamic nucleus
- Re
reuniens thalamic nucleus
- RLi
rostral linear raphe nucleus
- RM
raphe magnus nucleus
- RN
red nucleus
- RR
mesencephalic reticular nucleus, retrorubral part
- SC
superior colliculus
- scp
superior cerebellar peduncle
- SFO
subfornical organ
- SHi
septohippocampal nucleus
- SI
substantia innominata
- sm
stria medullaris
- SNc
substantia nigra, pars compacta
- SNr
substantia nigra, pars reticulata
- SO
superior olivary nucleus
- SON
supraoptic nucleus
- SPFp
subparafascicular thalamic nucleus, parvicellular region
- SPIV
spinal vestibular nucleus
- SpV
spinal sensory nucleus of the trigeminal nerve
- st
stria terminalis
- STN
subthalamic nucleus
- SUBv
ventral subiculum
- TR
postpiriform transition area
- VA/VL
ventral anterior lateral thalamic nucleus
- VMH
ventromedial hypothalamic nucleus
- VPm
ventral pallidum, medial part
- VPMpc
ventral posteriomedial thalamic nucleus, parvicellular region
- VTA
ventral tegmental area
- ZI
zona incerta
Footnotes
Publisher's Disclaimer: This is a PDF file of an unedited manuscript that has been accepted for publication. As a service to our customers we are providing this early version of the manuscript. The manuscript will undergo copyediting, typesetting, and review of the resulting proof before it is published in its final citable form. Please note that during the production process errors may be discovered which could affect the content, and all legal disclaimers that apply to the journal pertain.
Literature Cited
- Berendse HW, Groenewegen HJ. Organization of the thalamostriatal projections in the rat, with special emphasis on the ventral striatum. J Comp Neurol. 1990;299:187–228. doi: 10.1002/cne.902990206. [DOI] [PubMed] [Google Scholar]
- Berendse HW, Groenewegen HJ. Restricted cortical termination fields of the midline and intralaminar thalamic nuclei in the rat. Neuroscience. 1991;42:73–102. doi: 10.1016/0306-4522(91)90151-d. [DOI] [PubMed] [Google Scholar]
- Charaviglio E. Mesencephalic influence on the intake of sodium chloride and water in the rat. Brain Res. 1972;44:73–82. doi: 10.1016/0006-8993(72)90367-8. [DOI] [PubMed] [Google Scholar]
- Chiaraviglio E. Sodium chloride intake following electrochemical stimulation of the frontal lobe cortex in the rat. Physiol Behav. 1984;33:547–551. doi: 10.1016/0031-9384(84)90369-x. [DOI] [PubMed] [Google Scholar]
- Coolen LM, Peters HJ, Veening JG. Fos immunoreactivity in the rat brain following consummatory elements of sexual behavior: a sex comparison. Brain Res. 1996;738:67–82. doi: 10.1016/0006-8993(96)00763-9. [DOI] [PubMed] [Google Scholar]
- Coolen LM, Veening JG, Wells AB, Shipley MT. Afferent connections of the parvocellular subparafascicular thalamic nucleus in the rat: evidence for functional subdivisions. J Comp Neurol. 2003;463:132–156. doi: 10.1002/cne.10739. [DOI] [PubMed] [Google Scholar]
- Feltenstein MW, See RE. The neurocircuitry of addiction: an overview. Br J Pharmacol. 2008;154:261–274. doi: 10.1038/bjp.2008.51. [DOI] [PMC free article] [PubMed] [Google Scholar]
- Fields HL, Hjelmstad GO, Margolis EB, Nicola SM. Ventral tegmental area neurons in learned appetitive behavior and positive reinforcement. Annu Rev Neurosci. 2007;30:289–316. doi: 10.1146/annurev.neuro.30.051606.094341. [DOI] [PubMed] [Google Scholar]
- Fregly MJ, Waters IW. Effect of mineralocorticoids on spontaneous sodium chloride appetite of adrenalectomized rats. Physiol Behav. 1966;1:65–74. [Google Scholar]
- Fulwiler CE, Saper CB. Subnuclear organization of the efferent connections of the parabrachial nucleus in the rat. Brain Res Reviews. 1984;7:229–259. doi: 10.1016/0165-0173(84)90012-2. [DOI] [PubMed] [Google Scholar]
- Geerling JC, Engeland WC, Kawata M, Loewy AD. Aldosterone target neurons in the nucleus tractus solitarius drive sodium appetite. J Neurosci. 2006;26:411–417. doi: 10.1523/JNEUROSCI.3115-05.2006. [DOI] [PMC free article] [PubMed] [Google Scholar]
- Geerling JC, Loewy AD. Aldosterone-sensitive neurons in the nucleus of the solitary tract: efferent projections. J Comp Neurol. 2006;497:223–250. doi: 10.1002/cne.20993. [DOI] [PubMed] [Google Scholar]
- Geerling JC, Loewy AD. Sodium deprivation and salt intake activate separate neuronal subpopulations in the nucleus of the solitary tract and the parabrachial complex. J Comp Neurol. 2007;504:379–403. doi: 10.1002/cne.21452. [DOI] [PubMed] [Google Scholar]
- Geerling JC, Loewy AD. Central regulation of sodium appetite. Exp Physiol. 2008;93:177–209. doi: 10.1113/expphysiol.2007.039891. [DOI] [PubMed] [Google Scholar]
- Geerling JC, Stein MK, Miller RL, Shin JW, Gray PA, Loewy AD. FoxP2 expression defines dorsolateral pontine neurons activated by sodium deprivation. Brain Res. 2010 doi: 10.1016/j.brainres.2010.11.028. [DOI] [PMC free article] [PubMed] [Google Scholar]
- Geerling JC, Stein MK, Miller RL, Shin JW, Gray PA, Loewy AD. FoxP2 expression defines dorsolateral pontine neurons activated by sodium deprivation. Brain Res. 2011;1375:19–27. doi: 10.1016/j.brainres.2010.11.028. [DOI] [PMC free article] [PubMed] [Google Scholar]
- Grill HJ, Schulkin J, Flynn FW. Sodium homeostasis in chronic decerebrate rats. Behav Neurosci. 1986;100:536–543. doi: 10.1037//0735-7044.100.4.536. [DOI] [PubMed] [Google Scholar]
- Groenewegen HJ, Witter MP. Thalamus. In: Paxinos G, editor. The Rat Nervous System. San Diego: Elsevier; 2004. pp. 407–453. [Google Scholar]
- Guyenet PG. The sympathetic control of blood pressure. Nat Rev Neurosci. 2006;7:335–346. doi: 10.1038/nrn1902. [DOI] [PubMed] [Google Scholar]
- Hajnal A, Norgren R. Accumbens dopamine mechanisms in sucrose intake. Brain Res. 2001;904:76–84. doi: 10.1016/s0006-8993(01)02451-9. [DOI] [PubMed] [Google Scholar]
- Hajnal A, Norgren R. Taste pathways that mediate accumbens dopamine release by sapid sucrose. Physiol Behav. 2005;84:363–369. doi: 10.1016/j.physbeh.2004.12.014. [DOI] [PubMed] [Google Scholar]
- Hajnal A, Smith GP, Norgren R. Oral sucrose stimulation increases accumbens dopamine in the rat. Am J Physiol Regul Integr Comp Physiol. 2004;286:R31–R37. doi: 10.1152/ajpregu.00282.2003. [DOI] [PubMed] [Google Scholar]
- Heimer L, Zahm DS, Churchill L, Kalivas PW, Wohltmann C. Specificity in the projection patterns of accumbal core and shell in the rat. Neuroscience. 1991;41:89–125. doi: 10.1016/0306-4522(91)90202-y. [DOI] [PubMed] [Google Scholar]
- Herbert H, Bellintani-Guardia B. Morphology and dendritic domains of neurons in the lateral parabrachial nucleus of the rat. J Comp Neurol. 1995;354:377–394. doi: 10.1002/cne.903540307. [DOI] [PubMed] [Google Scholar]
- Johnson AK, Thunhorst RL. The neuroendocrinology of thirst and salt appetite: visceral sensory signals and mechanisms of central integration. Front Neuroendocrinol. 1997;18:292–353. doi: 10.1006/frne.1997.0153. [DOI] [PubMed] [Google Scholar]
- Kahrilas PJ, Rogers RC. Rat brainstem neurons responsive to changes in portal blood sodium concentration. Am J Physiol. 1984;247:R792–R799. doi: 10.1152/ajpregu.1984.247.5.R792. [DOI] [PubMed] [Google Scholar]
- Karimnamazi H, Travers JB. Differential projections from gustatory responsive regions of the parabrachial nucleus to the medulla and forebrain. Brain Res. 1998;813:283–302. doi: 10.1016/s0006-8993(98)00951-2. [DOI] [PubMed] [Google Scholar]
- Krout KE, Jansen AS, Loewy AD. Periaqueductal gray matter projection to the parabrachial nucleus in rat. J Comp Neurol. 1998;401:437–454. [PubMed] [Google Scholar]
- Krout KE, Loewy AD. Parabrachial nucleus projections to midline and intralaminar thalamic nuclei of the rat. J Comp Neurol. 2000;428:475–494. doi: 10.1002/1096-9861(20001218)428:3<475::aid-cne6>3.0.co;2-9. [DOI] [PubMed] [Google Scholar]
- Lucas LR, Grillo CA, McEwen BS. Salt appetite in sodium-depleted or sodium-replete conditions: possible role of opioid receptors. Neuroendocrinology. 2007;85:139–147. doi: 10.1159/000102536. [DOI] [PubMed] [Google Scholar]
- McCarron DA, Geerling JC, Kazaks AG, Stern JS. Can dietary sodium intake be modified by public policy? Clin J Am Soc Nephrol. 2009;4:1878–1882. doi: 10.2215/CJN.04660709. [DOI] [PubMed] [Google Scholar]
- McKinley MJ, McAllen RM, Davern P, Giles ME, Penschow J, Sunn N, Uschakov A, Oldfield BJ. The sensory circumventricular organs of the mammalian brain. Adv Anat Embryol Cell Biol. 2003;172(III–XII):1–122. doi: 10.1007/978-3-642-55532-9. back cover. [DOI] [PubMed] [Google Scholar]
- Miner P, Borkuhova Y, Shimonova L, Khaimov A, Bodnar RJ. GABA-A and GABA-B receptors mediate feeding elicited by the GABA-B agonist baclofen in the ventral tegmental area and nucleus accumbens shell in rats: reciprocal and regional interactions. Brain Res. 2010;1355:86–96. doi: 10.1016/j.brainres.2010.07.109. [DOI] [PubMed] [Google Scholar]
- Moga MM, Weis RP, Moore RY. Efferent projections of the paraventricular thalamic nucleus in the rat. J Comp Neurol. 1995;359:221–238. doi: 10.1002/cne.903590204. [DOI] [PubMed] [Google Scholar]
- Mungarndee SS, Lundy RF, Jr, Norgren R. Expression of Fos during sham sucrose intake in rats with central gustatory lesions. Am J Physiol Regul Integr Comp Physiol. 2008;295:R751–R763. doi: 10.1152/ajpregu.90344.2008. [DOI] [PMC free article] [PubMed] [Google Scholar]
- Na ES, Morris MJ, Johnson RF, Beltz TG, Johnson AK. The neural substrates of enhanced salt appetite after repeated sodium depletions. Brain Res. 2007;1171:104–110. doi: 10.1016/j.brainres.2007.07.033. [DOI] [PMC free article] [PubMed] [Google Scholar]
- Norgren R, Hajnal A, Mungarndee SS. Gustatory reward and the nucleus accumbens. Physiol Behav. 2006;89:531–535. doi: 10.1016/j.physbeh.2006.05.024. [DOI] [PMC free article] [PubMed] [Google Scholar]
- Paxinos G, Watson C. Burlington, MA: Elsevier; 2005a. The rat brain in stereotaxic coordinates. [DOI] [PubMed] [Google Scholar]
- Paxinos G, Watson C. The rat brain in stereotaxic coordinates. Amsterdam: Elsevier; 2005b. [DOI] [PubMed] [Google Scholar]
- Pecina S, Smith KS, Berridge KC. Hedonic hot spots in the brain. Neuroscientist. 2006;12:500–511. doi: 10.1177/1073858406293154. [DOI] [PubMed] [Google Scholar]
- Perkins E, Warren S, May PJ. The mesencephalic reticular formation as a conduit for primate collicular gaze control: tectal inputs to neurons targeting the spinal cord and medulla. Anat Rec (Hoboken) 2009;292:1162–1181. doi: 10.1002/ar.20935. [DOI] [PMC free article] [PubMed] [Google Scholar]
- Price CJ, Hoyda TD, Ferguson AV. The area postrema: a brain monitor and integrator of systemic autonomic state. Neuroscientist. 2008;14:182–194. doi: 10.1177/1073858407311100. [DOI] [PubMed] [Google Scholar]
- Reilly JJ, Maki R, Nardozzi J, Schulkin J. The effects of lesions of the bed nucleus of the stria terminalis on sodium appetite. Acta Neurobiol Exp (Wars) 1994;54:253–257. [PubMed] [Google Scholar]
- Richter C. Increased salt appetite in adrenalectomized rats. Am J Physiol. 1936;115:155–161. [Google Scholar]
- Saper CB, Chou TC, Elmquist JK. The need to feed: homeostatic and hedonic control of eating. Neuron. 2002;36:199–211. doi: 10.1016/s0896-6273(02)00969-8. [DOI] [PubMed] [Google Scholar]
- Sequeira SM, Geerling JC, Loewy AD. Local inputs to aldosterone-sensitive neurons of the nucleus tractus solitarius. Neuroscience. 2006;141:1995–2005. doi: 10.1016/j.neuroscience.2006.05.059. [DOI] [PubMed] [Google Scholar]
- Sesack SR, Grace AA. Cortico-Basal Ganglia reward network: microcircuitry. Neuropsychopharmacology. 2010;35:27–47. doi: 10.1038/npp.2009.93. [DOI] [PMC free article] [PubMed] [Google Scholar]
- Shekhtman E, Geerling JC, Loewy AD. Aldosterone-sensitive neurons of the nucleus of the solitary tract: multisynaptic pathway to the nucleus accumbens. J Comp Neurol. 2007;501:274–289. doi: 10.1002/cne.21245. [DOI] [PubMed] [Google Scholar]
- Shibata R, Kameishi M, Kondoh T, Torii K. Bilateral dopaminergic lesions in the ventral tegmental area of rats influence sucrose intake, but not umami and amino acid intake. Physiol Behav. 2009;96:667–674. doi: 10.1016/j.physbeh.2009.01.002. [DOI] [PubMed] [Google Scholar]
- Shin JW, Loewy AD. Gastric afferents project to the aldosterone-sensitive HSD2 neurons of the NTS. Brain Res. 2009;1301:34–43. doi: 10.1016/j.brainres.2009.08.098. [DOI] [PMC free article] [PubMed] [Google Scholar]
- Smith KS, Tindell AJ, Aldridge JW, Berridge KC. Ventral pallidum roles in reward and motivation. Behav Brain Res. 2009;196:155–167. doi: 10.1016/j.bbr.2008.09.038. [DOI] [PMC free article] [PubMed] [Google Scholar]
- Soderpalm B, Lof E, Ericson M. Mechanistic studies of ethanol's interaction with the mesolimbic dopamine reward system. Pharmacopsychiatry. 2009;42 Suppl 1:S87–S94. doi: 10.1055/s-0029-1220690. [DOI] [PubMed] [Google Scholar]
- Stein MK, Loewy AD. Area postrema projects to FoxP2 neurons of the pre-locus coeruleus and parabrachial nuclei: Brainstem sites implicated in sodium appetite regulation. Brain Res. 2010;1359:116–127. doi: 10.1016/j.brainres.2010.08.085. [DOI] [PMC free article] [PubMed] [Google Scholar]
- Stocker SD, Madden CJ, Sved AF. Excess dietary salt intake alters the excitability of central sympathetic networks. Physiol Behav. 2010;100:519–524. doi: 10.1016/j.physbeh.2010.04.024. [DOI] [PMC free article] [PubMed] [Google Scholar]
- Swanson LW. Brain maps: structure of the rat brain. Amsterdam: Elsevier; 1998. [Google Scholar]
- Tindell AJ, Smith KS, Pecina S, Berridge KC, Aldridge JW. Ventral pallidum firing codes hedonic reward: when a bad taste turns good. J Neurophysiol. 2006;96:2399–2409. doi: 10.1152/jn.00576.2006. [DOI] [PubMed] [Google Scholar]
- Tsumori T, Yokota S, Kishi T, Qin Y, Oka T, Yasui Y. Insular cortical and amygdaloid fibers are in contact with posterolateral hypothalamic neurons projecting to the nucleus of the solitary tract in the rat. Brain Res. 2006;1070:139–144. doi: 10.1016/j.brainres.2005.11.040. [DOI] [PubMed] [Google Scholar]
- Van der Werf YD, Witter MP, Groenewegen HJ. The intralaminar and midline nuclei of the thalamus. Anatomical and functional evidence for participation in processes of arousal and awareness. Brain Res Brain Res Rev. 2002;39:107–140. doi: 10.1016/s0165-0173(02)00181-9. [DOI] [PubMed] [Google Scholar]
- van Dongen YC, Deniau JM, Pennartz CM, Galis-de Graaf Y, Voorn P, Thierry AM, Groenewegen HJ. Anatomical evidence for direct connections between the shell and core subregions of the rat nucleus accumbens. Neuroscience. 2005;136:1049–1071. doi: 10.1016/j.neuroscience.2005.08.050. [DOI] [PubMed] [Google Scholar]
- Vertes RP, Hoover WB. Projections of the paraventricular and paratenial nuclei of the dorsal midline thalamus in the rat. J Comp Neurol. 2008;508:212–237. doi: 10.1002/cne.21679. [DOI] [PubMed] [Google Scholar]
- Voorhies AC, Bernstein IL. Induction and expression of salt appetite: effects on Fos expression in nucleus accumbens. Behav Brain Res. 2006;172:90–96. doi: 10.1016/j.bbr.2006.04.020. [DOI] [PubMed] [Google Scholar]
- Voorn P, Vanderschuren LJ, Groenewegen HJ, Robbins TW, Pennartz CM. Putting a spin on the dorsal-ventral divide of the striatum. Trends Neurosci. 2004;27:468–474. doi: 10.1016/j.tins.2004.06.006. [DOI] [PubMed] [Google Scholar]
- Wang J, Palkovits M, Usdin TB, Dobolyi A. Afferent connections of the subparafascicular area in rat. Neuroscience. 2006a;138:197–220. doi: 10.1016/j.neuroscience.2005.11.010. [DOI] [PubMed] [Google Scholar]
- Wang J, Palkovits M, Usdin TB, Dobolyi A. Forebrain projections of tuberoinfundibular peptide of 39 residues (TIP39)-containing subparafascicular neurons. Neuroscience. 2006b;138:1245–1263. doi: 10.1016/j.neuroscience.2005.12.022. [DOI] [PubMed] [Google Scholar]
- Warren S, Waitzman DM, May PJ. Anatomical evidence for interconnections between the central mesencephalic reticular formation and cervical spinal cord in the cat and macaque. Anat Rec (Hoboken) 2008;291:141–160. doi: 10.1002/ar.20644. [DOI] [PMC free article] [PubMed] [Google Scholar]
- Westerhaus MJ, Loewy AD. Sympathetic-related neurons in the preoptic region of the rat identified by viral transneuronal labeling. J Comp Neurol. 1999;414:361–378. [PubMed] [Google Scholar]
- Wolf G. Hypothalamic regulation of sodium intake: relations to preoptic and tegmental function. Am J Physiol. 1967;213:1433–1438. doi: 10.1152/ajplegacy.1967.213.6.1433. [DOI] [PubMed] [Google Scholar]
- Wolf G, Dicara LV, Braun JJ. Sodium appetite in rats after neocortical ablation. Physiol Behav. 1970;5:1265–1269. doi: 10.1016/0031-9384(70)90038-7. [DOI] [PubMed] [Google Scholar]
- Yamada H, Mendelsohn FA. Angiotensin II receptor binding in the rat hypothalamus and circumventricular organs during dietary sodium deprivation. Neuroendocrinology. 1989;50:469–475. doi: 10.1159/000125265. [DOI] [PubMed] [Google Scholar]
- Yamamoto T, Shimura T, Sakai N, Ozaki N. Representation of hedonics and quality of taste stimuli in the parabrachial nucleus of the rat. Physiol Behav. 1994;56:1197–1202. doi: 10.1016/0031-9384(94)90366-2. [DOI] [PubMed] [Google Scholar]
- Yamamoto T, Takemura M, Inui T, Torii K, Maeda N, Ohmoto M, Matsumoto I, Abe K. Functional organization of the rodent parabrachial nucleus. Ann N Y Acad Sci. 2009;1170:378–382. doi: 10.1111/j.1749-6632.2009.03883.x. [DOI] [PubMed] [Google Scholar]
- Zardetto-Smith AM, Beltz TG, Johnson AK. Role of the central nucleus of the amygdala and bed nucleus of the stria terminalis in experimentally-induced salt appetite. Brain Res. 1994;645:123–134. doi: 10.1016/0006-8993(94)91645-4. [DOI] [PubMed] [Google Scholar]
- Zellner MR, Ranaldi R. How conditioned stimuli acquire the ability to activate VTA dopamine cells: a proposed neurobiological component of reward-related learning. Neurosci Biobehav Rev. 2010;34:769–780. doi: 10.1016/j.neubiorev.2009.11.011. [DOI] [PubMed] [Google Scholar]
- Zhang M, Kelley AE. Intake of saccharin, salt, and ethanol solutions is increased by infusion of a mu opioid agonist into the nucleus accumbens. Psychopharmacology (Berl) 2002;159:415–423. doi: 10.1007/s00213-001-0932-y. [DOI] [PubMed] [Google Scholar]


