

Abstract
The inhibitory subunit of rod cyclic guanosine monophosphate (cGMP) phosphodiesterase, PDE6γ, is a major component of rod transduction and is required to support photoreceptor integrity. The N74A allele of PDE6γ has previously been shown in experiments carried out in vitro to reduce the regulatory inhibition on the PDE6 catalytic core subunits, PDE6αβ. This should, in intact rods, lead to an increase in basal (dark) PDE6 activity producing a state equivalent to light adaptation in the rods and we have examined this possibility using ERG and suction-electrode measurements. The murine opsin promoter was used to drive the expression of a mutant N74A and a wild-type PDE6γ control transgene in the photoreceptors of +/Pde6gtm1 mice. This transgenic line was crossed with Pde6gtm1/Pde6gtm1 mice to generate animals able to synthesize only the transgenic mutant PDE6γ. We find that the N74A mutation did not produce a significant decrease in circulating current, a decrease in sensitivity or affect the kinetics of the light response, all hallmarks of the light-adapted state. In an in vitro assay of the PDE purified from the N74A transgenic mice and control mice we could find no increase in basal activity of the mutant PDE6. Both the results from the physiology and the biochemistry experiments are consistent with the interpretation that the mutation causes a much milder phenotype in vivo than was predicted from observations made using a cell-free assay system. The in vivo regulation of PDE6γ on PDE6αβ may be more dynamic and context-dependent than was replicated in vitro.
Keywords: transgenic animals, knockout animals, photoreceptor transduction, retinal degeneration, phosphodiesterase
1. Introduction
Upon absorption of a photon, rhodopsin becomes photoexcited and stimulates G-protein transducin, which in turn activates its effector, the cyclic guanosine 3′,5′-monophosphate cGMP-phosphodiesterase (PDE6) complex [2, 3]. PDE6 is a heterotetrameric enzyme composed of two large catalytic subunits, PDE6α and PDE6β, and two small (87 amino acid) inhibitory subunits, PDE6γ2 (PDE6αβγ2). The α-subunit of transducin, GNAT1, activates PDE6 by binding to the PDE6γ subunits, thereby relieving inhibition of the PDE6αβ active sites. The resulting increase in PDE6 activity reduces the cytoplasmic free cyclic GMP concentration, which results in the closing of nuclelotide-gated ion channels in the rod plasma membrane. Channel closure decreases a net inward current, hyperpolarizes the rod membrane and decreases the release of transmitter at the rod synapse.
Lack of an efficient expression system for the PDE6 subunits has hampered PDE structure-function analyses [4, 5]. Therefore, we have used a transgenetic approach to provide in vivo information. To examine the in vivo function of the inhibitory PDE6γ subunit, we generated a mouse line, Pde6gtm1/Pde6gtm1, carrying a disruption of the gene encoding PDE6γ [6]. By introducing transgenes of PDE6γ carrying difference amino acid substitution or deletions into this line we can glean information about the function of the different parts and specific residues of the inhibitory subunit. From studies such as these and in vitro reconstitution assays it appears that the last dozen or so amino acids of the C-terminal end, including the last two, Ile86 and Ile87, is the part of the PDE6γ that directly interacts with the active sites of the PDE6αβ (for a review, [7].
In addition to Ile86 and Ile87, an alanine-scanning mutagenesis study of residues 73 to 85 of PDE6γ, has suggested that Asp74, His75 and Leu78 are also important for inhibitory activity [1]. The study tested the inhibitory effectiveness of the different point mutants on purified cone PDE6, purified rod PDE6 and a chimeric protein consisting of part PDE5, fused with cone PDE6. Each of these PDE had the endogenous WT inhibitory PDE6γ subunit removed by trypsin-treatment. Asn74ala (N74A) was particularly effective in compromising the inhibitory activity toward trypsin-treated rod PDE (>12 fold reduction in inhibition, and incomplete inhibition at saturating concentrations). N74 is immediately adjacent to the α2 helical structure that “senses” the conformational changes induced by binding of the PDE6γ-α1 helical region to the catalytic site of PDE6αβ [8] so such a dramatic effect of N74A on activity seems reasonable. N74A in an endogenous PDE6β, bound to PDE6αβ in situ, might then result in constitutively activated PDE6 in the rods; and this putative activation, if substantial enough, could lead to a condition equivalent to light adaptation in the rod, compromising rod sensitivity and the sensitivity of the entire visual system. In the extreme, rod degeneration and loss of vision could occur. Such eventualities are far from given, however, since PDE6, in situ, is dissimilar to the purified, trypsin-treated PDE6 constructs used in the in vitro analysis and the extent to which N74A might affect endogenous PDE6 is uncertain.
To test the role of the N74 residue of PDE6γ in vivo, mutant and wild-type PDE6γ cDNAs under the control of the opsin promoter were constructed and used to generate transgenic mice by conventional means [9]. The transgenes were then transferred to our mice homozygous for a targeted disruption of the endogenous PDE6γ gene, Pde6gtm1/Pde6gtm1, [6] by breeding, and the animals with the appropriate genotype were identified by PCR and Southern blot analysis of genomic DNA. PDE6 from N74A transgenic and control mice was isolated and tested for basal activity in biochemical analysis and possible photoreceptor desensitization was tested using ERG recording of whole retinal responses and by suction-electrode recording of individual isolated rods. Contrary to predicts that can be extrapolated from the in vitro mutagenesis analysis, our results indicate that N74A does not have an affect on PD6 activity in intact rods.
2. Materials and methods
2.1. Generation of Mutant Mouse Lines
The mice studied in these experiments were used in accordance with the ARVO statement for the Use of Animals in Ophthalmic and Vision Research and in compliance with the animal use protocols of Columbia University School of Medicine and the University of California, Los Angeles. DNA constructs for the expression of PDE6γ contained 4.4 kb of the mouse opsin promoter, the complete open reading frame of the Pde6g cDNA [10] and the polyadenylation signal of the mouse protamine gene [11] was injected into the male pronucleus of oocytes. The N74A point mutation was introduced by means of a standard PCR-based site-specific mutagenesis strategy [12]. The entire Pde6g cDNA coding region in the transgenic construct was sequenced to confirm the introduction of the point mutation and to verify that no other changes had been created inadvertently. KpnI and XbaI were used to excise vector sequences from the constructs. Oocytes were obtained from superovulated F1(DBA X C57BL6) females mated with homozygous Pde6gtm1/Pde6gtm1 males. The construct was injected into the male pronuclei of oocytes under a depression slide chamber. These microinjected oocytes were cultured overnight in M16 and transferred into the oviducts of 0.5-day post coitum pseudopregnant F1 females. The resulting transgenic mice were then backcrossed to Pde6gtm1/Pde6gtm1 mice to place the transgene into the knockout background. The mice were also tested for the absence of the rd1 mutation [13].
2.2. Identification of Transgenic Mice
DNA was isolated from tail tips or liver samples by homogenizing the tissue, digesting extensively with proteinase K, and extracting with phenol. DNA samples were analyzed by PCR. The samples were also digested with SacI and analyzed by Southern blot hybridization with a Pde6g cDNA probe. Additional restriction digests were performed to analyze the structure of the integrated sequences and to ensure that the DNA flanking the transgene was intact.
MF1 wild-type control and N74A transgenic mice were kept on a 12-hr light/dark cycle with food and water ad libidum until they reached experimental age (4-6 wks). Prior to the experiment, mice were dark-adapted overnight and sacrificed in complete darkness.
2.3. Histology
Mice were euthanized with an intraperitoneal injection of nembutal. Each eye was rapidly removed, punctured at 12:00 along the limbus, and placed in a separate solution of 3% glutaraldehyde in phosphate buffered saline. After fixation for 1-2 days, the eyes were washed with saline and the 12:00 limbal puncture was used to orient the right and left eyes, which were kept in separate buffer, so that the posterior segment containing the retina could be sectioned along the vertical meridian. A rectangular piece containing the entire retina from superior to inferior ora serrata, including the optic nerve, was prepared for post-fixing in osmic acid, dehydration, and epon embedding. A corner was cut out at the superior ora to allow identification of the upper retinal half of the segment. Sectioning proceeded along the long axis of the segment so that each section contained both upper and lower retina as well as the posterior pole. These segments were sectioned semi-serially, stained with toluidine blue, mounted, and examined by light microscopy. Selected areas were trimmed for ultrathin sectioning, stained with uranyl acetate, and examined by electron microscopy.
2.4. Immunoblot Analyses
Proteins from retinal extracts (normalized to a total concentration of 50 μg/lane) were separated by electrophoresis on either a 15% (for the PDE6γ subunit) or a 6.5% to 7.5% (for PDE6α and β subunits) inverted gradient polyacrylamide gel previously described by Tsang et al. [6]. Proteins were then transferred to 0.2 mm immuno-blot PVDF membranes (BioRad Laboratories, Hercules, CA) by the method of Towbin et al. [14], overnight, at 4 V/cm. Membranes were blocked in 3% BSA in phosphate buffered saline and 0.1% Tween.
For the detection of PDE6γ, blots were incubated with a 1:1000 dilution of a mixture of polyclonal peptide antisera directed against the N-terminal (amino acid residues 2-16) of the PDE6γ subunit (a gift of Akio Yamazaki). PDE6γ, polyclonal antibody recognising the N-terminus of PDE6γ [a gift of the Fung Laboratory (UCLA, Los Angeles, CA, USA) The PDE6α and β subunits were detected by incubation with a polyclonal antisera PA1-720 and PA1-722, respectively (Affinity Bioreagents, Thermo) Primary antibodies to other phototransduction enzymes were as follows: for GUCY2E, a polyclonal antibody to guanylyl cyclase 2E (a generous gift of Prof Alexander M. Dizhoor, Pennsylvania College of Optometry); for GRK1 (rhodopsin kinase), polyclonal antibody sc-13078 (Santa Cruz Biotechnology, Inc., Santa Cruz, CA, USA); for the GTPase accelerating protein RGS9, polyclonal antibody sc-8143 (Santa Cruz Biotechnology); for RGS9, polyclonal antibody to the GTPase-accelerating protein RGS9 (a gift of the Wensel Laboratory, Baylor College of Medicine, Houston, TX, USA); for α-transducin (GNAT1), polyclonal antibody, sc-391 (Santa Cruz Biotechnology); for rhodopsin, 1D4 monoclonal antibody to opsin, (a gift of the Molday Laboratory, University of British Columbia, Vancouver, Canada); for cyclic nucleotide gated channel protein, a monoclonal antibody to CNGA1 (a generous gift of the Molday Laboratory, University of British Columbia, Vancouver, Canada) and for α-Tubulin, monoclonal antibody T6074 (Sigma-Aldrich, Inc.)
Western blots were visualized with the DuoLux Chemiluminescence substrate kit (Vector Laboratories, Inc., Burlingame, CA) with a goat-anti-rabbit IgG-alkaline phosphatase conjugate. Blots were exposed to Hyperfilm-MP (Amersham Pharmacia Biotech, Piscataway, NJ), preflashed to increase sensitivity and linearity according to the Sensitize™ protocol (Amersham Pharmacia Biotech). After washing, antibody complexes were visualized by chemiluminescence detection (Immobilon Western; Millipore Corp., Billerica, MA). Multiple exposures were obtained (BioMax film; Eastman Kodak, Rochester, NY) and signals were quantified (AlphaImager and AlphaImage software; Alpha Innotech Corp., San Leandro, CA). An integral density value (IDV) for each band was determined and normalized to total protein. Comparisons between mutant and control samples were performed under conditions where the normalized values were found to be in the linear range of the assay.
2.5. PDE6 Purification and cyclic GMP Phosphodiesterase Assay
PDE6 was extracted with a hypotonic buffer according to the method of Kühn [15,16]. Dark-adapted retinas were homogenized in 100 mM Tris-HCl (pH 7.5), 1 mM MgCl2 supplemented with protease inhibitors. After centrifugation for 2 minutes, the supernatant was discarded, and the pellet was washed. PDE6 was extracted twice from the pellet with 5 mM Tris-HCl (pH 7.5), supplemented with 1 mM MgCl2. These supernatants were pooled, and protein concentrations were determined. Samples were adjusted to ~100 ng total protein/sample for the PDE assay. Samples (5 μL) were incubated with 20 μL cyclic GMP (0.5 mM stock solution), 10 μL snake venom (3.7 mg/mL stock solution), and 15 μL assay buffer for 30 minutes at 37°C with gentle rotation [17]. The reaction was stopped with 100 μL green reagent, and the color was allowed to develop for 30 minutes at room temperature (BioMol, Plymouth Meeting, PA, USA). The OD was measured at 620 nm. The cleavage of cyclic GMP to 5’-GMP by PDE was determined as phosphate release from 5’-GMP with the 5’-nucleotidase reaction.
Normalizing WT and N74A PDE6 activity to PDE6 content was accomplished by densitometric analysis of immunoblots. Briefly, total protein content per sample was determined by a protein assay method (DC Protein Assay; Bio-Rad Laboratories, Hercules, CA, USA). The proteins were separated by SDS–PAGE. Samples were then transferred to membranes, which were blocked with 3% BSA in 500 mM NaCl, 20 mM Tris (pH 7.6), and 0.1% Tween-20 (BSA-TTBS). Membranes were incubated with rabbit anti-PDE6 (1 mg/mL, PAI-722; Affinity Bioreagents, Golden, CO) and BSA-TTBS. After washing in TTBS, filters were incubated with anti-rabbit-conjugated horseradish peroxidase secondary antibodies (Santa Cruz Biotechnology, Santa Cruz, CA). After washing again, antibody complexes were visualized by chemiluminescence detection (Immobilon Western; Millipore Corp., Billerica, MA, USA). Multiple exposures were obtained (BioMax film; Eastman Kodak, Rochester, NY, USA) and signals were quantified (AlphaImager and AlphaImage software; Alpha Innotech Corp., San Leandro, CA, USA). An integral density value (IDV) for each band was determined and normalized to total protein. Comparisons between mutant and control samples were performed with normalized values in the linear range of the assay.
2.6. Electroretinography (ERG)
ERGs were obtained from anesthetized animals with a saline moistened cotton-wick electrode that contacted the cornea. Mice were anesthetized with a mixture of ketamine (50 mg/kg) and xylazine (10 mg/kg) administered either intraperitoneally or intramuscularly. The pupils were dilated with 1% phenylephrine HCl and 1% cyclopentolate. Body temperature was maintained at 37°C by a heated stage on which the mouse was laid. A 30 gauge needle was placed subcutaneously on the forehead as a reference electrode and a ground electrode subcutaneously on the trunk.
The stimuli were light flashes obtained from a Grass Instruments Inc. stroboscope removed from its housing and mounted in a metal box with a circular aperture 3 cm in diameter, placed 9 cm from the center of the pupil of the mouse. Neutral-density and/or spectral filters were placed between this aperture and the cornea to vary the energy and wavelength of the flash. Responses were detected with a Nicolet Instruments CA-1000 oscilloscope, averaging from 3 - 20 responses to the same flash intensity. Mice were dark-adapted for at least 6 hours before testing. Stimulation was begun with 4.8 log units of neutral density filtering, and responses were averaged with one flash presented every 3 sec. At high flash intensities, each flash was presented every 15 sec. The duration of a flash is nominally 10 microsecond, and the frequency response of the recording system is from 1 to 500 Hz).
2.7. Suction-electrode recordings
Methods for recording responses of mouse rods have been given previously [18-20]. Rods were perfused at 37°C with Dulbecco modified Eagle medium (D-2902, Sigma Chemical, St. Louis), supplemented with 15 mM NaHCO3, 2 mM Na succinate, 0.5 mM Na glutamate, 2 mM Na gluconate, and 5 mM NaCl, bubbled with 5% CO2 (pH 7.4). Data were filtered at 30 Hz (8 pole, Bessel) and sampled at 100 Hz. Flashes of 500 nm light 20 ms in duration were attenuated to different light levels by absorptive neutral density filters. At dim intensities, 10-20 individual responses presented at 5 s intervals were averaged to obtain the mean flash responses. At medium intensities, 5 to 10 responses were averaged, and the interflash interval was increased to 10 s. At bright intensities above saturation for the rods, only 3 to 5 responses were averaged, and the interflash interval was increased to 15-20 sec. Recordings always proceeded from dim intensities to brighter intensities, and the complete response-intensity data for an individual rod took about 20 min and bleached less than 0.5% of the visual pigment. Unless otherwise stated, errors are given as standard errors of the mean (SE). Curve fitting and plotting of data were done with the program Origin (OriginLab Inc., Northampton, MA).
3. Results
3.1. N74A Mutant Transgene Rescues Photoreceptor Degeneration in PDE6γ-Deficient Mice
To test the effects of the N74A PDE6γ mutation on PDE6 function in vivo, transgenic lines (Tg) expressing the N74A mutant allele were generated and crossed with Pde6gtm1/Pde6gtm1 to obtain mice that expressed only the mutant form of the γ-subunit.
Electron micrographs prepared from a postnatal day 90-old retinas showed normal outer segment discs in homozygous Pde6gtm1/Pde6gtm1 mice with the N74A transgene (Figure 1A, B), whereas the parental homozygous Pde6gtm1/Pde6gtm1 mice without the N74A transgene showed complete degeneration [6]. The average lengths of rod outer segments, measured from these micrographs using a standard procedure [21], were 25.3 +/- 3.1 μm (mean ± SD) from 25 MF1 controls, and 22 +/- 2.1 μm (mean ± SD) from the 26 N74A, p-value was 0.00005. (Figure 1C). Therefore, degeneration in parental mutant mice was rescued by the mutant transgene, much as the wild-type transgene rescues Pde6gtm1/Pde6gtm1 photoreceptors [21].
Fig. 1. Normal OS disc structure is seen in N74A mutant.
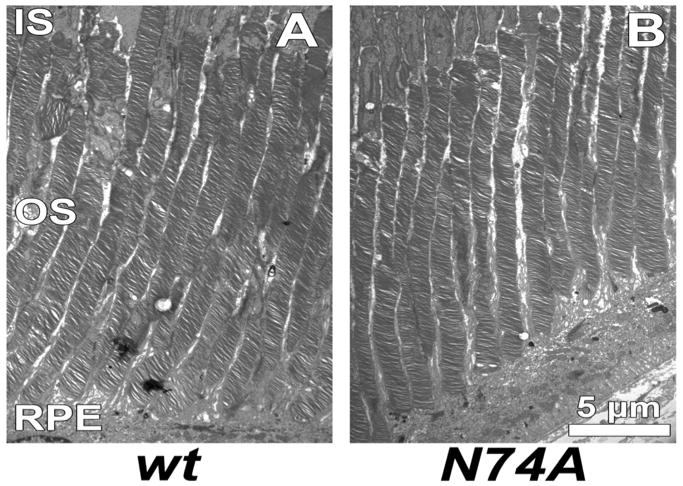

(A) Electron photomicrographs of OS discs in a postnatal day 90-old wild type (wt) control. (B) Electron photomicrographs of OS discs in a a postnatal day 90-old Pde6gtml/Pde6gtml homozygote with the N74A transgene. (C) Mean OS lengths of wt controls and N74A determined from measurements made from transmission electron microscopy. The dimensions of rod outer segments were 25 μm from MF1 controls, and 22 μm from the N74A mutants. Error bar show standard deviation. Inner segment (IS), outer segment (OS), retinal pigment epithelium (RPE)
Immunoblots with retinal extracts from the transgenic line, normalized to the amount of total protein present, revealed that the amounts of PDE6γ (Figure 2A and C) were not significantly different from +/Pde6gtm controls (Figure 2A and C). Levels of PDE6α were 73% and PDE6β were 67% of those seen in +/Pde6gtm1 retinas (Figure 2A and C). Other phototransduction enzymes assayed, guanylyl cyclase, cyclic nucleotide gated channel, rhodopsin kinase, transducin α, regulator of G-protein signaling 9, and rhodopsin (Figure 2B) are present at concentrations not significantly different from +/Pde6gtm or wild-type (+/+) controls, indicating that their expression was not affected by our substitution of normal for the mutant PDE6γ.
Fig. 2. Expression of PDE6 and other rod proteins and measurement of PDE6 activity.

(A) Immunoblot analysis of PDE6 subunits and transducin α-subunit (GNAT1) in retinal extracts of control MF1 (+/+), heterozygous +/Pde6gtml (+/-) and N74A on the Pde6gtml/Pde6gtml background. Protein was normalised to 50 μg unless otherwise stated. (B) Immunoblot analysis of guanylyl cyclase (GUCY2E), channel protein (CNGA1), rhodopsin kinase (GRK1), RGS9, α-transducin (GNAT1), and rhodopsin (RHO) with α-tubulin as a standard. Protein was normalised to 50 μg unless otherwise stated. (C) Quantitative analysis of PDE6 content from retinal homogenates. Signal intensities were determined by densitometry to calculate an IDV for each band. The values were normalised to the amount of protein loaded and expressed as a percentage relative to the PDE6 signal in 2.5 μg of control lysate. Similar normalized values were obtained at different loading amounts. (D) Basal (dark-adapted) PDE6 activity in P40 control and N74A retinal extracts were measured in control and N74A-mutant retinal extracts. Contrary to expectation, basal cGMP-PDE6 activity in N74A retinas was comparable to control retinas.
3.2. PDE Activity
The N74A mutant allele was anticipated to result in the formation of a PDE6 with a higher than normal basal (dark) activity [1]. Basal PDE6 activity was measured in control and N74A mutant retinal extract (Figure 2D). Non-trypsin-treated samples were used so the basal activities shown represent the activities of the PDEαβ with intact, bound, inhibitory PDE6γ. The basal cyclic GMP hydrolysis activity for the mutant N74A animals was 0.50±0.05 pmol PDEα+β IDV−1 min−1 and not significantly different from the +/+ control, 0.63±0.08 pmol PDEα+β IDV−1 min−1.
3.3. ERG measurement of the Mutant Mice
We used ERGs to assess global retinal function in the N74A mutants (Figure 3). Maximal rod-specific b-wave and maximal rod–cone a- and b-waves were comparable to WT controls. The sensitivity for eliciting a threshold b-wave was within normal limits in the N74A mutants. Photopic cone responses were comparable in N74A mutants and control B6 mice (Figure 3C).
Fig. 3. Electroretinogram (ERG) assessed global retinal function in the N74A mutants.

Rod-specific (A) and maximal mixed rod-cone (B) responses, and photopic cone responses (C) in four-week old N74A and control mice. ERGs were measured with an Espion Stimulator and response curves were generated. a-wave, photoreceptor response; b-wave, bipolar response. To assess cone signaling, mice were light adapted (32 cd/m2 white light) in the Ganzfeld dome for twenty minutes. Then, ERGs were recorded with a series of flash intensities ranging from near threshold (0.8 cd s /m2) to four log units above at 2.1 Hz. A rod-suppressing steady background of 32 cd/m2 was continuously present. A total of 100 responses (filtered from 0.03 to 300 Hz) were averaged for each trial. Rod-specific (A), Maximal (B), and cone (C) wave peaks in N74A mice are comparable to the C57BL/6 controls.
3.4. Single cell suction-electrode recording from N74A rods
The responses of single rods from mice carrying the N74A mutation (Figure 4B) were also normal, exhibiting similar amplitudes and waveforms to rods from MF1 strain control mice (Figure 4A and see Table 1). There were no significant differences in latency, time-to-peak, or saturating current amplitude (Student’s t test, 0.05). The sensitivites of dark-adapted N74A and strain controls were also similar as indicated by substantial overlap in their intensity-response functions (Figure 4C). There was a densitization in light-adapted N74A rods, indicated by the rightward shift of the intensity-response curve (Figure 4C), however the desensitization was not quite as strong as that seen for the strain control rods. The normal speeding up of response kinetics, i.e. response recovery kinetics, with background illumination (light adaptation) was intact in the N74A rods (Figure 4D).
Fig. 4. Waveform and amplitude of WT and N74A rods.

(A) Suction electrode recordings of N74A photoresponses. A) Strain-control rod responses to light flashes (20 ms) at seven intensities, 4, 17, 43, 158, 453, 1122 and 1870 photons μm-2. Traces are the averages from ten rods; each intensity averaged from 5-10 flashes. (B) N74A rod responses to the same seven intensities, averaged from 28 rods. (C) Intensity-response functions for dark-adapted (-■-) and light-adapted control strain (-□-) rods and dark-adapted (-●-) and light-adapted (-○-) N74A, N74A rods. Data are fit to Boltzmann equations, black control strain, red N74A. The control data is averaged from ten rods, N74A from 12 rods. The background light for the light-adapted rods was 440 photons μm-2 s-1 and flashes were delivered after 30 sec of background initiation. (D) Effect of light adaptation on response kinetics of N74A rods. Normalized flash responses to light of 453 photons μm-2 without a background light (black trace) or superimposed on background light of 13 (red), 38 (blue), 118 (green), 440 (magenta) or 1354 (gold) photons μm-2 s-1. Each trace is averaged from 12 rods, each rod sampled at each background intensity five times. Inset: Step-flash protocol with a saturating flash of 2433 photons μm-2 occurring without a background (black) or following 10 second exposure to backgrounds of 13 (red), 38 (blue), 118 (green), 440 (magenta) or 1354 (gold) photons μm-2 s-1. Traces are average of ten rods, and for each rod, each background was presented four times.
Table 1. Kinetic and Sensitivity Parameters of WT and N74A Rods.
A summary of suction-electrode recorded parameters is given in Table 1. The dominate time constant of recovery, the Pepperberg time constant, τD, may be slower in the N74A rods. Here it is 185 ms, whereas the control was only 106 ms. The value for the control seems unusually low. The value for other strains of mice is close to 200 ms so the principal difference here is that the strain-control may be unusually. We don’t know what to make of this difference.
| DARK CURRENT pA | FLASH SENSITIVITY pA photon-1 μm2 | INTEGRATION TIME ms | I1/2 photons μm-2 | τD | τrec | |
|---|---|---|---|---|---|---|
| Strain-control (10 rods) | 9.32±0.99 | 0.20±0.03 | 287±22 | 66±1 | 106±6 | 161±20 |
| N74A (24 rods) | 8.48±0.42 | 0.18±0.02 | 250±13 | 32±1 | 185±11 | 175±15 |
4. Discussion
Even thought PDE6γ is an inhibitory subunit, Pde6gtm1/Pde6gtm1 mice lacking PDE6γ have reduced rather than increased PDE6 activity and rods eventually degenerate. Examination of Pde6gtm1/Pde6gtm1 retinal extracts showed that the PDE6αβ catalytic dimer formed but lacked hydrolytic activity [6]. Thus, the inhibitory subunit has an unanticipated role in promoting PDE6 activity in vivo. Its binding to PDE6αβ may induce proper processing during development and/or proper conformation of the catalytic sites in processed protein. Activation by transducin deflects the inhibitory domain from the active site without compromising this binding. When transgenes of PDE6γ are reintroduced to Pde6gtm1/Pde6gtm1 activity is rescued and cell degeneration is prevented. Pde6gtm1/Pde6gtm1 with transgene is an excellent model system from which specific interactions between PDE6γ and PDE6αβ can studied in situ.
Here this strategy has been exploited to study the functional consequences of N74A PDE6γ in live photoreceptors. Previous in vitro experiments show that N74A PDE6γ exhibits an 12-fold increase in Ki for trypsin-activated PDE6αβ, suggesting that asparagine 74 is an important determinate of the inhibitory function of PDE6γ [1]. We have investigated a possible consequence of compromised inhibition: constitutively active PDE6 in situ which could result in lower than normal cyclic GMP levels, and therefore lower cyclic nucleotide-dependent current. Since the effect of light (activated photopigment) is to activate PDE, lower cyclic GMP and reduce the cyclic nucleotide-gated current we were expecting N74A PDE6γ contain rods to act if they were light-exposed, that is they might have reduced dark-current and be in a state of permanent light adaptation, showing reduced light sensitivity and faster response kinetics.
Surprisingly, the physiological assays, ERG and suction-electrode measurements, did not reveal any dramatic phenotype. There was no significant change in dark-current, sensitivity or kinetics compared to strain-matched controls. Furthermore, N74A rods showed fairly normal light adaptation when exposed to background illumination. It is noted that background illumination seemed to desensitize N74A rods to a lesser extent than control rods. This observation may be important because it now seems likely that PDE6, together with changes in cyclase activity and activated-rhodopsin turnoff rate, are responsible for aspects of light adaptation [19, 20].
Hence, the N74A mutation caused a much milder phenotype in vivo than was predicted from the biochemical assays in vitro [1]. The compartmentalization of the PDE6 signaling components in outer segment disc membranes is likely to enhance the protein-protein interactions in vivo that cannot be assessed in reconstituted in vitro assays. Experimental conditions with retinal recombinant proteins may not be able to reproduce the in vivo concentrations or the nature of the interactions between different binding partners on a plasma membrane surface. As another suggestion, the effect of the mutant in PDE6 may trigger compensatory feedback that lowers PDE activity. For example, a decrease in outer segment Ca2+ in N74A rods may down regulate PDE6 activity directly through some mechanisms involving PKC /PKA phosphoryaltion of PDE6γ [22].
Third, a more likely scenario is that the substrate used in the in vitro inhibition studies, trypsin-treated PDE, somehow amplifies the effect of specific point mutations. Our in vitro biochemical assay of basal PDE6 activity did not reveal any measurable increase in cyclic GMP hydrolysis rate by the N74A PDE6γ mutant, a result that seems more in concert with the physiological results. While our in vitro chemistry may seem to contradict the previously obtained in vitro determinations it should be kept in mind that the present experiments compared WT and mutant enzymes that were isolated as holoenzymes, with intact heterotrimeric subunits and assayed as such, whereas the previous reconstitution experiments isolated the holoenzymes and then trypsin-treated them so that the PDE6γ subunits and therefore the endogenous γ-subunit-dependent inhibition could be removed from the catalytic sites in preparation for combining the PDE6 catalytic sites with various exogenous, mutant PDE6γ. The substrates for PDE6γ-dependent inhibition in the two types of experiments are not the same and it is possible that this could explain much of the observed difference.
Abnormally low cyclic GMP phosphodiesterase activity is responsible for approximately 36,000 worldwide cases of retinal degeneration [23-27]. In spite of this high prevalence, the interplay between defective PDE metabolism and RP pathogenesis remains poorly understood. As there is no cure for these patients, the development of effective therapies to increase PDE6 activity requires an understanding of how PDE6 is regulated and integrated with other signal transduction pathways. As PDE6γ is an important regulatory component of PDE6, investigating the mechanisms by which PDE6γ regulates PDE6 is likely to improve our ability to control the progression of PDE6-related degenerations [27].
5. Conclusions
The inhibitory rod cyclic GMP phosphodiesterase γ subunit, PDE6γ, is a major component of the photoresponse and is required to support rod integrity. Pde6gtm1/Pde6gtm1 mice (that lack PDE6γ due to a targeted disruption of the Pde6g gene) suffer from severe photoreceptor degeneration as in human retinitis pigmentosa. The N74A allele of PDE6γ has previously been shown in experiments carried out in vitro to reduce the regulatory control of the PDE catalytic core (PDE6αβ) exerted by the wild-type PDE6γ subunit by 12-fold. Unexpectedly, the N74A mutation did not fully eliminate the control of PDE6γ on the PDE6αβ catalytic core in transgenic rod; contrary to predictions activity in vivo may be more dynamic and context-dependent than can be replicated in vitro. Experimental conditions with retinal homogenates and peptides may not be able to reproduce the in vivo concentrations or the nature of the interactions between different binding partners on a plasma membrane surface.
Acknowledgments
We greatly appreciate Gordon L. Fain members of his laboratories for sharing ideas, cell lines, antisera, and equipment as well as Richard J. Davis for critical reading of this manuscript. We are also grateful to members of the Gordon L. Fain and Bernard & Shirlee Brown Glaucoma Laboratories for support, especially Francisco Javier Sancho Pelluz, J. Mie Kasanuki and Jean J. Pak.
Financial Support: The Foundation Fighting Blindness, and Schneeweiss Stargardt Fund. SHT is a Fellow of the Burroughs-Wellcome Program in Biomedical Sciences, and has been supported by the Bernard Becker-Association of University Professors in Ophthalmology-Research to Prevent Blindness Award and Foundation Fighting Blindness, Dennis W. Jahnigen Award of the American Geriatrics Society, Joel Hoffman Fund, Gale and Richard Siegel Stem Cell Fund, Charles Culpeper Scholarship, Schneeweiss Stem Cell Fund, and Bernard and Anne Spitzer Stem Cell Fund, Barbara & Donald Jonas Family Fund; and by NIH R01 grants EY018213 to SHT.
Abbreviations and Textual Footnotes
- PDE6
cyclic GMP phosphodiesterase
- Pde6g
gene encoding the g subunit of the cyclic GMP phosphodiesterase
- Tα
Transducin alpha-GNAT1
- Pde6gtm1/Pde6gtm1
a mouse line carrying a targeted disruption of the Pde6g gene
- TgN74A
transgenic mice that only express a mutant γ subunit of PDE6
- ERG
Electroretinogram
- ROS
rod outer segments
Footnotes
Publisher's Disclaimer: This is a PDF file of an unedited manuscript that has been accepted for publication. As a service to our customers we are providing this early version of the manuscript. The manuscript will undergo copyediting, typesetting, and review of the resulting proof before it is published in its final citable form. Please note that during the production process errors may be discovered which could affect the content, and all legal disclaimers that apply to the journal pertain.
References
- 1.Granovsky AE, Arte[Cowan, #1466]myev NO. Biochemistry. 2001;40(44):13209–13215. doi: 10.1021/bi011127j. [DOI] [PubMed] [Google Scholar]
- 2.Tsang SH, Gouras P. In: Duane’s Clinical Opthalmology. Tasman W, Jaeger EA, editors. Chapter 2 Philadelphia: J.B Lippincott; 1996. [Google Scholar]
- 3.Farber DB, Tsang SH. Front Biosci. 2003;8:S666–675. doi: 10.2741/1111. [DOI] [PubMed] [Google Scholar]
- 4.Qin N, Baehr W. J Biol Chem. 1994;269:3265–3271. [PubMed] [Google Scholar]
- 5.Muradov H, Boyd KK, Artemyev NO. Vision Res. 2004;44(21):2437–2444. doi: 10.1016/j.visres.2004.05.013. [DOI] [PubMed] [Google Scholar]
- 6.Tsang SH, Gouras P, Yamashita CK, Kjeldbye H, Fisher J, Farber DB, Goff SP. Science. 1996;272(5264):1026–1029. doi: 10.1126/science.272.5264.1026. [DOI] [PMC free article] [PubMed] [Google Scholar]
- 7.Artemyev NO, Natochin M, Busman M, Schey KL, Hamm HE. Proc Natl Acad Sci U S A. 1996;93(11):5407–5412. doi: 10.1073/pnas.93.11.5407. [DOI] [PMC free article] [PubMed] [Google Scholar]
- 8.Zhang XJ, Skiba NP, Cote RH. J Biol Chem. 2009 doi: 10.1074/jbc.M109.057406. [DOI] [PMC free article] [PubMed] [Google Scholar]
- 9.Hogan B, Beddington R, Costantini F, Lacy E. Manipulating the Mouse Embryo: A Laboratory Manual. New York: Cold Spring Harbor Laboratory Press; 1994. [Google Scholar]
- 10.Tuteja N, Farber DB. FEBS Lett. 1988;232(1):182–186. doi: 10.1016/0014-5793(88)80413-7. [DOI] [PubMed] [Google Scholar]
- 11.Lem J, Applebury ML, Falk JD, Flannery JG, Simon MI. Neuron. 1991 February;6:201–210. doi: 10.1016/0896-6273(91)90356-5. [DOI] [PubMed] [Google Scholar]
- 12.Tsang SH, Burns ME, Calvert PD, Gouras P, Baylor DA, Goff SP, Arshavsky VY. Science. 1998;282(5386):117–121. doi: 10.1126/science.282.5386.117. [DOI] [PubMed] [Google Scholar]
- 13.Pittler SJ, Baehr W. Proc Nat Acad Sci. 1991;88:8322–8326. doi: 10.1073/pnas.88.19.8322. [DOI] [PMC free article] [PubMed] [Google Scholar]
- 14.Towbin H, Staehelin T, Gordon J. Proc Natl Acad Sci U S A. 1979;76(9):4350–4354. doi: 10.1073/pnas.76.9.4350. [DOI] [PMC free article] [PubMed] [Google Scholar]
- 15.Kuhn H. Methods Enzymol. 1982;81:556–564. doi: 10.1016/s0076-6879(82)81078-1. [DOI] [PubMed] [Google Scholar]
- 16.Kuhn H. Prog Clin Biol Res. 1984;164:303–311. [PubMed] [Google Scholar]
- 17.Artemyev NO. Methods Mol Biol. 2005;307:277–288. doi: 10.1385/1-59259-839-0:277. [DOI] [PubMed] [Google Scholar]
- 18.Woodruff ML, Janisch KM, Peshenko IV, Dizhoor AM, Tsang SH, Fain GL. J Neurosci. 2008;28(9):2064–2074. doi: 10.1523/JNEUROSCI.2973-07.2008. [DOI] [PMC free article] [PubMed] [Google Scholar]
- 19.Chen J, Woodruff ML, Wang T, Concepcion FA, Tranchina D, Fain GL. J Neurosci. 2011;30(48):16232–16240. doi: 10.1523/JNEUROSCI.2868-10.2010. [DOI] [PMC free article] [PubMed] [Google Scholar]
- 20.Chen CK, Woodruff ML, Chen FS, Shim H, Cilluffo MC, Fain GL. J Physiol. 2011;588(Pt 17):3231–3241. doi: 10.1113/jphysiol.2010.191221. [DOI] [PMC free article] [PubMed] [Google Scholar]
- 21.Tsang SH, Woodruff ML, Chen CK, Yamashita CY, Cilluffo MC, Rao AL, Farber DB, Fain GL. J Neurosci. 2006;26(17):4472–4480. doi: 10.1523/JNEUROSCI.4775-05.2006. [DOI] [PMC free article] [PubMed] [Google Scholar]
- 22.Janisch KM, Kasanuki JM, Naumann MC, Davis RJ, Lin CS, Semple-Rowland S, Tsang SH. Biochem Biophys Res Commun. 2009;390(4):1149–1153. doi: 10.1016/j.bbrc.2009.10.106. [DOI] [PMC free article] [PubMed] [Google Scholar]
- 23.McLaughlin ME, Sandberg MA, Berson EL, Dryja TP. Nature Genetics. 1993;4:130–134. doi: 10.1038/ng0693-130. [DOI] [PubMed] [Google Scholar]
- 24.McLaughlin ME, Ehrhart TL, Berson EL, Dryja TP. Proc Nat Acad Sci. 1995;92:3249–3253. doi: 10.1073/pnas.92.8.3249. [DOI] [PMC free article] [PubMed] [Google Scholar]
- 25.Huang SH, Huang X, Pittler SJ, Oliveira L, Berson EL, Dryja TP. Invest Opthal Vis Sci. 1995;36(4):S825. [Google Scholar]
- 26.Dryja TP, Rucinski DE, Chen SH, Berson EL. Invest Ophthalmol Vis Sci. 1999;40(8):1859–1865. [PubMed] [Google Scholar]
- 27.Dvir L, Srour G, Abu-Ras R, Miller B, Shalev SA, Ben-Yosef T. Am J Hum Genet. 2010;87(2):258–264. doi: 10.1016/j.ajhg.2010.06.016. [DOI] [PMC free article] [PubMed] [Google Scholar]