

Abstract
BACKGROUND & AIMS
With the limited efficacy of current therapy for chronic hepatitis C, modifiable risk factors for liver disease progression are important to identify. Because obesity is associated with liver disease, we examined the effects of weight-related conditions on disease outcomes in the Hepatitis C Antiviral Long-Term Treatment Against Cirrhosis (HALT-C) trial.
METHODS
Of 1050 patients, 985 could be evaluated for predefined progression of liver disease not related to hepatocellular carcinoma. Clinical outcomes were determined over 3.5 years for all patients and progression to cirrhosis on protocol biopsy among patients who had bridging fibrosis (56.5% of cohort) at entry.
RESULTS
At study entry, median body mass index was high (29.2 kg/m2) and accompanied by other weight-related conditions, including diabetes (24.9%), high median waist circumference, and insulin resistance (by updated homeostasis model assessment of insulin resistance; HOMA2-IR). Among noninvasive measures, HOMA2-IR was most strongly associated with outcomes with hazard ratio (HR) of 1.26 per quartile increase (95% CI, 1.09 –1.45). Presence of steatosis on baseline biopsy was associated with an increased outcome rate among patients with bridging fibrosis (P < .0001) and a decreased rate among patients with cirrhosis (P = .006). Presence of Mallory bodies was associated with outcomes (HR, 1.59; 95% CI, 1.10 –2.31) as was significant weight change of ≥5% in the first year after randomization (HR, 1.25 per category increase in weight, 95% CI, 1.01–1.55).
CONCLUSIONS
Insulin resistance, histologic features of fatty liver disease, and weight change were associated with outcomes of chronic hepatitis C. Improvement in these weight-related factors might modify disease progression.
The risk of progression of chronic hepatitis C virus (HCV) infection to cirrhosis and clinical outcomes varies greatly. Among the factors believed to accelerate disease progression are alcohol use, human immunodeficiency virus infection, male sex, and infection at an older age. Of these, only alcohol use can be eliminated. However, many nondrinkers with HCV develop severe liver disease, and risk factors that could influence disease progression, especially to cirrhosis and hepatic decompensation, are incompletely understood. One potential factor is excess body adiposity and its expression in the liver as the presence of steatosis. Because fatty liver disease in the absence of other causes can result in cirrhosis and liver failure, it would be reasonable to expect it to influence the progression of HCV infection. Despite the appeal of this concept, there is little published information showing that HCV-infected persons with obesity, diabetes, steatosis, or any other weight-related condition have a higher risk of progression of liver disease.
We used data from the Hepatitis C Antiviral Long-term Treatment Against Cirrhosis (HALT-C) trial to address the influence of weight-related conditions, including biopsy findings, on liver disease progression. This large, multicenter clinical trial with systematically collected information on potential risk factors and prespecified liver disease outcomes was well suited to examine weight-related conditions and histologic fatty liver on HCV disease progression.
Patients and Methods
The design and trial results of HALT-C have been published.1,2 Patients who remained viremic despite standard treatment with peginterferon and ribavirin were randomly assigned to treatment with peginterferon alfa 2a 90 μg or no treatment and followed for outcomes for 3.5 years. The 1050 patients randomly assigned were required to have had a baseline liver biopsy with bridging fibrosis (Ishak fibrosis score of 3 or 4) or cirrhosis (score of 5 or 6). Patient visits were conducted every 3 months. Protocol liver biopsies were performed at year 1.5 and year 3.5. In the current analysis, outcomes for patients with cirrhosis at baseline were death from liver disease or hepatic decompensation (presence of Child Turcotte Pugh score of ≥7 confirmed on 2 visits 3 months apart, ascites, encephalopathy, or variceal bleeding). In addition to these clinical events, a 2-point increase in Ishak fibrosis score qualified as an outcome for patients with bridging fibrosis at baseline. The histologic outcome was counted at first occurrence, whether that was at year 1.5 or 3.5.
Body mass index (BMI) was calculated as weight in kilograms/height in meters squared. Patients were considered to have diabetes if they had a current diagnosis or if their fasting blood glucose exceeded 126 mg/dL. Waist circumference was measured at the umbilicus while standing. Truncal obesity was defined as waist circumference >102 cm in men and >88 cm in women. Recreational physical activity was obtained by self-report from a questionnaire that was adapted from the third National Health and Nutrition Examination, coded by level of metabolic equivalents.3,4 Nonrecreational physical activity was self-reported as light, moderate, or heavy. Percentage of changes in weight (in kg) between baseline and 1 year after randomization was computed as (weight in kilograms at 1 year – weight in kilograms at baseline) × 100/(weight in kilograms at baseline). Alcohol use at baseline was categorized as never drinking, not currently drinking (if patient had ≥12 drinks during ≥1 year in the past, and no alcohol use during the previous 6 months), and current drinking (if patient had ≥1 drink during the previous 6 months).
Patients were asked to fast overnight for the glucose, insulin, and triglyceride measures. Glucose and triglyceride concentrations were measured locally, and insulin levels were tested by radioimmunoassay in a single laboratory.5 Insulin resistance was estimated by the updated homeostasis model assessment of insulin resistance (HOMA2-IR).6 For patients who had insulin values >400 pmol/L, an insulin value of 400 was used to calculate HOMA2-IR. Total and high-density lipoprotein serum cholesterol concentrations were measured centrally (Wako Diagnostics, Richmond, VA).
Liver biopsies were reviewed in conference by a committee of 12 study hepatic pathologists who were masked to patient data. Fibrosis was evaluated with the Masson trichrome stain and steatosis with the H&E stain. Fibrosis was scored from 0 to 6 and necroinflammation from 0 to 18, according to Ishak et al.7 Pericellular (predominantly zone 3) fibrosis was separately scored as absent, mild, or moderate/marked. Hepatic steatosis was graded as 0(<1%), 1 (1%–5%), 2 (6%–33%), 3 (34%–67%), and 4 (>67%). Mallory bodies were recognized as absent, few, or many. Patients with severe steatohepatitis were excluded from the trial.
Statistical Analyses
Results of 985 of 1050 patients randomly assigned were analyzed. Sixty-four of 1050 patients who were in the fibrosis stratum and who had no subsequent biopsy or any clinical outcome after excluding hepatocellular carcinoma and non–liver-related death were not included in the analysis. One patient with unknown cause of death was also excluded.
For continuous variables, 25th percentiles (quartiles) were used to describe and analyze the data. Because of the small numbers of patients with the highest levels of pericellular fibrosis, steatosis, and Mallory bodies, these categories were collapsed with the next lower category. The SAS GLM procedure (SAS Institute, Cary, NC) was used for linear trend tests for continuous variables. The Cochran-Armitage test of trend was used to investigate the trend among binomial proportion of disease progression. Duration of follow-up was censored at the first outcome or a maximum of 1400 days from the date of randomization. Cox proportional hazard regression was used to test the associations with disease progression. A 2-sided significance level with α of 5% was used for all analyses. All analyses were conducted with the use of SAS version 9.1.3 (SAS Institute). Each variable in the multivariate models was also evaluated with stage of fibrosis as an interaction term (bridging fibrosis or cirrhosis) to determine whether the effect on outcome was consistent across severity of liver disease. Secondary analyses evaluated whether the results differed by treatment group and whether restricted to clinical outcomes or fibrosis progression.
Results
A total of 985 patients followed for a maximum of 1400 days (3.8 years) was included in this analysis. At baseline, 56.5% of patients had a histologic diagnosis of bridging fibrosis, and the remainder had cirrhosis. The mean age of the patients was 50.2 years, 71% were men, and 18% were black. Randomization resulted in 488 patients assigned to treatment and 497 patients to no treatment.
The distributions of the weight-related baseline features are shown in Table 1 with continuous variables as quartiles. Greater than 75% of the patients were over-weight or obese (BMI ≥ 25 kg/m2) and 43.5% were obese (BMI ≥ 30 kg/m2). There was a substantial increase in weight by self-report from age 20 years to the measured baseline weight, with median increase of 26.9%. Other features associated with overweight and obesity also tended to be abnormal, including serum triglycerides (more than a quarter above the metabolic syndrome cutoff of 150 mg/dL), high-density lipoprotein cholesterol (nearly half below the metabolic syndrome cutoff of <40 mg/dL [male] or <50 mg/dL [female]), and waist circumference. Median waist circumference was 101 cm among men (44.8% were above the metabolic syndrome cutoff of 102 cm) and 96 cm among women (65.7% were above the metabolic syndrome cutoff of 88 cm). Median systolic blood pressure of 131 mm Hg was high, but median diastolic blood pressure was not (80 mm Hg). Total cholesterol concentration was also largely in the normal range (<25% greater than 200 mg/dL). Median HOMA2-IR of 4.59 was much higher than the norms in the general population, as was the 24.9% prevalence of diabetes. As would be expected in a randomized trial, there were few features that were meaningfully different between patients assigned to treatment or no treatment. Systolic blood pressure was the only baseline weight-related feature that was significantly different (P = .02), with more treated patients in the highest quartile (27.9%) than untreated patients (21.1%).
Table 1.
Characteristics of Patients by Quartiles or Categories
| Quartile 1 | Quartile 2 | Quartile 3 | Quartile 4 | ||
|---|---|---|---|---|---|
| BMI at baseline (kg/m2) | 984 | 18.4–26.2 | 26.2–29.2 | 29.2–32.8 | 32.8–58.4 |
| BMI minus BMI at age 20 | 977 | −14.4–3.31 | 3.31–6.18 | 6.18–9.40 | 9.40–27.8 |
| Percentage of weight change from age 20 | 977 | −34.8–14.1 | 14.1–26.9 | 26.9–42.1 | 42.1–132.5 |
| Waist circumference (cm) | |||||
| Men | 677 | 66–93 | 93–101 | 101–108 | 108–167 |
| Women | 280 | 60–86 | 86–96 | 96–108 | 108–149 |
| Triglycerides (mg/dL) | 985 | 18–80 | 80–112 | 112–165 | 165–1885 |
| Total cholesterol (mg/dL) | 940 | 82–147 | 147–169 | 169–193 | 193–280 |
| HDL cholesterol (mg/dL) | 939 | 1–33 | 33–41 | 41–50 | 50–142 |
| Systolic blood pressure (mm Hg) | 981 | 91–120 | 120–131 | 131–142 | 142–199 |
| Diastolic blood pressure (mm Hg) | 981 | 40–72 | 72–80 | 80–86 | 86–120 |
| HOMA2-IR | 760 | 0.68–3.00 | 3.00–4.59 | 4.59–6.85 | 6.85–66.7 |
| Glucose (mg/dL) | 985 | 47–88 | 88–98 | 98–114 | 114–437 |
| Insulin (μU/mL) | 760 | 5.80–23.3 | 23.3–36.0 | 36.0–58.2 | 58.2–476.7 |
| Recreational physical activity (mets/wk) | 982 | 0–12 | 12–29 | 29–61 | 61–430 |
| Percentage of weight change to 1 year after randomization | 924 | −24.8–2.71 | −2.71–0.62 | 0.62–4.72 | 4.72–30.9 |
| N | Percentage of cohort | ||||
| Percentage of weight change | 924 | ||||
| ≥5% Loss | 14.5 | — | — | — | |
| <5% Change | 62.3 | — | — | — | |
| ≥5% Gain | 23.2 | — | — | — | |
| Nonrecreational physical activity | 974 | ||||
| High | 11.3 | — | — | — | |
| Medium | 48.8 | — | — | — | |
| Low | 39.9 | — | — | — | |
| Cigarette smoking | 984 | ||||
| Never/not current | 70.6 | — | — | — | |
| <1 Pack/d | 14.9 | — | — | — | |
| >1 Pack/d | 14.4 | — | — | — | |
| Waist circumference | |||||
| Men >102 cm | 677 | 44.8 | — | — | — |
| Women >88 cm | 280 | 65.7 | — | — | — |
NOTE. Quartile 1 is minimum to 25th percentile; Quartile 2 is 25th percentile to median; Quartile 3 is median to 75th percentile; Quartile 4 is 75th percentile to maximum.
BMI, body mass index; HDL, high-density lipoprotein; HOMA2-IR, updated homeostasis model of insulin resistance.
During the randomized phase of the trial, a total of 273 patients had an outcome; 135 patients had a clinical outcome and 138 had a 2-point increase in fibrosis score without a clinical outcome (72 at the first biopsy and 66 at the second biopsy). Table 2 shows the proportion of patients with an outcome according to the same categorizations as in Table 1. It also shows the univariate hazard ratios (HRs) with the quartiles treated as ordered categorical variables. For example, the survival analysis indicated that for each quartile increase in baseline BMI, there was a 14% increase (hazard ratio, 1.14) in rate of outcomes. Other statistically significant associations were found for BMI change from age 20 years to baseline, HOMA2-IR, serum glucose, serum insulin, and diabetes. Waist circumference was associated with outcomes when categorized by the metabolic syndrome cutoffs (P = .009) but not when categorized as quartiles (P = .13).
Table 2.
Percentage Outcomes by Quartiles or Defined Categories (from Table 1) and Univariate Hazard Ratios with 95% Confidence Intervals and P Values
| Outcome by quartile, % | ||||||
|---|---|---|---|---|---|---|
| 1 | 2 | 3 | 4 | Hazard ratio | 95% Cl (P value) | |
| BMI (kg/m2) | 21.1 | 26.4 | 32.4 | 31.0 | 1.14 | 1.03-1.27a (.02) |
| BMI minus BMI at age 20 | 22.1 | 25.7 | 28.7 | 34.0 | 1.16 | 1.04–1.29a (.007) |
| Waist circumference | 25.2 | 23.8 | 34.3 | 28.6 | 1.09 | 0.98–1.21 (.13) |
| Triglyceride (mg/dL) | 26.0 | 28.0 | 27.2 | 29.7 | 1.04 | 0.93–1.15 (.48) |
| Total cholesterol (mg/dL) | 25.0 | 32.1 | 31.2 | 22.6 | 0.95 | 0.85–1.06 (.36) |
| HDL cholesterol (mg/dL) | 29.8 | 26.1 | 25.4 | 30.0 | 1.02 | 0.91–1.13 (.79) |
| Systolic blood pressure (mm Hg) | 23.9 | 29.0 | 28.3 | 30.4 | 1.09 | 0.98–1.21 (.12) |
| Diastolic blood pressure (mm Hg) | 24.3 | 28.0 | 31.4 | 28.3 | 1.06 | 0.95–1.17 (.31) |
| HOMA2-IR | 19.6 | 21.2 | 28.5 | 36.8 | 1.30 | 1.15–1.48a (<.0001) |
| Glucose (mg/dL) | 22.5 | 27.8 | 30.6 | 30.3 | 1.13 | 1.02–1.26a (.02) |
| Insulin (μU/mL) | 19.0 | 19.5 | 32.3 | 35.1 | 1.32 | 1.17–1.50a (<.0001) |
| Recreational activity | 27.8 | 25.6 | 27.6 | 29.3 | 1.01 | 0.91–1.13 (.84) |
| Percentage of weight change to 1 year after randomization | 22.7 | 24.5 | 27.7 | 28.6 | 1.10 | 0.98–1.23 (.11) |
| Outcome, % | Hazard ratio | 95 % CI (P value) | |
|---|---|---|---|
| Percentage of weight change | |||
| ≥5% Loss | 22.4 | 0.84 | 0.57–1.23 (.37) |
| <5% Change | 25.0 | 1 | — |
| ≥5% Gain | 30.4 | 1.35 | 1.02–1.80a (.04) |
| Nonrecreational activity | |||
| High | 26.4 | 0.90 | 0.75–1.08 (.25) |
| Medium | 25.7 | — | — |
| Low | 30.1 | — | — |
| Diabetes | |||
| Yes | 31.4 | 1.30 | 1.00–1.70a (.05) |
| No | 26.5 | — | — |
| Smoking | |||
| Never/not currently | 27.9 | 0.98 | 0.83–1.16 (0.81) |
| <1 Pack/d | 32.0 | — | — |
| ≥1 Pack/d | 22.5 | — | — |
| Waist circumference | |||
| High | 31.8 | 1.39 | 1.09–1.77a (.009) |
| Normal | 23.6 | — | — |
BMI, body mass index; HDL, high-density lipoprotein; HOMA2-IR, updated homeostasis model of insulin resistance.
Significant at the 5% level.
Three multivariate analyses of baseline features were performed that progressively built on information in the less complex analysis. First, easily measured baseline variables (BMI, diabetes, and dichotomously coded waist circumference) that appeared potentially associated with outcomes in univariate analysis (P < .10) were considered in multivariate analysis. Because percentage of weight change from age 20 years to baseline was highly correlated with baseline BMI (r = 0.63), the analysis was initially performed without weight change. Initial analysis was also performed without HOMA2-IR, which was missing for 225 patients who did not have insulin levels. In this multivariate analysis, none of the 3 variables had a statistically significant association with outcomes, although there was a 26% increased risk with diabetes (model 1 of Table 3). Adding percentage of weight change from age 20 years to baseline had no effect on the HR for BMI, and itself was not statistically significant (HR, 1.04 per quartile; 95% CI, 0.91–1.20).
Table 3.
Multivariate Analyses for Outcomes
| Model 1 (n = 956) |
Model 2 (n = 738) |
Model 3 (n = 737) |
||||
|---|---|---|---|---|---|---|
| Variables | Hazard ratio | 95% CI | Hazard ratio | 95% CI | Hazard ratio | 95% CI |
| Stratum (cirrhosis vs fibrosis) | — | — | — | — | 1.92 | 1.12–3.28a |
| Diabetes | 1.26 | 0.96–1.66 | 1.04 | 0.74–1.46 | 0.98 | 0.69–1.39 |
| BMI (quartiles) | 1.09 | 0.93–1.27 | 1.04 | 0.86–1.26 | 1.06 | 0.87–1.27 |
| H0MA2-IR (quartiles) | — | — | 1.26 | 1.09–1.45a | 1.25 | 1.08–1.45a |
| Waist circumference (high vs normal) | 1.14 | 0.80–1.63 | 1.10 | 0.72–1.68 | 1.04 | 0.68–1.59 |
| Steatosis (4 tratum | — | — | — | — | 1.21 | 0.99–1.47 |
| Steatosis by stratumb | — | — | — | — | 0.49 | 0.35–0.70a |
| Mallory bodies | — | — | — | — | 1.59 | 1.10–2.31a |
NOTE. Model 1 includes noninvasive measures at baseline, model 2 adds HOMA2-IR, and model 3 adds histologic features. Models 1 and 2 controlled for age, sex, and treatment; model 3 controlled for current alcohol consumption, age, sex, and treatment. BMI, body mass index; HOMA2-IR, updated homeostasis model of insulin resistance.
Significant at 5% level.
Steatosis score according to fibrosis stratum (bridging fibrosis or cirrhosis).
The second multivariate analysis added HOMA2-IR to the variables included in the first model. This analysis excluded 225 patients who did not have insulin levels. HOMA2-IR was strongly associated with progression of liver disease, and its addition attenuated the association with diabetes (model 2 of Table 3).
In addition to the establishment of noninvasive predictors of disease progression, histologic features of fatty liver disease were also examined (model 3 in Table 3). For all patients, there was a modest association of the degree of steatosis with outcome (P for trend = .08). However, the relation of steatosis and outcome depended highly on fibrosis stage. As shown in Figure 1, the degree of steatosis was positively associated with outcomes among patients with bridging fibrosis (P for trend < .0001) but negatively associated with outcome among patients with cirrhosis (P = .006). Because a broader outcome definition was allowed for the patients with bridging fibrosis (progression to cirrhosis as well as clinical outcomes), an analysis among this group was also performed that was restricted to clinical outcomes. Although only 5.8% of patients with bridging fibrosis had clinical outcomes, there was a nonsignificant association (P = .11 and lower line of Figure 1) of greater steatosis with clinical outcomes. To determine whether less steatosis among patients with cirrhosis may simply have been a marker of more severe disease, the degree of steatosis was examined in relation to other markers of liver disease severity (Table 4). Neither esophageal varices nor platelet concentration was associated with steatosis, although patients with cirrhosis and less steatosis trended to have lower platelet counts (P = .09); nor was complete cirrhosis (Ishak fibrosis stage 6) more common among the cirrhotic patients with less steatosis (P = .65).
Figure 1.
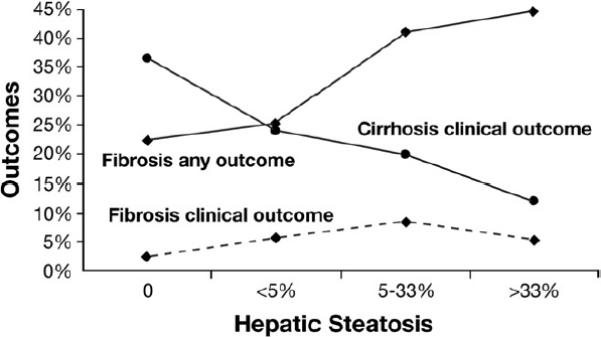
Clinical outcomes (filled diamond with dashed line) and all outcomes (filled diamond with solid line) (clinical and progression to cirrhosis) for patients with bridging fibrosis and clinical outcomes for patients with cirrhosis (filled circle with solid line) according to the degree of steatosis on baseline biopsy.
Table 4.
Steatosis Scores and Prevalence of Mallory Bodies, Pericellular (zone 3) Fibrosis, and Esophageal Varices at Baseline by Fibrosis Stratum
| Steatosis |
|||||
|---|---|---|---|---|---|
| None | 1%–5% | 5%–33% | >33% | P for trend* | |
| Bridging fibrosis at baseline (n) | 116 | 220 | 156 | 65 | |
| Mallory bodies (%) | 0.0 | 6.4 | 14.1 | 33.9 | <.0001 |
| Pericellular fibrosis (%) | 28.0 | 36.9 | 45.3 | 53.2 | .0002 |
| Mean platelet count (× 103/mm3) | 185.3 | 189.5 | 181.4 | 193.7 | .56 |
| Esophageal varices (%) | 9.7 | 17.7 | 17.0 | 17.5 | .17 |
| Cirrhosis at baseline (n) | 52 | 187 | 156 | 33 | |
| Mallory bodies (%) | 9.6 | 14.4 | 30.1 | 42.4 | <.0001 |
| Pericellular fibrosis (%) | 16.3 | 29.3 | 31.3 | 46.7 | .009 |
| Mean platelet count (× 103/mm3) | 127.6 | 132.3 | 135.9 | 148.2 | .09 |
| Esophageal varices (%) | 34.6 | 44.5 | 38.8 | 21.9 | .22 |
| Stage 6 fibrosis (%) | 40.4 | 47.6 | 45.5 | 48.5 | .65 |
NOTE. Prevalence of stage 6 fibrosis is shown for patients with cirrhosis.
The presence of Mallory bodies and of pericellular (predominantly zone 3) fibrosis was strongly associated with the degree of steatosis on baseline biopsy in both the bridging fibrosis and cirrhosis strata (Table 4). Mallory bodies were more common in patients with cirrhosis (21.7%) than those with fibrosis (10.4%) (P < .0001), whereas pericellular fibrosis was less common in patients with cirrhosis (29.8%) than patients with fibrosis (39.4%) (P = .002). Mallory bodies were associated with outcomes (35.8% outcomes with Mallory bodies and 26.3% outcomes without Mallory bodies; P = .02). The relation was stronger in the bridging fibrosis stratum (P = .0004) than in the cirrhosis stratum (P = .49). This association of Mallory bodies with outcomes was unlikely to be confounded by alcohol consumption because neither current (P = .76) nor past drinking (P = .46) was associated with the presence of Mallory bodies. Pericellular fibrosis was not associated with outcome overall (31.3% outcomes with pericellular fibrosis and 26.7% without; P = .14) or separately in the fibrosis (P = .35) or cirrhosis strata (P = .51).
To include histologic findings in multivariate analysis for outcomes, steatosis was entered with an interaction term with fibrosis stratum (model 3 of Table 3). This term was highly statistically significant (P < .0001). No other variable was found to have an interaction with fibrosis stage. Presence of Mallory bodies was also associated with outcomes. Inclusion of biopsy findings had little effect on the association of the other variables with outcomes. In particular, the HR for HOMA2-IR was unchanged. Two secondary analyses were performed for the variables in model 3, including steatosis, but restricted to either clinical outcomes or fibrosis progression that resulted in only minor differences in HRs. Notably, changes in the HRs from the model with clinical and histologic outcomes to the model that was restricted to either clinical outcomes or fibrosis progression were as follows: HOMA2-IR, 1.25 to 1.24 for clinical outcomes and to 1.25 for fibrosis progression; steatosis, 1.21 to 1.09 for clinical outcomes and to 1.24 for fibrosis progression; and Mallory bodies, 1.59 to 1.50 for clinical outcomes and to 1.47 for fibrosis progression. Importantly, in the analysis of clinical outcomes, the interaction of steatosis score by fibrosis stratum remained with a HR of 0.59 (95% CI, 0.38 – 0.92).
Weight change between baseline and 1 year after randomization was evaluated for its effect on outcomes. Sixty-one patients who had dropped out or had a clinical outcome within the first year were not included. Overall, there was modest weight gain through the first year of treatment with a median increase of 0.62% (Table 1). Patients randomly assigned to no treatment had greater weight increase than did treated patients, as did patients with cirrhosis (data not shown). The association between quartile of percentage of weight change and outcomes was of borderline statistical significance in univariate analysis (Table 2) and in multivariate analysis (HR, 1.11; 95% CI, 0.99 –1.25). Weight change was further examined by recategorization into clinically meaningful groups of ≥5% weight loss (median loss, 7.5%), <5% weight change, and ≥5% weight increase (median gain, 8.3%) as shown in Tables 1 and 2. Relative to patients whose weights were stable, patients who gained ≥5% had a 35% higher rate of outcomes (P = .04), whereas patients who lost ≥5% had a nonstatistically significant 16% decrease in outcomes (P = .37). However, in multivariate analysis, there was a statistically significant increase in outcomes with a HR per category of weight change of 1.25 (95% CI, 1.01–1.55). The addition of HOMA2-IR and histologic features had minimal effect on the relation of weight change and outcomes. In a secondary analysis restricted to clinical outcomes, the HR per weight change category remained relatively unchanged at 1.21 (95% CI, 0.91–1.61). Because interferon treatment affects weight, the analysis was also conducted according to treatment assignment. Results were similar for the effect of weight change on outcomes among patients assigned to treatment (HR, 1.28; 95% CI, 0.94 –1.73) or to no treatment (HR, 1.24; 95% CI, 0.90 – 1.69). A test for interaction was not statistically significant (P = .81).
A secondary analysis was performed to determine whether assignment to treatment affected the relation of weight-related factors and outcomes. Among all of the models, only the effect of HOMA2-IR appeared to be affected by treatment. In model 2 of Table 3 (which included diabetes, BMI, HOMA2-IR, and waist circumference), the HR per quartile increase in HOMA2-IR was 1.45 (95% CI, 1.18 –1.78) among untreated patients and 1.12 (95% CI, 0.91–1.36) among patients assigned to treatment.
The association of weight-related factors and inflammation on baseline biopsy and on change in inflammation to the last biopsy was examined. There was an association at baseline of insulin resistance, Mallory bodies, and steatosis with the severity of inflammation (P ≤ .02). Of greater importance, weight change expressed as either quartiles (P = .005) or as category of >5% or <5% change (P = .004) was associated with a change in inflammation between the baseline and final biopsy. This change in inflammation in relation to weight change is shown in Figure 2.
Figure 2.
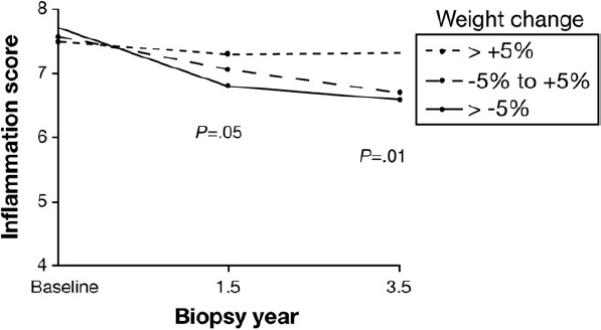
Association of weight change from baseline to the first year after randomization according to percentage of weight change category with inflammation score in biopsies obtained 1.5 (P = .05) and 3.5 (P = .01) years after randomization.
Discussion
This study showed an association of several weight-related features to increased rates of liver disease progression among patients with advanced chronic hepatitis C. In particular, insulin resistance and histologic features of fatty liver disease at baseline were strongly associated with progressive liver disease. Of greatest clinical significance, weight change during the trial was associated with liver disease outcomes. Although this study was performed among a selected group of patients with treatment-resistant hepatitis C, it is likely that the findings would extend to other patients with hepatitis C. In addition, the relations of weight-related features and outcomes were consistent for the 2 randomized groups, with the exception of HOMA2-IR, which was strongly associated with disease progression among untreated patients but not among patients assigned to treatment.
Several large cross-sectional studies, including the baseline of HALT-C, have documented an association of the degree of hepatic steatosis and fibrosis severity8–13 up to cirrhosis, at which point steatosis was less common.14,15 At least one study did not find an association of steatosis and fibrosis.16 Such associations have generally been made among patients without advanced liver disease. Cross-sectional studies neither offer compelling evidence of the influence of a risk factor on disease severity nor can they quantify the risk of disease progression. In contrast to the cross-sectional studies, relatively small paired biopsy studies of patients with untreated hepatitis C either did not show a relation of steatosis on first biopsy to progression of fibrosis or did not report the result.17,18 Of importance, a relation of steatosis to clinical outcomes has not been reported among a large cohort of patients with chronic hepatitis C. The current study has shown a complex yet clinically significant relation of steatosis and progressive liver disease, one that differed between patients with bridging fibrosis and with cirrhosis. No other factor showed an interaction with fibrosis stratum and outcome. In addition, in a secondary analysis limited to clinical outcomes, the interaction persisted such that the importance of the degree of steatosis on clinical progression was modulated by the severity of fibrosis. Most significantly, among patients with bridging fibrosis, steatosis was strongly associated with progression of liver disease. It is possible that greater steatosis would be a risk factor for fibrosis progression not only among patients with advanced fibrosis but also in patients with hepatitis C and a lesser degree of fibrosis.
In contrast to bridging fibrosis, clinical outcomes occurred less commonly among patients with cirrhosis and greater steatosis. Although steatosis may stimulate fibrosis progression, once cirrhosis develops, lack of histologic fat might reflect greater disease severity. In a separate analysis of this cohort, a decline in steatosis was associated with progression to cirrhosis, supporting the concept that less steatosis might be a marker of more severe disease in patients with cirrhosis.19 In the current analysis, baseline steatosis was not associated with other indicators of liver disease such as thrombocytopenia and esophageal varices (Table 4). Nevertheless, taken together, these data indicate that the failure to find fat in cirrhotic biopsies in hepatitis C appears to be an adverse prognostic sign and is quite different from patients with steatosis and less severe fibrotic liver disease. Two other markers of fatty liver disease were also evaluated. The presence of Mallory bodies was associated with disease progression for the entire cohort, but the relation was stronger among patients with bridging fibrosis. Interestingly, pericellular (zone 3) fibrosis was not associated with disease progression in either fibrosis stratum. The Ishak fibrosis scale does not consider pericellular fibrosis in its staging, which appears justified by the current study.
Although commonly found in hepatitis C–related liver disease, features of fatty liver disease have not been considered as measures of severity and are not scored in the standard grading and staging systems.7 The presence of fatty liver is not specific to hepatitis C and has not always been recognized as clinically significant. Because of their prognostic significance, histologic characteristics of fatty liver, particularly degree of steatosis and the presence of Mallory bodies, should be recorded in biopsy readings of patients with hepatitis C, and consideration should be given to their incorporation into histologic scoring systems of chronic hepatitis. Note that patients whose baseline biopsies indicated severe steatohepatitis were excluded from the trial. It is possible that patients with severe steatohepatitis (alcoholic or nonalcoholic) and chronic hepatitis C would have had an even higher rate of outcomes.
Baseline median HOMA2-IR of 4.59 was much higher than norms in the general population, as was the 24.9% prevalence of diabetes.20,21 Glucose homeostasis deteriorates with development of severe liver disease, so that diabetes is common with cirrhosis.22 Therefore, associations in cross-sectional studies cannot establish that diabetes and hyperinsulinemia result in severe liver disease. An advantage of the current study is that a strong association of HOMA2-IR to the risk of progressive liver disease was established prospectively, even though HOMA2-IR is not necessarily a good measure of true insulin resistance. In the presence of steatosis, it appears that indirect measures of insulin secretion such as HOMA2-IR are strongly affected by diminished hepatic insulin clearance as well as by insulin resistance.23 Irrespective of the mechanism of its elevation, increased HOMA2-IR was associated with significant liver disease progression.
Baseline BMI was associated with outcomes (at least in univariate analysis), as was weight change. Nearly half of the HALT-C cohort was obese, which may have contributed to the severity of liver disease and resistance to standard treatment before entering the randomized trial. For a population with severe hepatitis C that is resistant to available treatment, the association of weight change with outcomes is the most immediate clinically significant finding of this analysis. Until now, there has been indirect evidence only that overweight and obesity are associated with worse outcomes in hepatitis C. Even among patients with nonviral-related steatohepatitis, evidence that weight ameliorates clinical disease has been limited.24 As previously shown, weight loss in the HALT-C cohort was associated with decline in steatosis.19 Of comparable significance, the current report has shown that weight loss was associated with a decline in inflammation. The difference in the change in inflammation between patients who lost >5% of weight within a year of random assignment and those who gained >5% was comparable to the change in inflammation between treated and untreated patients.2 Such declines in both steatosis and inflammation with weight loss might slow disease progression, even in the presence of ongoing infection. It is possible that the weight-related associations with liver disease progression identified in the current study could apply to obesity-related fatty liver in the presence of other liver diseases not resulting from hepatitis C.
For patients resistant to or unable to take antiviral therapy for hepatitis C, body weight appears to be a significant modifiable risk factor for disease progression. In the absence of a long-term trial of weight loss and liver disease outcomes, the results of this study may provide the strongest evidence for a clinical benefit of weight loss among over-weight or obese persons with chronic hepatitis C.
Acknowledgments
In addition to the authors of this manuscript, the following persons were instrumental in the planning, conduct, or care of patients enrolled in this study at each of the participating institutions as follows: University of Massachusetts Medical Center, Worcester, MA (contract N01-DK-9-2326): Gyongyi Szabo, MD, Barbara F. Banner, MD, Maureen Cormier, RN, Donna Giansiracusa, RN; University of Connecticut Health Center, Farmington, CT (grant M01RR-06192): Michelle Kelley, RN, ANP; Saint Louis University School of Medicine, St Louis, MO (contract N01-DK-9-2324): Adrian M. Di Bisceglie, MD, Bruce Bacon, MD, Brent Neuschwander-Tetri, MD, Debra King, RN; Massachusetts General Hospital, Boston, MA (contract N01-DK-9-2319, grant M01RR-01066): Jules L. Dienstag, MD, Andrea E. Reid, MD, Atul K. Bhan, MD, Wallis A. Molchen; University of Colorado School of Medicine, Denver, CO (contract N01-DK-9-2327, grant M01RR-00051): Gregory T. Everson, MD, S. Russell Nash, MD, Jennifer DeSanto, RN, Carol McKinley, RN; University of California Irvine, Irvine, CA (contract N01-DK-9-2320, grant M01RR-00827): John C. Hoefs, MD, John R. Craig, MD, M. Mazen Jamal, MD, MPH, Muhammad Sheikh, MD, Choon Park, RN; University of Texas Southwestern Medical Center, Dallas, TX (contract N01-DK-9-2321, grant M01RR-00633): William M. Lee, MD, Thomas E. Rogers, MD, Janel Shelton, Nicole Crowder, LVN, Rivka Elbein, RN, BSN, Nancy Liston, MPH; University of Southern California, Los Angeles, CA (contract N01-DK-9-2325, grant M01RR-00043): Sugantha Govindarajan, MD, Carol B. Jones, RN, Susan L. Milstein, RN; University of Michigan Medical Center, Ann Arbor, MI (contract N01-DK-9-2323, grant M01RR-00042): Robert J. Fontana, MD, Joel K. Greenson, MD, Pamela A. Richtmyer, LPN, CCRC, R. Tess Bonham, BS; Virginia Commonwealth University Health System, Richmond, VA (contract N01-DK-9-2322, grant M01RR-00065): Mitchell L. Shiffman, MD, Richard K. Sterling, MD, Melissa J. Contos, MD, A. Scott Mills, MD, Charlotte Hofmann, RN, Paula Smith, RN; Liver Diseases Branch, National Institute of Diabetes and Digestive and Kidney Diseases, National Institutes of Health, Bethesda, MD: T. Jake Liang, MD, David Kleiner, MD, PhD, Yoon Park, RN, Elenita Rivera, RN, Vanessa Haynes-Williams, RN; National Institute of Diabetes and Digestive and Kidney Diseases, Division of Digestive Diseases and Nutrition, Bethesda, MD: Leonard B. Seeff, MD, Patricia R. Robuck, PhD, Jay H. Hoofnagle, MD, Elizabeth C. Wright, PhD; University of Washington, Seattle, WA (contract N01-DK-9-2318): Chihiro Morishima, MD, David R. Gretch, MD, PhD, Minjun Chung Apodaca, BS, ASCP, Rohit Shankar, BC, ASCP; New England Research Institutes, Watertown, MA (contract N01-DK-9-2328): Kristin K. Snow, MSc, ScD, Anne M. Stoddard, ScD, Margaret C. Bell, MS, MPH; Armed Forces Institute of Pathology, Washington, DC: Zachary D. Goodman, MD; Data and Safety Monitoring Board Members: (Chair) Gary L. Davis, MD, Guadalupe Garcia-Tsao, MD, Michael Kutner, PhD, Stanley M. Lemon, MD, Robert P. Perrillo, MD.
This is publication no. 39 from the HALT-C Trial Group. The HALT-C Trial was registered with clinicaltrials.gov (#NCT00006164).
The authors disclose the following: Financial relationships of the authors with Hoffmann-La Roche, Inc, are as follows: A.S. Lok is a consultant; T.R. Morgan is consultant, is on the speaker's bureau, and receives research support; K.L. Lindsay is a consultant and receives research support; R.T. Chung receives research support; and H.L. Bonkovsky receives research support.
Funding This study was supported by the National Institute of Diabetes, Digestive, and Kidney Diseases (contract numbers are listed with the acknowledgments). Additional support was provided by the National Institute of Allergy and Infectious Diseases (NIAID), the National Cancer Institute, the National Center for Minority Health and Health Disparities and by General Clinical Research Center grants from the National Center for Research Resources, National Institutes of Health (grant numbers are listed below). Additional funding to conduct this study was supplied by Hoffmann-La Roche, Inc, through a Cooperative Research and Development Agreement (CRADA) with the National Institutes of Health.
Footnotes
Abbreviations used in this paper: BMI, body mass index; HALT-C, Hepatitis C Antiviral Long-term Treatment Against Cirrhosis; HCV, hepatitis C virus; HOMA2-IR, updated homeostasis model of insulin resistance; HR, hazard ratio.
Conflicts of interest The remaining authors disclose no conflicts.
References
- 1.Lee WM, Dienstag JL, Lindsay KL, et al. Evolution of the HALT-C Trial: pegylated interferon as maintenance therapy for chronic hepatitis C in previous interferon nonresponders. Control Clin Trials. 2004;25:472–492. doi: 10.1016/j.cct.2004.08.003. [DOI] [PubMed] [Google Scholar]
- 2.Di Bisceglie AM, Shiffman ML, Everson GT, et al. Prolonged therapy of advanced chronic hepatitis C with low-dose peginterferon. N Engl J Med. 2008;359:2429–2441. doi: 10.1056/NEJMoa0707615. [DOI] [PMC free article] [PubMed] [Google Scholar]
- 3.Ainsworth BE, Haskell WL, Whitt MC, et al. Compendium of physical activities: an update of activity codes and MET intensities. Med Sci Sports Exerc. 2000;32(suppl):S498–S504. doi: 10.1097/00005768-200009001-00009. [DOI] [PubMed] [Google Scholar]
- 4.Crespo CJ, Keteyian SJ, Heath GW, Sempos CT. Leisure-time physical activity among US adults. Results from the Third National Health and Nutrition Examination Survey. Arch Intern Med. 1996;156:93–98. [PubMed] [Google Scholar]
- 5.Hayashi M, Floyd JC, Jr, Pek S, Fajans SS. Insulin, proinsulin, glucagon and gastrin in pancreatic tumors and in plasma of patients with organic hyperinsulinism. J Clin Endocrinol Metab. 1977;44:681–694. doi: 10.1210/jcem-44-4-681. [DOI] [PubMed] [Google Scholar]
- 6.Wallace TM, Levy JC, Matthews DR. Use and abuse of HOMA modeling. Diabetes Care. 2004;27:1487–1495. doi: 10.2337/diacare.27.6.1487. [DOI] [PubMed] [Google Scholar]
- 7.Ishak K, Baptista A, Bianchi L, et al. Histological grading and staging of chronic hepatitis. J Hepatol. 1995;22:696–699. doi: 10.1016/0168-8278(95)80226-6. [DOI] [PubMed] [Google Scholar]
- 8.Leandro G, Mangia A, Hui J, et al. Relationship between steatosis, inflammation, and fibrosis in chronic hepatitis C: a meta-analysis of individual patient data. Gastroenterology. 2006;130:1636–1642. doi: 10.1053/j.gastro.2006.03.014. [DOI] [PubMed] [Google Scholar]
- 9.Petta S, Camma C, Marco VD, et al. Insulin resistance and diabetes increase fibrosis in the liver of patients with genotype 1 HCV infection. Am J Gastroenterol. 2008;103:1136–1144. doi: 10.1111/j.1572-0241.2008.01813.x. [DOI] [PubMed] [Google Scholar]
- 10.Hu KQ, Kyulo NL, Esrailian E, et al. Overweight and obesity, hepatic steatosis, and progression of chronic hepatitis C: a retrospective study on a large cohort of patients in the United States. J Hepatol. 2004;40:147–154. doi: 10.1016/s0168-8278(03)00479-3. [DOI] [PubMed] [Google Scholar]
- 11.Friedenberg F, Pungpapong S, Zaeri N, Braitman LE. The impact of diabetes and obesity on liver histology in patients with hepatitis C. Diabetes Obes Metab. 2003;5:150–155. doi: 10.1046/j.1463-1326.2003.00256.x. [DOI] [PubMed] [Google Scholar]
- 12.Younossi ZM, McCullough AJ, Ong JP, et al. Obesity and nonalcoholic fatty liver disease in chronic hepatitis C. J Clin Gastroenterol. 2004;38:705–709. doi: 10.1097/01.mcg.0000135372.10846.2a. [DOI] [PubMed] [Google Scholar]
- 13.Cholet F, Nousbaum JB, Richecoeur M, et al. Factors associated with liver steatosis and fibrosis in chronic hepatitis C patients. Gastroenterol Clin Biol. 2004;28:272–278. doi: 10.1016/s0399-8320(04)94918-4. [DOI] [PubMed] [Google Scholar]
- 14.Wyatt J, Baker H, Prasad P, Gong YY, Millson C. Steatosis and fibrosis in patients with chronic hepatitis C. J Clin Pathol. 2004;57:402–406. doi: 10.1136/jcp.2003.009357. [DOI] [PMC free article] [PubMed] [Google Scholar]
- 15.Lok AS, Everhart JE, Chung RT, et al. Hepatic steatosis in hepatitis C: comparison of diabetic and nondiabetic patients in the hepatitis C antiviral long-term treatment against cirrhosis trial. Clin Gastroenterol Hepatol. 2007;5:245–254. doi: 10.1016/j.cgh.2006.11.002. [DOI] [PubMed] [Google Scholar]
- 16.Asselah T, Boyer N, Guimont MC, et al. Liver fibrosis is not associated with steatosis but with necroinflammation in French patients with chronic hepatitis C. Gut. 2003;52:1638–1643. doi: 10.1136/gut.52.11.1638. [DOI] [PMC free article] [PubMed] [Google Scholar]
- 17.Perumalswami P, Kleiner DE, Lutchman G, et al. Steatosis and progression of fibrosis in untreated patients with chronic hepatitis C infection. Hepatology. 2006;43:780–787. doi: 10.1002/hep.21078. [DOI] [PubMed] [Google Scholar]
- 18.Castera L, Hezode C, Roudot-Thoraval F, et al. Worsening of steatosis is an independent factor of fibrosis progression in untreated patients with chronic hepatitis C and paired liver biopsies. Gut. 2003;52:288–292. doi: 10.1136/gut.52.2.288. [DOI] [PMC free article] [PubMed] [Google Scholar]
- 19.Lok AS, Everhart JE, Chung RT, et al. Evolution of hepatic steatosis in patients with advanced hepatitis C: results from the hepatitis C antiviral long-term treatment against cirrhosis trial (HALT-C) trial. Hepatology. 2009;49:1828–1837. doi: 10.1002/hep.22865. [DOI] [PMC free article] [PubMed] [Google Scholar]
- 20.Ruhl CE, Everhart JE. Determinants of the association of over-weight with elevated serum alanine aminotransferase activity in the United States. Gastroenterology. 2003;124:71–79. doi: 10.1053/gast.2003.50004. [DOI] [PubMed] [Google Scholar]
- 21.Cowie CC, Rust KF, Byrd-Holt DD, et al. Prevalence of diabetes and impaired fasting glucose in adults in the U.S. population: National Health And Nutrition Examination Survey 1999 –2002. Diabetes Care. 2006;29:1263–1268. doi: 10.2337/dc06-0062. [DOI] [PubMed] [Google Scholar]
- 22.Hickman IJ, Macdonald GA. Impact of diabetes on the severity of liver disease. Am J Med. 2007;120:829–834. doi: 10.1016/j.amjmed.2007.03.025. [DOI] [PubMed] [Google Scholar]
- 23.Kotronen A, Vehkavaara S, Seppala-Lindroos A, Bergholm R, Yki-Jarvinen H. Effect of liver fat on insulin clearance. Am J Physiol Endocrinol Metab. 2007;293:E1709–E1715. doi: 10.1152/ajpendo.00444.2007. [DOI] [PubMed] [Google Scholar]
- 24.Farrell GC, Larter CZ. Nonalcoholic fatty liver disease: from steatosis to cirrhosis. Hepatology. 2006;43(suppl):S99–S112. doi: 10.1002/hep.20973. [DOI] [PubMed] [Google Scholar]