

FEATURE AT A GLANCE
Physician sign-out is a mechanism for transferring patient information from one group of hospital care-givers to another at shift changes. Support tools are critical to the success of sign-out. To ensure that a tool is effective, designers must collaborate with end users, but collaboration can be difficult when working with users who are busy and have irregular schedules. In this article, we report on a collaborative effort between physicians and engineers to redesign a sign-out support tool. Strategies included focus groups, interviews, “on-the-fly” feedback, and an iterative design process, which engaged end users in the design process. Task analysis methods enabled us to quantify the differences in functionality between the original tool and the prototype.
Keywords: sign-out, handoff of care, user-centered design, collaborative design, process support tools, medical decision making
A user-centered approach is critical in the development of new process support tools, but engaging end users can be challenging (Hooper, 1986). Users may not always be able to articulate their problems or point to their root causes; they may jump to potential solutions before truly understanding the underlying issues; and they may not be available during typical work hours to discuss problems with their tools.
In this article, we describe a multifaceted approach that combines focus groups, interviews, iterative prototyping, testing, and feedback for engaging one such group of end users –resident physicians – in the design process for a sign-out support tool. Suggested improvements are based on task analysis methods comparing the work flow found with the existing and redesigned tools, and practical strategies are discussed for increasing end user involvement in the design process.
Background
Sign-out (that is, when outgoing physicians hand off patient care to incoming physicians) is a critical process in hospital settings (Borowitz, Waggoner-Fountain, Bass, & Sledd, 2008). Residents’ duty hours are restricted to 30 continuous hours and 80 total hours per week, accompanied by 10-hour rest periods away from patient care (Accreditation Council for Graduate Medical Education, n.d.). As a result of these restrictions, the number of sign-outs between resident physicians has increased, along with concern for their effect on continuity of care (Horwitz, Krumholz, Green, & Huot, 2006; Okie, 2007; Vidyarthi, Arora, Schnipper, Wall, & Wachter, 2006).
This article is based on the study of sign-out between residents on the general pediatric wards of a university-based tertiary care hospital. On such wards, sign-out occurs in the morning and in the afternoon. The brief morning sign-out allows the night staff to update the incoming residents on overnight events and the status of each patient. The more comprehensive afternoon sign-out allows the outgoing residents to review with the night staff what care is required until the following morning.
Prior to the work reported here, residents had developed a Microsoft Excel®-based spreadsheet to support sign-out (Figure 1). They considered this system a reasonable means for storing and summarizing patient data for sign-out. However, the sign-out tool was manually updated by residents as they had time, and it was difficult to access because it was installed on a single, inconveniently located computer. As a result, data in the sign-out tool were not always up to date, and often, information for recently admitted patients was not included at all.
Figure 1.

Original sign-out spreadsheet.
The Excel sign-out tool had usability issues as well. Some residents were not familiar with Excel or had never received formal training on how to use the tool. Residents who were familiar with the Excel tool’s functionality complained that adding, deleting, or modifying records could be tedious, error prone, and time consuming.
Part of the problem stemmed from having to add a patient’s record to the spreadsheet while maintaining proper ordering (by room number). This required the physician to find the correct place to add the record, insert a new row, and then ensure that the room number was typed in the correct format. As Figure 1 shows, data entry over time yielded inconsistent room-numbering formats. Simple errors such as these can have serious consequences; for example, patients can be overlooked. In addition, because of the limited column fields and sizes, residents could not provide information according to their needs, personal style, the experience of the receiving physician, or the receiving physician’s familiarity with the patients on the ward (e.g., some residents prefer to include more detailed information than do others). Physicians in teaching hospitals are aware of the experience (or lack thereof) of their colleagues, such as when a senior resident (i.e., in his or her second or third year) gives sign-out to an intern (a first-year resident).
A Collaborative Design Strategy
To begin redesigning the sign-out tool, we initially focused on defining requirements for information content and functionality. We used a multifaceted approach that included focus groups, interviews, task analyses, iterative prototyping, testing, and feedback. Focus groups and interviews were conducted to help residents define the information and functional requirements for the prototype sign-out tool (Sledd, Bass, Borowitz, & Waggoner-Fountain, 2006). As residents defined additional requirements, they were incrementally implemented until a working prototype was put into use on the general wards. During this time, residents interacted with the prototype and provided feedback and additional requirements, which were iteratively incorporated into the prototype’s design.
Defining Requirements and Design of a Prototype
Information requirements
In the first round of focus groups, residents identified 6 general and 29 specific information requirements for each patient discussed during sign-out. The information requirements were refined via interviews with two pediatric chief residents. The final list of information categories consisted of 7 general information categories and 21 subcategories (see Table 1, next page).
Table 1.
Final Information Requirements
| Information Category | Information Subcategory |
|---|---|
| Patient demographics |
|
| Problem list |
|
| Medications and treatments |
|
| Test results |
|
| General plans |
|
| Contingency plans |
|
| Immediate plans |
|
In terms of the tool’s functionality, the chief residents outlined two general requirements: data entry/modification requirements and data reporting/printing requirements. Detailed requirements were then identified in focus groups with all the pediatric residents and additional meetings with only the chief residents. Based on these requirements, it was not possible to develop a working prototype using a spreadsheet format, so, for two reasons, we chose Microsoft Access® as the platform for the prototype. First, Microsoft Access offers separation of the data entry, storage, and output processes, making prototype design a “divide-and-conquer” activity. Second, Access includes design tools that help to simplify functionality for end users.
Data entry requirements
The main focus for data entry was to reduce the complexity of the process and provide flexibility not found in the existing spreadsheet tool. The list on the next page includes requirements, followed by design elements in parentheses.
Allow patients to be added to the system (using Microsoft Access, a blank patient record is always available at the bottom of the page; see Figure 2).
Allow patients to be deleted from the system (by placing the Active Record Identifier on a record and pressing the delete key; Figure 2).
Provide a separate entry space for each of the 21 information subcategories (see multiple data input areas in Figure 2).
Employ features such as drop-down menus for information subcategories that have a limited set of choices, such as “Demographics–Room Number,” or “General Plans–Discharge” (Figure 2).
Allow free text input when drop-down menus are not applicable (Figure 2).
Limit the number of characters available for free text input to maintain simplicity (Microsoft Access provides this ability when specifying data types in the database).
Initially sort records by one of the common ways residents discuss patients: by acuity (that is, the seriousness of the patient’s condition; a high-acuity patient is one in very serious or critical condition) or room number (the data entry page initially sorts patients by room number; Figure 2).
Allow records to be sorted by any of the information categories for flexibility (see insert in Figure 2).
Figure 2.

Prototype data entry page.
“On-the-fly” feedback
We sought feedback from as many end users as possible. To help achieve this goal, we built an interactive user feedback form into the data entry page. This allowed residents to give feedback on the fly while using the tool and provided an outlet for comments when interviews could not be scheduled. The comments were used throughout the process to define additional requirements and modify the prototype.
Data output/printing requirements
With respect to data output, the tool should generate and print customized reports based on resident preferences and predetermined values –for example, the time of day (morning/a.m. or afternoon/p.m.) and the sorting method for patients (by acuity or room number). Whereas Excel spreadsheets can be printed only in the format of the data entry interface, Access allows the creation of multiple reports linked to the same data table. Therefore, we designed four reports corresponding to each of the four possible combinations of the time of day and the desired sorting method. Each report could be viewed or printed via the print menu on the data entry form (Figure 3).
Figure 3.
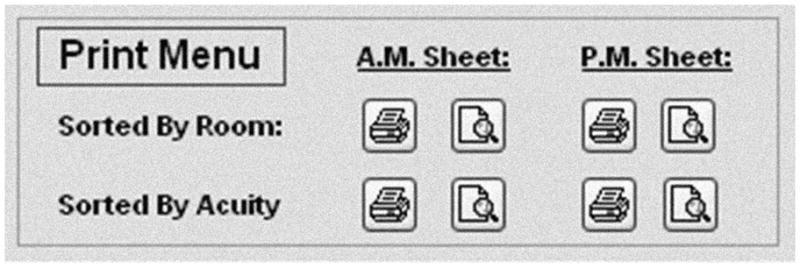
Menu for printing reports.
The design of each report (see Figure 4) was based on the resident-defined formatting requirements:
Figure 4.

Prototype sign-out report (a.m. by acuity).
Reports must be able to display at least five patients per page.
The tool must be able to shrink or expand data columns in a report, based on the amount of data entered.
The text for a patient’s name, room, and acuity must be salient (e.g., appear in bold).
The report must highlight (using text shading) the acuity of any patient categorized as high acuity as well as the discharge plan for any patient scheduled to be discharged at 9:00 a.m.
The tool must provide the pager numbers of the current rotating physicians in the footer of all sign-out reports.
Although footer information was initially included at the bottom of each printed report, the chief residents pointed out that names and numbers needed to be updated when a new rotation was under way. Therefore, we added the functionality to modify the report footer (see Figure 5, next page).
Figure 5.

Modify Report Footer page.
Additional requirements
Patients on the pediatric wards include those on the general wards service, the hematology/oncology (Heme/Onc) service, and the pediatric intensive care unit (PICU). The sign-out processes for all three services are similar, but the location, time, and residents involved vary. Comments from the feedback forms and interviews suggested that the prototype needed to support sign-out for Heme/Onc and PICU patients. Therefore, separate data entry forms, database tables, and reports – all based on the original designs – were added to the prototype for the two additional services.
Residents also requested a patient archive and a patient dictation list. The archive and dictation list were added to the tool as separate data entry forms and database tables. With new data entry forms, residents also specified the need to transfer patients’ records between the service lists, the archive, and the dictation list. Transfers were implemented in the prototype so residents could transfer one patient’s records to one location or multiple patients’ records (from one list) to multiple locations at one time.
The multiple reports designed for the Heme/Onc service were identical to those for the general wards. However, residents required only one report for the PICU service, as few patients are typically on the service at a given time. Residents did not request a report for the patient archive and requested only one report for the dictation list, similar to the PICU report.
During interviews, resident supervisors and attending physicians requested support for procedures other than sign-out. They described how the data stored in the prototype could be used to generate morning reports as well as a portion of each patient’s daily progress note. Both of these functions were added to the prototype in subsequent revisions. The morning report function displays a single report of the current and past problems for all patients admitted between two specified dates, sorted by date and service, and it is formatted with large text for output to a projector. The daily progress note required the implementation of tabs (one for sign-out, one for the daily progress note) for each patient on the data entry page for the general wards, Heme/Onc, and PICU services.
With the addition of six new reports (excluding the morning report, as residents wanted it to be a separate function), it was no longer appropriate to associate viewing or printing reports with separate buttons. Therefore, the print menu was removed in favor of a report menu that utilized drop-down menus instead of buttons to view and print reports. To organize all the functions implemented in the prototype, we developed a main menu that opened with the database (see Figure 6, previous page).
Figure 6.
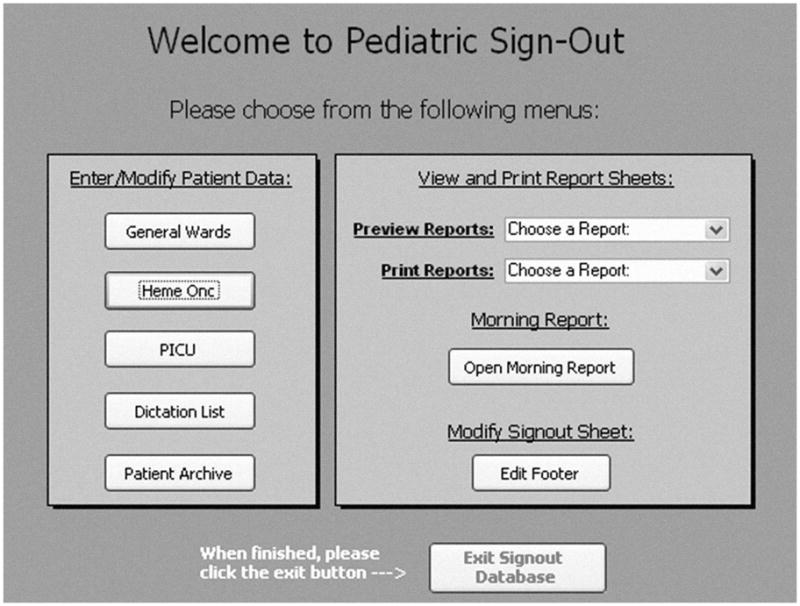
Final prototype main menu.
Comparing the Sign-Out Tools
Based on the task analyses, we utilized the keystroke-level model (KLM; Card, Moran, & Newell, 1983) to quantify the time required to complete the tasks on each of the two systems. Tables 2 through 5 (pages 25–26) provide task analyses of the spreadsheet and the prototype for two tasks common to both tools: adding a patient and modifying the report footer. For the KLM, P refers to pointing with the mouse, B to pressing or releasing the mouse button, H to moving hands between keyboard and mouse, and K to pressing a key on the keyboard. For the KLM, we collected and averaged timing data for one participant.
Table 2.
Task Analysis for Adding a Patient to the Spreadsheet
| Keystroke-Level Model | Task 1.1:Add a patient to the spreadsheet. PLAN: Do 1.1.1 then 1.1.2 then 1.1.3 (for name column) and 1.1.4 (for all other columns); repeat 1.1.1–1.1.4 (until all patients added). |
| P – B – P – B | 1.1.1: Place the patient in the correct order by room. PLAN: Do 1.1.1.1 then 1.1.1.2. |
| 1.1.1.1: Scroll to the row for the existing patient whose room number is one higher than the number for the patient to be added. | |
| P – B – P – B | 1.1.1.2: In the far left column showing the row number of the existing patient, right-click and select “insert.” |
| P – BBBB | 1.1.2: Select and double-click the desired box to edit the text column of the new row. |
| 1.1.3:Add patient identification information. PLAN: Do 1.1.3.1 then 1.1.3.2 then 1.1.3.3 then (if needed) do 1.1.3.4 and/or 1.1.3.5; repeat 1.1.3.2–1.1.3.5 until all lines are entered. |
|
| H – K | 1.1.3.1:Type the name of the patient. |
| K | 1.1.3.2: Press Alt + Enter to move to the next line. |
| K | 1.1.3.3: Enter additional text. |
| H – P – BB | 1.1.3.4: Click the “increase font size” button. |
| H – P – BB | 1.1.3.5: Click the “B” button to make the text bold. |
| 1.1.4:Add data to the text field. PLAN: Do 1.1.4.1; if desired do 1.1.4.2 and repeat until all data are entered. |
|
| H – P – BBBB – K | 1.1.4.1:Type text into box. |
| K | 1.1.4.2:To make a new line, press Alt + Enter. |
Note. P = pointing with the mouse, B = pressing or releasing the mouse button, H = moving hands between keyboard and mouse, and K = pressing a key on the keyboard.
Table 5.
Task Analysis for Modifying the Footer of the Reports in the Prototype
| Keystroke-Level Model | Task 2.2: Modify the footer of a sign-out report. PLAN: Do 2.2.1 then 2.2.2 then 2.2.3. |
| P – BB | 2.2.1: Click “modify footer” button on main menu. |
| H – P – BB – K | 2.2.2: Edit text in the text box of the “edit footer” window. |
| H – P – BB | 2.2.3: Click “return to main menu” button. |
Note. P = pointing with the mouse, B = pressing or releasing the mouse button, H = moving hands between keyboard and mouse, and K = pressing a key on the keyboard.
When a user enters patient identifying information into either system, the number of keys pressed is identical. Therefore, we modeled this as a single keystroke because there would be no difference in time, no matter how many keys were pressed. For adding a patient, the spreadsheet required completion of four plans involving 33 separate keystroke-level actions, whereas the prototype required only one plan and 9 actions. The spreadsheet required one plan and 26 keystroke-level actions to modify the footer of the printed sign-out reports, whereas the prototype required one plan and only 12 actions.
Both tasks could be completed in a much shorter time using the prototype (see Table 6, page 27). There was a larger discrepancy between the two tools for adding a patient, but overall, modifying the report footer was the more complex of the two tasks. Results such as these may explain why some residents found working with the spreadsheet to be tedious, error prone, and time consuming.
Table 6.
Predictive Klm-Based Models for Two Sign-Out Tasks
| Keystroke-Level Model | Tool | Predictive Equation | Total Time (seconds) |
|---|---|---|---|
| Add patient | Spreadsheet | Texecute = 8Tp + 16TB + 4TH + 5TK | 13.4 |
| Prototype | Texecute = 3Tp + 4TB + TH + TK | 4.4 | |
| Modify footer | Spreadsheet | Texecute = 9Tp + 14TB + 2TH + TK | 12.4 |
| Prototype | Texecute = 3Tp + 6TB + 2TH + TK | 5.0 |
Note. TP (move mouse to a point) = 1.1 seconds; TB (time to press or release mouse button) = 0.1 seconds; TH (time to home hands to keyboard or mouse) = 0.4 seconds; TK (time to press a key on the keyboard) = 0.28 seconds.
Access to the tools
One of the problems with the original sign-out tool was that it was stored on only one computer, away from the location of most patients. Therefore, updates did not occur as often as they should have, and patient information was often missing. The prototype was made available on a secure hospital server that was accessible from any computer on the pediatric wards. This change allowed residents to update the database without disruptions to their current activities. Increased accessibility, combined with the simplification of common tasks, improved efficiency.
Prototype yoga: Improving flexibility
A number of tasks implemented in the database were not available with the spreadsheet – in particular, support for sign-out on additional pediatric services and support for pediatric procedures beyond sign-out. The prototype provided five unique data entry/modification forms for patient data (sign-out and daily progress notes for three pediatric services, a patient archive, a patient dictation list, and the ability to transfer patients), compared with one form in the spreadsheet, which provided no specific method for transferring patients.
The prototype provided 11 unique presorted reports selected via drop-down menus for viewing and printing. With the old spreadsheet tool, only the current view of the data could be printed, and manual sorting was required in order to obtain different views. In addition, reports in the prototype are automatically resized based on the amount of information entered. In the spreadsheet, a user would have to format the text manually in order to adjust the size of the printed sheet.
Creating Successful Collaboration With End Users
Collaboration can be difficult when working with hard-to-reach end users, let alone trying to gain their interest in the process. However, we were able successfully to utilize a few practical strategies that are universally applicable in situations in which collaboration is necessary but difficult to achieve.
A multifaceted strategy is important. Limiting collaboration to a single strategy may isolate end users, gain the interest of only those who thrive on the method chosen, and skew feedback. Our strategy included focus groups, interviews, feedback “on the fly,” and an iterative design process. The focus groups were a central aspect for creating buy-in. In addition, the focus groups helped to create a sense of teamwork, not only between the end users and the systems engineers but also among the end users themselves. Interviews were an extension of the focus groups and enabled the designers to gain a more detailed and expert perspective of the process the tool was meant to support, a critical step toward its overall improvement.
Providing users with the opportunity to give feedback and comments in the context of using the tool was beneficial in a number of ways. First, it was a way to gather feedback in actual work situations and minimize the time in which a user had to commit his or her comments to memory before reporting them. Second, it helped users gain a sense of personal involvement and interaction in the design process and the feeling that every comment was important in relation to the final product. Finally, allowing users to provide feedback during the design of the tool was an easy way to note necessary improvements for each version that was developed, and it ultimately enabled the designers to incorporate user suggestions iteratively into the evolving prototype.
An iterative design process was essential in creating an atmosphere that did not pressure the system designers to develop a perfect tool on the first try or force the end users to “get it right” the first time either. Over time, it allowed modifications to be adapted incrementally into the prototype in an effort to shape the tool to the end users’ needs. In addition, users came to feel that they could provide negative (as well as positive) feedback without the concern that it would be detrimental to implementation of the tool or to their collaborations with the designers. An iterative process also helped reinforce and maintain the end users’ interest by periodically providing new and interesting designs to review instead of making them wait for the final product.
When designing a computerized process support tool, it is critical to understand the process clearly and develop requirements that support that process. End users must be involved early, to pique their interest; they must also be involved continuously because additional requirements become apparent after the tool or prototype is put into operation. Collaboration with end users throughout the design activities enhances buy-in to the system and encourages the users to modify and improve the process on their own.
Table 3.
Task Analysis for Adding a Patient to the Prototype
| Keystroke-Level Model | Task 1.2:Add a patient to the prototype. PLAN: Do 1.2.2 then 1.2.3 then 1.2.4 or 1.2.5 (repeat 1.2.3–1.2.5 until all desired data have been added). |
| P – BB | 1.2.2:At the bottom of the page, click the → * icon. |
| P – BB | 1.2.3: Select a data field to edit. |
| H – K | 1.2.4: (If text box) Modify text of the data field. |
| P | 1.2.5: (If drop-down) Change the selection of the drop-down menu. |
Note. P = pointing with the mouse, B = pressing or releasing the mouse button, H = moving hands between keyboard and mouse, and K = pressing a key on the keyboard.
Table 4.
Task Analysis for Modifying the Footer of the Report in the Spreadsheet
| Keystroke-Level Model | Task 2.1: Modify the footer of a sign-out report. PLAN: Do 2.1.1 then 2.1.2 then 2.1.3 then 2.1.4 then 2.1.5 then 2.1.6 then 2.1.7. |
| P – B – P – B | 2.1.1: Click View menu and select “Header and Footer.” |
| P – BB | 2.1.2: Click the “custom header” or “custom footer” button. |
| P – BB | 2.1.3: Click the “left section” text box. |
| H – P – BB – K | 2.1.4: Edit the text in the “left section” text box. |
| H – P – BB | 2.1.5: Click the “OK” button to close the editing window. |
| P – BB | 2.1.6: Click the “OK” button to close the header and footer window. |
| P – B – P – B | 2.1.7: Save changes: Select File → Save from the top menu. |
Note. P = pointing with the mouse, B = pressing or releasing the mouse button, H = moving hands between keyboard and mouse, and K = pressing a key on the keyboard.
Acknowledgments
The project described was supported in part by Grant Number T15LM009462 from the National Library of Medicine. The content is solely the responsibility of the authors and does not necessarily represent the official views of the National Library of Medicine or the National Institutes of Health.
Biographies

Justin M. DeVoge is a PhD student in the Department of Systems and Information Engineering, School of Engineering and Applied Science at the University of Virginia, where he earned his MS in systems engineering in 2006. He is studying methods for improving the sign-out process in the hospital setting. His research interests include human factors, cognitive systems engineering, instructional systems design, and database design and implementation.

Ellen J. Bass is an associate professor in the Department of Systems and Information Engineering in the School of Engineering and Applied Science at the University of Virginia. She earned a PhD in systems engineering from the Georgia Institute of Technology in 2002. Bass’s research interests include human-automation interaction, intelligent decision support systems, and intelligent learning environments. She may be reached at University of Virginia, Department of Systems and Information Engineering, 151 Engineers’ Way, Charlottesville, VA 22904, ejb4n@virginia.edu.

Richard Michael DuVal Sledd is a senior consultant with Booz Allen Hamilton. He earned his MS in systems engineering from the University of Virginia in 2006. He works in the information assurance domain, integrating security into strategic business planning to minimize the impact of disruptions to business operations. His areas of interest include quantitative analysis, human factors engineering, data mining and analysis, and system certification and accreditation.
Stephen M. Borowitz is a professor of pediatrics and public health at the University of Virginia. He has long been interested in resident and medical student education and has received many teaching awards. He has spearheaded educational initiatives involving information technology throughout the university. Borowitz obtained a BA in sociology and statistics at Tulane University and an MD at Rush Medical College; he completed pediatric residency and fellowship in pediatric gastroenterology and nutrition at Vanderbilt University.

Linda A. Waggoner-Fountain is an associate professor of pediatrics in the School of Medicine and program director for the General Pediatric Residency Training Program at the University of Virginia. She earned her MD at the University of Iowa. She completed her general pediatric residency training, chief residency, and pediatric infectious disease training at the University of Virginia. Her research interests include residency education, ambulatory infection control, and infectious issues in international adoptees and refugees.
References
- Accreditation Council for Graduate Medical Education. ACGME duty hours standards fact sheet. (n.d.) Retrieved July 30, 2007, from http://www.acgme.org/acWebsite/newsRoom/newsRm_dutyHours.asp.
- Borowitz SM, Waggoner-Fountain LA, Bass EJ, Sledd RMD. Adequacy of information transferred at resident sign-out (inhospital handover of care): A prospective survey. Quality and Safety in Health Care. 2008;17:6–10. doi: 10.1136/qshc.2006.019273. [DOI] [PubMed] [Google Scholar]
- Card S, Moran T, Newell A. The psychology of human-computer interaction. Mahwah, NJ: Erlbaum; 1983. [Google Scholar]
- Hooper K. Architectural design: An analogy. In: Norman DA, Draper SW, editors. User centered system design. Mahwah, NJ: Erlbaum; 1986. pp. 9–23. [Google Scholar]
- Horwitz LI, Krumholz HM, Green ML, Huot SJ. Transfers of patient care between house staff on internal medicine wards: A national survey. Archives of Internal Medicine. 2006;166:1173–1177. doi: 10.1001/archinte.166.11.1173. [DOI] [PubMed] [Google Scholar]
- Okie S. An elusive balance – Resident work hours and the continuity of care. New England Journal of Medicine. 2007;356:2665–2667. doi: 10.1056/NEJMp078085. [DOI] [PubMed] [Google Scholar]
- Sledd RMD, Bass EJ, Borowitz SM, Waggoner-Fountain LA. Characterization of sign out in pediatric acute care wards to inform process improvement. Proceedings of the Human Factors and Ergonomics Society 50th Annual Meeting; Santa Monica, CA: Human Factors and Ergonomics Society; 2006. pp. 1068–1072. [Google Scholar]
- Vidyarthi AR, Arora V, Schnipper JL, Wall SD, Wachter RM. Managing discontinuity in academic medical centers: Strategies for safe and effective resident sign-out. Journal of Hospital Medicine. 2006;1:257–266. doi: 10.1002/jhm.103. [DOI] [PubMed] [Google Scholar]