Abstract
Tumor microenvironments feature immune inhibitory mechanisms that prevent T cells from generating effective antitumor immune responses. Therapeutic interventions aimed at disrupting these inhibitory mechanisms have been shown to enhance antitumor immunity, but they lack direct cytotoxic effects. Here, we investigated the effect of cytotoxic cancer chemotherapeutics on immune inhibitory pathways. We observed that exposure to platinum-based chemotherapeutics markedly reduced expression of the T cell inhibitory molecule programmed death receptor-ligand 2 (PD-L2) on both human DCs and human tumor cells. Downregulation of PD-L2 resulted in enhanced antigen-specific proliferation and Th1 cytokine secretion as well as enhanced recognition of tumor cells by T cells. Further analysis revealed that STAT6 controlled downregulation of PD-L2. Consistent with these data, patients with STAT6-expressing head and neck cancer displayed enhanced recurrence-free survival upon treatment with cisplatin-based chemoradiation compared with patients with STAT6-negative tumors, demonstrating the clinical relevance of platinum-induced STAT6 modulation. We therefore conclude that platinum-based anticancer drugs can enhance the immunostimulatory potential of DCs and decrease the immunosuppressive capability of tumor cells. This dual action of platinum compounds may extend their therapeutic application in cancer patients and provides a rationale for their use in combination with immunostimulatory compounds.
Introduction
Recently, it has become evident that chemotherapeutic drugs not only have a direct cytotoxic effect on tumor cells but may also potentiate the immune system via so-called off-target effects (1, 2). For example, direct immune-activating effects of cancer chemotherapy have been observed: treatment with low concentrations of several chemotherapeutics resulted in increased antigen cross-presentation, T lymphocyte expansion, and T cell infiltration of tumors by to-date-unknown molecular mechanisms (3, 4). In addition, the cytotoxic drug oxaliplatin was shown to induce an immunogenic type of cell death in a TLR4/high-mobility group box 1–dependent manner (5, 6). However, the effect of treatment with cancer chemotherapeutics on immune inhibitory pathways that play a crucial role in tumor immune escape is unknown (7).
We hypothesized that anticancer chemotherapeutics may influence the type of T cell–mediated immune responses induced by DCs by acting on immune inhibitory pathways. Here we demonstrate that platinum-based chemotherapeutics downregulate the inhibitory molecule programmed death receptor-ligand 2 (PD-L2) in a STAT6-dependent manner, both on DCs and on tumor cells, resulting in enhanced T cell activation and increased tumor cell recognition. The clinical relevance of these observations is underpinned by our finding in head and neck cancer patients that tumor STAT6 expression is correlated with an improved clinical outcome when these patients received platinum-based radiochemotherapy, but not when these patients were treated with radiotherapy only. These findings provide a rationale for the use of platinum-based chemotherapy in combination with other immunostimulatory compounds to increase the clinical efficacy of cancer treatment.
Results
The T cell–stimulating potential of DCs is enhanced by platinum-based chemotherapy.
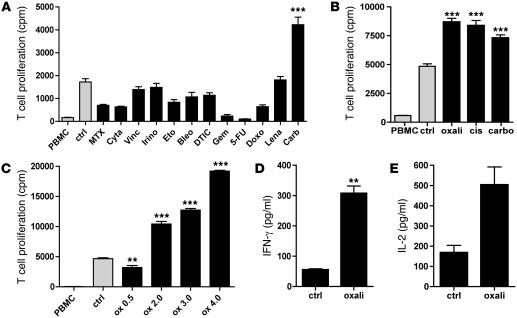
We first determined the effect of a large number of clinically relevant concentrations of chemotherapeutic agents on the allogeneic T cell stimulatory potential of monocyte-derived DCs (Supplemental Table 1; supplemental material available online with this article; doi: 10.1172/JCI43656DS1). Surprisingly, DCs exposed to carboplatin during their maturation by cytokines induced a significantly higher T cell proliferation compared with all other chemotherapeutics tested (Figure 1A). We also observed this similar enhanced immune-stimulating activity in a dose-dependent manner for the platinum compounds oxaliplatin and cisplatin, which are frequently used in the clinic (Figure 1, B and C, and Supplemental Table 1). T cells that were activated by DCs exposed to platinum compounds produced significantly higher levels of IFN-γ and IL-2 compared with untreated DCs (Figure 1, D and E).
Figure 1. DCs exposed to platinum-based chemotherapy display enhanced allogeneic T cell stimulatory capacity.
(A) DCs were cultured in clinically relevant concentrations of chemotherapeutics during 48 hours of cytokine maturation and subsequently used in a mixed lymphocyte reaction with allogeneic PBMCs. T cell proliferation was measured by 3H-thymidine incorporation after 5 days. Ctrl, control DCs (nontreated); MTX, methotrexate; Cyta, cytarabine; Vinc, vincristine; Irino, irinotecan; Eto, etoposide; Bleo, bleomycin; DTIC, dacarbazine; Gem, gemcitabine; 5-FU, 5-fluorouracil; Doxo, doxorubicin; Lena, lenalidomide; Carb, carboplatin. For all proliferation experiments, the statistical analyses were performed against the control unless otherwise specified in the figure; the mean of 6 replicates per experiment and the SEM are depicted. A representative experiment is shown. n = 3. **P < 0.01; ***P < 0.001. (B) Same experiment with different platinum-based chemotherapeutics. Oxali, oxaliplatin; cis, cisplatin. A representative experiment is shown. n = 3. (C) Concentration-dependent effect of platinum exposure on T cell stimulatory potential of DCs. This effect was observed irrespective of whether the platinum drugs were added during or after DC maturation (data not shown). Oxaliplatin concentrations 0.5, 2.0, 3.0, and 4.0 μg/ml. A representative experiment is shown. n = 5. (D and E) IFN-γ and IL-2 secretion by T cells in MLR upon exposure to DCs cultured with or without platinum. A representative experiment is shown. n = 3. In the IL-2 experiment, the P value was 0.07, but the difference may be important in a microenvironment of marked T cell proliferation and hence increased IL-2 consumption. Data are depicted as mean + SEM.
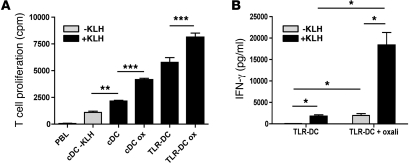
Notably, this increased T cell–stimulating activity of platinum-treated DCs was also observed in antigen-specific T cells using keyhole limpet hemocyanin (KLH) as a model antigen (Figure 2A). Moreover, we observed that the T cell stimulatory capacity of DCs matured in vitro through TLRs instead of cytokines was also further enhanced by platinum exposure (Figure 2A). The observed effect on TLR-DCs was not only limited to enhanced T cell proliferation but also supported by abundant IFN-γ production by these antigen-specific T cells (Figure 2B). Although the platinum-induced immunogenic effect is more pronounced in TLR ligand–matured DCs, the background T cell proliferation and IFN-γ production is also more elevated when DCs were activated with TLR ligands. Therefore, we conclude that the observed effect of platinum compounds is independent from stimuli used to activate and/or mature DCs.
Figure 2. Enhanced T cell stimulatory potential of DCs matured with cytokines or TLR ligands in the presence of platinum chemotherapy in an antigen-specific model.
(A) KLH-specific T cells were cocultured with KLH-loaded DCs, matured with cytokines or R848 and poly(I:C), in the presence or absence of platinum chemotherapy. cDC, cytokine-matured DCs; TLR-DC, TLR ligand–matured DCs; Ox, oxaliplatin. A representative experiment is shown. n = 3. (B) Enhanced IFN-γ secretion by T cells in MLR upon exposure to TLR ligand–matured DCs cultured with platinum as compared with platinum-untreated DCs. A representative experiment is shown. n = 3. *P < 0.05; **P < 0.01; ***P < 0.001. Data are depicted as mean + SEM.
The enhanced immunogenicity of platinum-treated DCs is dependent on PD-L2/STAT6.
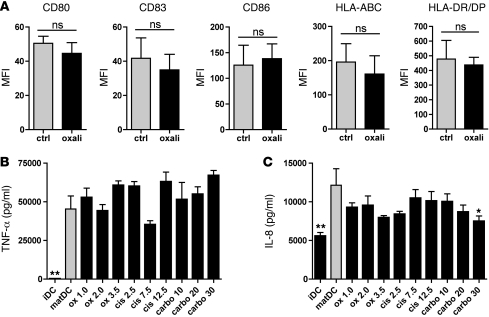
To investigate why platinum-treated DCs display enhanced immunogenicity, we determined their phenotype (Figure 3A, shows effects of oxaliplatin; similar results were obtained with carboplatin and cisplatin, not shown). No significant differences were observed in expression of MHC class I and II or the costimulatory molecules CD80 and CD86 on platinum-treated versus nontreated DCs. Although we detected fluctuations in pro- and antiinflammatory cytokine production of DCs matured in the presence of platinum compounds (Figure 3, B and C, and Supplemental Figure 1), these differences were very small and not consistent for all platinum compounds, and they did not correlate with enhanced T cell activation. We therefore concluded that the enhanced immunogenicity is not caused by increased expression of MHC or costimulatory molecules or by increased proinflammatory cytokine secretion upon platinum treatment.
Figure 3. Platinum compounds do not alter DC costimulatory molecule expression or cytokine secretion.
(A) Expression of MHC class I and II, costimulatory molecules CD80, CD83, and CD86 by DCs exposed to 2.0 μg/ml oxaliplatin during maturation as compared with untreated mature DCs.The MFIs of positive cells are shown as compared with platinum-untreated cells with SEMs, for 3 independent experiments for HLA class I and II and for 5 independent experiments for CD80, CD83, and CD86. (B and C) Production of proinflammatory cytokines TNF-α and IL-8 by DCs exposed to platinum chemotherapy during maturation. Supernatants were harvested 24 hours after stimulation. Means with SEMs of 3 separate experiments are shown. *P < 0.05; **P < 0.01. Data are depicted as mean + SEM.
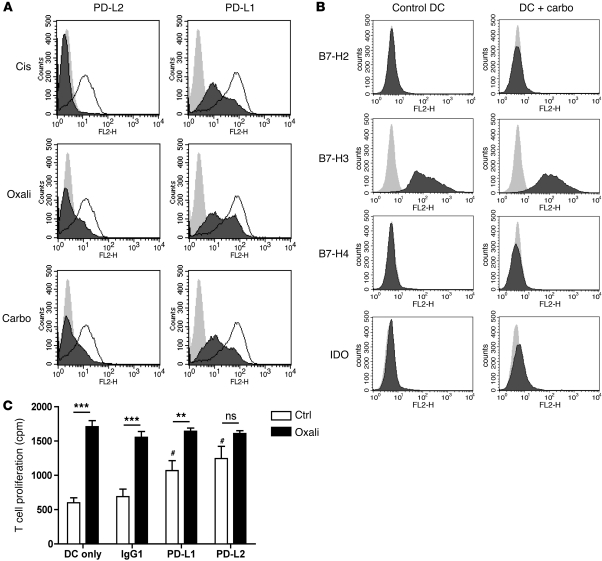
Since DCs can also express several T cell inhibitory molecules, including PD-L1 and PD-L2, the enhanced T cell stimulatory potential upon platinum exposure could result from decreased PD-L expression. Indeed, treatment with oxaliplatin, cisplatin, or carboplatin during DC maturation moderately reduced the expression of PD-L1 and profoundly reduced the expression of PD-L2 (Figure 4A). We did not observe these effects with other tested chemotherapeutic agents. Expression of other known inhibitory receptors remained unaltered upon platinum treatment (Figure 4B). Blocking of the PD-1/PD-L1/PD-L2 axis by anti–PD-L1 and –PD-L2 antibodies enhanced the capacity of mature DCs to stimulate T cells to a similar level when compared with platinum-treated DCs. However, the increased allostimulatory potential of DCs upon platinum treatment was abolished in the presence of PD-L2 antibodies (Figure 4C). This strongly supports the notion that downregulation of PD-L1, and particularly PD-L2, is a major cause of the enhanced T cell stimulatory capacity of platinum-treated DCs.
Figure 4. Platinum-based chemotherapeutics downregulate PD-L2 expression on DCs, resulting in enhanced T cell activation.
(A and B) Expression of T cell inhibitory molecules PD-L1 and PD-L2 (light gray, isotype; white, untreated DC; dark gray, platinum-treated DC) and B7-H2/H3/H4 and IDO by DCs exposed to platinum chemotherapy during maturation. A representative experiment is shown. n > 5 for PD-Ls; n = 2 for other inhibitory molecules. (C) MLR with DCs matured in the presence (black bars) or absence (white bars) of 5 μg/ml oxaliplatin in the presence of blocking antibodies against PD-L1, PD-L2, or control immunoglobulin. #P < 0.05, compared with IgG control DCs; **P < 0.01; ***P < 0.001. A representative experiment is shown. n = 3. Data are depicted as mean + SEM.
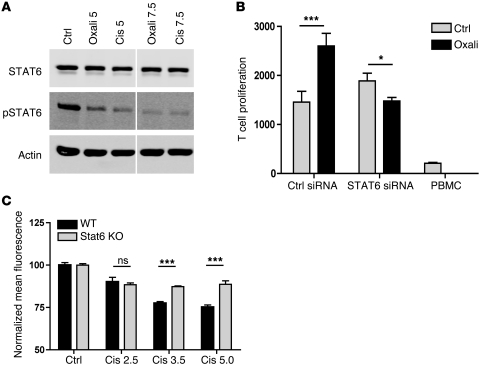
The most important regulator of PD-L2 is the molecule STAT6. Macrophages from Stat6–/– mice are virtually unable to express PD-L2 (8). DCs from NF-κB p50–/–p65–/+ mice also have defective PD-L2 upregulation upon activation (9). Therefore, we measured STAT6 and phosphorylated (active) STAT6 expression in DCs treated with or without platinum chemotherapy. We observed that treatment of DCs with platinum compounds resulted in a strong decrease in phosphorylated STAT6 (Figure 5A). To investigate whether the STAT6 dephosphorylation was the cause of the observed enhanced immunogenicity of DCs upon platinum exposure, we tested the T cell stimulatory activity of platinum-treated DCs exploiting siRNA against STAT6 (Figure 5B and Supplemental Figure 2). Despite the fact that inhibition was not complete, Stat6 knockdown DCs now lacked the previously observed enhanced T cell response upon platinum treatment, whereas DCs transfected with control siRNA still exhibited that response. To confirm that platinum-induced Stat6 dephosphorylation indeed mediated the observed PD-L2 downregulation, we cultured bone marrow–derived DCs from Stat6–/– and wild-type BALB/C mice in the absence or presence of platinum chemotherapeutics (Figure 5C). We found that PD-L2 was significantly more downregulated upon platinum exposure in wild-type DCs when compared with Stat6–/– DCs. Together, these data provide evidence that the enhanced immunogenicity of platinum-treated DCs depends on inactivation of STAT6 resulting in downregulation of PD-L2.
Figure 5. Enhanced T cell activation by DCs upon platinum exposure is mediated through STAT6 dephosphorylation.
(A) Western blot analysis of cytokine-matured DCs treated for 24 hours with 5 or 7.5 μg/ml cisplatin or oxaliplatin or medium during maturation. Blot lanes were run on the same gel but were noncontiguous (white line). (B) MLR with DCs that were transfected with STAT6 siRNA or control siRNA and subsequently matured with or without 5 μg/ml oxaliplatin. A representative experiment is shown. n = 3. (C) PD-L2 expression of BM-derived CD11c+ IL-4/LPS–stimulated DCs from wild-type and Stat6–/– BALB/c mice, cultured in the presence or absence of cisplatin. Depicted are the normalized MFI and SEM of 1 of 2 independent experiments performed in triplicate. *P < 0.05; ***P < 0.001.
Platinum dephosphorylates STAT6 in tumor cells, resulting in decreased PD-L2 and subsequent increased T cell recognition.
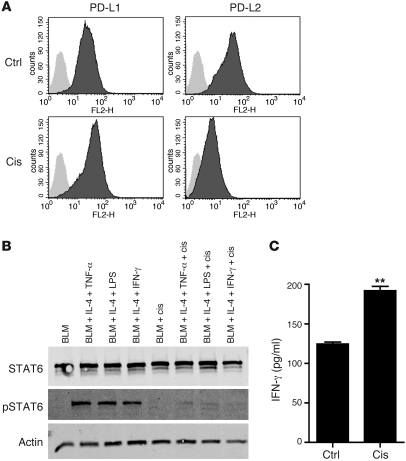
Since many cancer cells are capable of inducing an immunosuppressive microenvironment and upregulating PD-Ls in order to evade antitumor immunity (10), we next tested to determine whether the same platinum compounds also affected PD-L expression on tumor cells. To mimic an immunosuppressive microenvironment in vitro, we exposed BLM melanoma cells to cytokine combinations known to induce PD-L1/2 expression on endothelial cells, i.e., IL-4 together with IFN-γ, LPS, or TNF-α (11). Subsequent exposure to platinum compounds clearly reversed PD-L2 expression, but not PD-L1 expression (Figure 6A and Supplemental Figure 3).
Figure 6. Platinum-based chemotherapeutics downregulate PD-L2 on tumor cells via STAT6 dephosphorylation, resulting in enhanced tumor cell recognition by tumor antigen–specific T cells.
(A) PD-L1 and PD-L2 expression by BLM melanoma cells cultured in IL-4 and IFN-γ with or without platinum chemotherapy for 24 hours. cis, 10 μg/ml cisplatin. A representative experiment is shown. n = 5. (B) Western blot of BLM melanoma cells treated with or without IL-4, IFN-γ, LPS, TNF-α, and 20 μg/ml cisplatin for 8 hours, as indicated. A representative experiment is shown. n = 5. (C) IFN-γ production of gp100-specific T cells upon coculture with gp100-expressing BLM melanoma cells, preincubated with or without 10 μg/ml cisplatin for 24 hours. A representative experiment is shown. n = 3. **P < 0.01. Data are depicted as mean + SEM.
Because PD-L2 is regulated by STAT6 and NF-κB (8, 9, 12), we measured protein levels of STAT6 and phosphorylated (active) STAT6 in BLM tumor cells upon coculture with IL-4 and several NF-κB–activating stimuli (Figure 6B and Supplemental Figure 4). We found that cisplatin caused a strong dephosphorylation of STAT6. Although several STAT molecules are constitutively expressed in multiple types of cancer and play an important role in the proliferative capacity and antiapoptotic and immune-evasive potential of cancer cells (13), a direct STAT-inactivating mechanism in cancer cells induced by clinically used cytotoxic chemotherapy has not been reported before.
To further explore whether chemotherapy-induced reversal of an immunosuppressive tumor microenvironment not only reduces PD-L2, but also effectively enhances susceptibility of tumor cells to cytotoxic T cells, we compared the recognition of platinum-treated and nontreated gp100 antigen expressing melanoma cells by gp100-specific T cells (14). As expected, we observed that platinum-induced reduction of PD-L2 coincides with enhanced T cell recognition as measured by antigen-specific IFN-γ production (Figure 6C). Together, these findings indicate that platinum compounds not only directly affect immune cells, but also modulate an immunosuppressive microenvironment by dephosphorylating STAT6 in tumors, resulting in downregulation of PD-L2 and subsequent enhanced tumor cell recognition by cytotoxic T lymphocytes.
Tumor STAT6 dictates response to platinum-based cancer treatment.
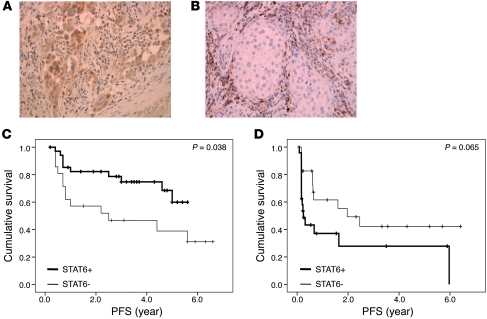
Finally, to verify the clinical relevance of platinum-induced STAT6 modulation in tumor cells in cancer patients, we analyzed tumor STAT6 expression in a cohort of patients with squamous cell carcinoma of the head and neck that had been treated in our institute with cisplatin in combination with radiotherapy (Figure 7, A and B, and Supplemental Table 2). We could exclude a possible effect of radiotherapy on STAT6 activation by in vitro analysis of IL-4–induced STAT6 phosphorylation in tumor cells, either irradiated or not (Supplemental Figure 5). After a median follow-up of 68 months, we observed a clinically highly relevant and statistically significant difference between patients with STAT6-negative tumors and STAT6-positive tumors with a 3-year recurrence-free survival of 48% and 80%, respectively (Figure 7C). In a matched cohort of patients that had been treated during that same period with radiotherapy only, tumor STAT6 expression was not correlated with an improved clinical outcome (Figure 7D). Rather, there was a clear trend toward a shorter progression-free survival. This could be explained by the immune-evasive potential of STAT6-expressing tumor cells, if not attacked by platinum-based chemotherapy. These data demonstrate the significance of platinum-induced STAT6 modulation in the tumor microenvironment in cancer patients.
Figure 7. Tumor STAT6 dictates clinical response to platinum-based therapy in cancer patients.
(A) STAT6 expression by squamous cell carcinoma of the head and neck. (B) STAT6-negative tumor with immune infiltrates as internal positive control. Original magnification, ×250. (C) Kaplan-Meier estimates of recurrence-free survival of patients with (n = 35) or without (n = 21) tumor STAT6 expression (P = 0.038). The time to recurrence was analyzed in a cohort of head and neck cancer patients that had been treated with cisplatin and radiotherapy in our institute in the period of 2003–2007. (D) Kaplan-Meier estimates of recurrence-free survival of patients with (n = 24) or without (n = 24) tumor STAT6 expression (P = 0.065). The time to recurrence was analyzed in a cohort of head and neck cancer patients that had been treated with radiotherapy alone in our institute in the period of 2000–2009.
Discussion
Platinum-based chemotherapy represents a cornerstone in the systemic treatment of many types of cancer (15). Recent observations suggest that, beside their direct cytotoxic effects, platinum anticancer drugs may also exert their clinical effect through indirect activation of the immune system via induction of an immunogenic type of tumor cell death (5, 6, 16). Furthermore, it has been reported that tumor sensitivity to T cell killing can be increased by platinum due to upregulation of tumor mannose-6-phosphatase receptors (17). Other examples of immunogenic effects of cancer chemotherapy include enhanced antigen presentation by gemcitabine, paclitaxel, and anthracyclines (3, 4); and enhanced homeostatic lymphocyte proliferation and specific tumor infiltration by cyclophosphamide (18). Depletion of myeloid-derived suppressor cells has been described for fluoropyrimidines (19), and depletion of regulatory T cells has been reported for cyclophosphamide (20). So far, the effect of cytotoxic anticancer drugs on inhibitory immunological pathways has not been described before.
The PD-1/PD-L pathway is of pivotal importance in regulating the immune balance between T cell activation and inhibition (10). High PD-L expression by antigen-presenting DCs can result in the induction of tolerant or anergic T cells (10, 21, 22). A wide variety of human cancers express PD-Ls, which are known to correlate with poor prognosis (23–26). Antibody blockade of the PD-1/PD-L pathway results in enhanced tumor-specific T cell expansion and activation (27, 28). Our findings show that treatment with platinum compounds downregulates these PD-L inhibitory molecules, which not only results in enhanced T cell stimulation by DCs, but at the same time enhances the sensitivity of the tumor for lysis by cytotoxic T cells. The importance of our findings is underscored by recent evidence that not only proinflammatory cytokines such as TNF-α (29), but also IL-4 and IL-13, are abundantly present in the tumor microenvironment and induce phosphorylation of STAT6 in tumor cells, resulting in an incompetent Th2 type of immune milieu (30). We propose that platinum-based chemotherapy may revert this incompetent Th2 into effective Th1 antitumor immunity.
While the results of this initial clinical study indicate that STAT6 modulation is of major importance for the antitumor effect of platinum chemotherapy, a prospective trial is needed to truly assess the predictive value of STAT6 expression for tumor platinum sensitivity. In addition, we cannot exclude the possibility that besides PD-L2, other unknown factors in the tumor environment are affected by platinum-induced STAT6 dephosphorylation and may contribute to the observed effect. More research on the effects of platinum-induced STAT6 dephosphorylation is therefore warranted.
In conclusion, our findings may contribute to the design of innovative treatment schedules for cancer patients by the combination of platinum compounds with known immunotherapeutic approaches.
Methods
DC culture.
Peripheral blood mononuclear cells were obtained from leukapheresis material from melanoma and colorectal cancer patients participating in clinical DC vaccination studies (NCT00243529 and NCT00228189; http://clinicaltrials.gov/) (31, 32). The studies were reviewed and approved by our Institutional Review Board (Committee on Research Involving Human Subjects Region Arnhem-Nijmegen, Nijmegen, The Netherlands), and informed consent for experimental use of the cells was obtained from all patients. DCs were generated from adherent peripheral blood mononuclear cells by culturing in X-VIVO 15 medium (Lonza) supplemented with 2% human serum (Sanquin) in the presence of IL-4 (500 U/ml) and granulocyte-monocyte CSF (800 U/ml, both Strathmann), as previously described (33).
For experiments concerning KLH-specific immune responses, the DCs were loaded on day 3 of the culture with KLH (10 μg/ml; Calbiochem).
At day 5, DCs were matured with a cytokine cocktail (PGE2, 10 μg/ml [Pfizer]; TNF-α, 10 ng/ml, IL-1β, 5 g/ml, and IL-6, 15 ng/ml [all CellGenix]) or with TLR3 and TLR7 ligands (poly[I:C], 20 μg/ml [Sigma-Aldrich]; and R848, 3 μg/ml [Axxora]) for 48 hours. Chemotherapy was added either after the maturation or during the maturation, as indicated. Supernatants were harvested after 24 hours for cytokine analysis.
Mixed lymphocyte reaction.
DCs were plated in sterile 96-well U-bottom plates (Corning), 2 × 10⁴/well in RPMI medium (Invitrogen), supplemented with 5% human serum. Peripheral blood mononuclear cells of a healthy voluntary donor were freshly isolated by density gradient centrifugation and added to the wells, 1 × 10⁵/well. Supernatants were harvested after 48 hours for cytokine analysis, as indicated. After 5 days, 1 μCi/well of 3H-thymidine was added to the culture for 8 hours, after which proliferation was stopped by storing the culture plate at –20°C. Incorporation of 3H-thymidine was measured in a β-counter.
In some experiments, blocking antibodies against PD-L1 and PD-L2 (both from eBioscience) were added to the culture in a final concentration of 10 μg/ml, as indicated. Normal mouse serum was used as isotype control. Antibodies against PD-L1 and PD-L2 were preincubated with the DCs for 30 minutes before adding the PBMCs.
Cytokine measurement and flow cytometry.
Cytokine production was measured by cytometric bead array in the supernatants of the mixed lymphocyte reaction (MLR) (Th1/Th2 Cytokine CBA 1; BD Biosciences — Pharmingen or Flowcytomix BenderMed) or DC culture (Inflammation Kit CBA; BD Biosciences — Pharmingen or Flowcytomix, BenderMed).
Flow cytometry.
The following antibodies were used for analysis of DC and tumor cell phenotype: HLA-ABC (hybridoma W6/32), HLA-DR/DP (hybridoma Q5/13), CD80, CD86, (all BD), CD83 (Beckman Coulter), PD-L1-PE (eBioscience), PD-L2-PE, and IgG1-PE (both BD). The following antibodies were used for analysis of murine BM-DC phenotype: PD-L2–PE (CD 273, eBioscience), IgG2A-PE (eBioscience), CD11c-APC (Biolegend), and IgG1-APC (BD).
Tumor cell culture.
The human melanoma cell line BLM was cultured in DMEM medium (Invitrogen) supplemented with penicillin G, streptomycin sulfate, and amphotericin B (Invitrogen) and 7% human serum, in a concentration of 0.5 × 10⁶ cells in T25 flasks or 1 × 10⁶ cells in T75 flasks (Corning). Twice weekly, the cells were harvested and plated again at 1:10.
For PD-L expression upon platinum treatment, cells were cultured in the presence of oxaliplatin, carboplatin, and cisplatin in concentrations as indicated. After 24 hours, the cells were washed twice with PBS, after which trypsin (Invitrogen) was added for 30 seconds; this was then blocked with human serum–containing medium. Then the cells were harvested and analyzed by flow cytometry.
For phosphorylated STAT6/SHP-1 Western blot analysis, cells were activated for 30 minutes to 24 hours (as indicated) with IL-4 (300 U/ml; Strathmann) and/or IFN-γ (400 U/ml; Endogen) with or without 10 μg/ml cisplatin (added 15 minutes before the IL-4/IFN-γ). This was done in 5 ml medium in T25 flasks for each condition. After 30 minutes of activation, the cells were washed twice with PBS, after which trypsine (Invitrogen) was added for 30 seconds; this was blocked with the human serum-containing medium. Then the cells were harvested. For Western blot analysis, cells were washed twice in PBS, centrifuged at 300 g for 5 minutes, and lysed in ice-cold lysis buffer (see below).
In some experiments, BLM cells were harvested and subsequently irradiated (30 or 60 Gy). Cells were plated in 6-well plates and stimulated with IL-4 for the indicated time points. STAT6 expression and phosphorylation were determined by Western blot (see below).
In vitro chemotherapy treatment.
The chemotherapeutic agents that were used in the experiments are indicated in Supplemental Table 1. All drugs were used in clinically meaningful concentrations.
Transfection of siRNA against STAT6.
siRNA (ON-TARGETplus) for the STAT6 gene was obtained from Dharmacon. In the case of DCs, approximately 1 × 10⁶ immature monocyte-derived DCs were replated on day 3 in a well of a 24-well plate and transfected at day 5 with 2 μM siRNA and 6 μl DharmaFECT4 transfection reagent, essentially following the manufacturer's directions. Knockdown efficiency was assessed at the protein level by means of Western blot analysis. Cells were stimulated on day 6 with poly(I:C) and R848, and 48 hours after stimulation, these cells were used in mixed lymphocyte reactions, as described above.
Preparation of protein lysates and Western blotting.
Regardless of cell type, 1 × 10⁶ cells were lysed in 100 μl phosphatase-inhibiting lysis buffer containing 10 mM Tris/HCl, pH 7.8, 5 mM EDTA, 50 mM NaCl, 1 mM Na3VO4, 10 mM pyrophosphate, 50 mM NaF, 1% Triton X-100, 1 mM PMSF, 10 μg/ml aprotinin, 10 μg/ml leupeptin, and 1X Roche protease inhibitor cocktail (Roche Diagnostics Nederland BV). Before polyacrylamide gel electrophoresis, reducing sample buffer (62.5 mM Tris/HCl, pH 6.8, 25% v/v glycerol, 2% w/v sodium dodecyl sulfate, 0.01% w/v bromophenol blue, 5% v/v/β-mercaptoethanol) was added 1:1 to a lysate equivalent of approximately 200,000 cells. Samples were subjected to polyacrylamide gel electrophoresis using the Mini-PROTEAN system (Bio-Rad) and further processed for Western blot analysis (34). After blocking, membranes were incubated with one of the following antibodies: mouse monoclonal anti–β-actin (1:10,000; Sigma-Aldrich), mouse monoclonal anti-pSTAT6 (pY641, 1:250; BD Biosciences — Pharmingen), or rabbit polyclonal anti-STAT6 antibody (S-20, 1:500; Santa Cruz Biotechnology Inc.). After washing, the membranes were incubated with polyclonal goat anti-rabbit Alexa Fluor 680 (Molecular Probes) and goat anti-mouse IRDye 800CW (LI-COR Biosciences) as a secondary antibody, and analyzed with the LI-COR Odyssey Imaging system (LI-COR Biosciences). Integrated intensities were analyzed using Excel (Microsoft). Whenever necessary, membranes were stripped in 0.2 M glycine/1% w/v sodium dodecyl sulfate, pH 2.5, blocked, and reprobed and processed as described above.
Preparation and culture of murine wild-type and Stat6–/– DCs.
Stat6–/– BALB/c mice were obtained from Charles River WIGA. They were kept under specific pathogen–free conditions in the animal facility of Radboud University Nijmegen Medical Centre. All animal experiments were approved by the Animal Experimental Committee of the Radboud University Nijmegen Medical Centre and were performed in accordance with institutional and national guidelines. For generation of bone marrow–derived DCs, bone marrow cells were prepared and cultured in BM-DC medium (Iscove’s modified DMEM, supplemented with 10% heat inactivated FCS, 50 mM β-mercaptoethanol) supplemented with 10 ng/ml recombinant mouse GM-CSF. Fresh GM-CSF was given on day 3. Nonadherent and loosely adherent clusters of proliferating DCs were harvested on day 6, resuspended in fresh BM-DC medium containing 10 ng/ml GM-CSF and 20 ng/ml IL-4, and matured by addition of 100 ng/ml LPS with or without cisplatin in 6-well plates. After 24 hours, nonadherent DCs were harvested and the expression of PD-L2 on CD11c DCs was determined by flow cytometry.
Generation of CD8+ gp100-specific T cells.
The vectors pGEM4Z-TCRα296 and pGEM4Z-TCRβ296, a gift from N. Schaft (University Hospital Erlangen, Erlangen, Germany), encode the TCR-α and -β chains originating from a gp100:280-288/HLA-A2–specific CTL clone (35). gp100-specific T cells were generated by transferring the TCR-α and -β chain to T cells by electroporation of RNA, resulting in transient expression of the TCR chains as described previously (36). Briefly, the DNA vectors were linearized with SpeI enzyme and purified by phenol/chloroform extraction and ethanol precipitation and used as DNA templates for in vitro transcription. In vitro RNA synthesis was done with T7 RNA polymerase (mMESSAGE mMACHINE T7 kit; Ambion) according to the manufacturer’s instructions. After DNase treatment, RNA was purified by phenol/chloroform extraction and isopropanol precipitation. RNA concentration was measured spectrophotometrically, and RNA was stored at –20°C. RNA quality was verified by agarose gel electrophoresis.
CD8+ T cells were isolated from PBMCs of an HLA-A2.1–positive donor. Monocytes were removed via adherence, and CD8+ T cells were isolated from the nonadherent cell population by positive isolation using FITC-conjugated anti-human CD8 (BD Biosciences) and anti-FITC microbeads (Anti-FITC Multisort Kit; Miltenyi Biotec) according to the manufacturer’s instructions.
For RNA electroporation, the CD8+ T cells were washed once with PBS and once with OptiMEM without phenol red (Invitrogen). 10 to 12 × 106 cells were incubated for 3 minutes with 15–20 μg of RNA in 200 μl OptiMEM in a 4-mm cuvette (Bio-Rad). Subsequently, cells were pulsed in a Gene Pulser Xcell (Bio-Rad). Pulse conditions were square-wave pulse, 500 V, 5 ms. Immediately after electroporation, the cells were transferred to X-VIVO-15 medium without phenol red (Cambrex) supplemented with 2% human serum. After 4 hours incubation at 37°C, cells were washed and frozen in FCS and 10% DMSO in liquid nitrogen. Expression of the gp100 TCR in the T cells was verified by flow cytometry using PE-conjugated anti-TCRVβ14 mAb (Coulter Immunotech), which recognizes the gp100 TCR, the results of which we have reported previously (37). Functionality of the gp100-specific T cells was shown by upregulation of the early activation marker CD69 after overnight stimulation with gp100:280–288 peptide–loaded HLA-A2+ immature DCs.
gp100-specific activation of CD8+ T cells.
For gp100-specific activation, BLM cells and BLM-gp100 (ref. 14) were activated for 20 hours with IL-4 (300 U/ml; Strathmann) and/or IFN-γ (400 U/ml; Endogen) with or without 5 μg/ml cisplatin (added 15 minutes before IL-4/IFN-γ). After 20 hours of activation, BLM-gp100 or BLM (7 × 10³ per well) was washed and coincubated with CD8+ gp100:280–288–specific T cells (5 × 10⁴ per well) in round-bottom 96-well plates. After overnight incubation, IFN-γ production was measured using a standard sandwich ELISA. gp100-specific T cells produced no IFN-γ when cocultured with BLM melanoma cells that were not transfected with gp100 (not shown). The following Abs were used: coating Ab: mouse-IgG1-anti-hIFN-γ (clone 2G1; Pierce); detection Ab: biotinylated mouse-IgG1–anti-hIFN-γ (clone B133.5; Pierce). Streptavidin-HRP and TMB were used as enzyme and substrate, respectively.
STAT6 staining of tumor sections.
Paraffin-embedded slides of 58 patients with locally advanced squamous cell carcinoma of the head and neck that had been treated with cisplatin (weekly 40 mg/m2) in combination with accelerated radiotherapy were stained for STAT6 expression. Inflammatory cells that stain for STAT6 were used as internal control. Percentage of tumor cells with cytoplasmic staining, regardless of intensity, was estimated. Based on the distribution, 50% positive cells was chosen as cut-off level: tumors were considered STAT6-positive when more than 50% of the cells had cytoplasmic staining.
The staining procedure was as follows: slides were deparaffinized by 5-minute incubation in xylol, washed in 100% ethanol, and hydrated in PBS. Slides were then incubated in 3% hydrogen peroxide for 10 minutes and hydrated in PBS. The slides were then placed in preheated to boiling temperature sodium citrate, 0.05%, pH 6, and incubated for 10 minutes and rinsed in 1× PBS. They were then incubated overnight with the primary antibody STAT6 diluted in normal antibody diluent (Immunologic) overnight at room temperature (dilution 1:80) at 4°C. The secondary antibody was PowerVision Poly-HRP–Anti Ms/Rb/Rt IgG (Immunologic), which was used for 30 minutes at room temperature, followed by DAB (DAB plus, Power DAB) substrate for 5 minutes, and counterstained with hematoxylin and mounted with xylol.
Clinical study.
We retrospectively constructed a patient database using data obtained in the period of 2000–2009 in our institute. Data were obtained from patients who received the standard of care treatment. These patients were informed that their clinical data and tissue samples could be used for anonymized scientific analysis, for which they gave their consent. Eligible patients had histologically proven locally advanced squamous cell carcinoma of the head and neck without distant metastases. We analyzed data from 2 patient cohorts: one cohort of patients that had been treated with weekly cisplatin 40 mg/m2 in combination with a 6-week course of radiotherapy and a second cohort of patients that had been treated with radiotherapy alone. Histological tumor material for STAT6 staining obtained before treatment had to be available. The primary end point was recurrence-free survival, which was defined as the period between start of treatment and the occurrence of a relapse, not including a second primary or death due to other causes. The following characteristics were registered in the database: tumor location, TNM stage, age, and sex (Supplemental Table 2). We collected data of 58 patients that had been treated with cisplatin in combination with radiotherapy and of 48 patients, matched for tumor status, who had been treated with radiotherapy alone. Tumor and patient characteristics were evenly distributed between STAT6-positive and STAT6-negative cases. Three patients were excluded: 2 patients because of inadequate tumor material for STAT6 staining, 1 patient because only material that was obtained after treatment was available.
Statistics.
Data were analyzed statistically by means of ANOVA and Student-Neuman-Keuls test. Statistical significance was defined as P < 0.05. The recurrence-free survival curves were estimated by the Kaplan-Meier method and compared by means of the log-rank test. Data are depicted as mean + SEM.
Supplementary Material
Acknowledgments
Mandy van de Rakt, Tjitske Duiveman, Nicole Meeusen-Scharenborg, Marieke Kerkhoff, Jurjen Tel, Klaartje de Kanter, David Burger, Annechien Lambeck, Monique Link, Hans Jacobs, Jolien Tol, Martijn den Brok, and Erik Aarntzen are acknowledged for their assistance. We thank Niels Schaft (Erlangen, Germany) for providing us with the gp100 TCR construct. This work was supported by grants from the Netherlands Organization for Scientific Research (grant 920-03-250), the Sascha Swarttouw-Hijmans Foundation, The Vanderes Foundation, and the Dutch Cancer Society.
Footnotes
Conflict of interest: The authors have declared that no conflict of interest exists.
Citation for this article: J Clin Invest. 2011;121(8):3100–3108. doi:10.1172/JCI43656.
References
- 1.Lake RA, Robinson BW. Immunotherapy and chemotherapy--a practical partnership. Nat Rev Cancer. 2005;5(5):397–405. doi: 10.1038/nrc1613. [DOI] [PubMed] [Google Scholar]
- 2.Zitvogel L, Kroemer G. Anticancer immunochemotherapy using adjuvants with direct cytotoxic effects. J Clin Invest. 2009;119(8):2127–2130. doi: 10.1172/JCI39991. [DOI] [PMC free article] [PubMed] [Google Scholar]
- 3.Nowak AK, et al. Induction of tumor cell apoptosis in vivo increases tumor antigen cross-presentation, cross-priming rather than cross-tolerizing host tumor-specific CD8 T cells. J Immunol. 2003;170(10):4905–4913. doi: 10.4049/jimmunol.170.10.4905. [DOI] [PubMed] [Google Scholar]
- 4.Shurin GV, Tourkova IL, Kaneno R, Shurin MR. Chemotherapeutic agents in noncytotoxic concentrations increase antigen presentation by dendritic cells via an IL-12-dependent mechanism. J Immunol. 2009;183(1):137–144. doi: 10.4049/jimmunol.0900734. [DOI] [PMC free article] [PubMed] [Google Scholar]
- 5.Obeid M, et al. Calreticulin exposure dictates the immunogenicity of cancer cell death. Nat Med. 2007;13(1):54–61. doi: 10.1038/nm1523. [DOI] [PubMed] [Google Scholar]
- 6.Apetoh L, et al. Toll-like receptor 4-dependent contribution of the immune system to anticancer chemotherapy and radiotherapy. Nat Med. 2007;13(9):1050–1059. doi: 10.1038/nm1622. [DOI] [PubMed] [Google Scholar]
- 7.Mellor AL, Munn DH. Creating immune privilege: active local suppression that benefits friends, but protects foes. Nat Rev Immunol. 2008;8(1):74–80. doi: 10.1038/nri2233. [DOI] [PubMed] [Google Scholar]
- 8.Loke P, Allison JP. PD-L1 and PD-L2 are differentially regulated by Th1 and Th2 cells. Proc Natl Acad Sci U S A. 2003;100(9):5336–5341. doi: 10.1073/pnas.0931259100. [DOI] [PMC free article] [PubMed] [Google Scholar]
- 9.Liang SC, et al. Regulation of PD-1, PD-L1, and PD-L2 expression during normal and autoimmune responses. Eur J Immunol. 2003;33(10):2706–2716. doi: 10.1002/eji.200324228. [DOI] [PubMed] [Google Scholar]
- 10.Keir ME, Butte MJ, Freeman GJ, Sharpe AH. PD-1 and its ligands in tolerance and immunity. Annu Rev Immunol. 2008;26:677–704. doi: 10.1146/annurev.immunol.26.021607.090331. [DOI] [PMC free article] [PubMed] [Google Scholar]
- 11.Rodig N, et al. Endothelial expression of PD-L1 and PD-L2 down-regulates CD8+ T cell activation and cytolysis. Eur J Immunol. 2003;33(11):3117–3126. doi: 10.1002/eji.200324270. [DOI] [PubMed] [Google Scholar]
- 12.Shen CH, Stavnezer J. Interaction of stat6 and NF-kappaB: direct association and synergistic activation of interleukin-4-induced transcription. Mol Cell Biol. 1998;18(6):3395–3404. doi: 10.1128/mcb.18.6.3395. [DOI] [PMC free article] [PubMed] [Google Scholar]
- 13.Yu H, Jove R. The STATs of cancer--new molecular targets come of age. Nat Rev Cancer. 2004;4(2):97–105. doi: 10.1038/nrc1275. [DOI] [PubMed] [Google Scholar]
- 14.Bakker AB, et al. Melanocyte lineage-specific antigen gp100 is recognized by melanoma-derived tumor-infiltrating lymphocytes. J Exp Med. 1994;179(3):1005–1009. doi: 10.1084/jem.179.3.1005. [DOI] [PMC free article] [PubMed] [Google Scholar]
- 15.Desoize B, Madoulet C. Particular aspects of platinum compounds used at present in cancer treatment. Crit Rev Oncol Hematol. 2002;42(3):317–325. doi: 10.1016/S1040-8428(01)00219-0. [DOI] [PubMed] [Google Scholar]
- 16.Ghiringhelli F, et al. Activation of the NLRP3 inflammasome in dendritic cells induces IL-1beta-dependent adaptive immunity against tumors. Nat Med. 2009;15(10):1170–1178. doi: 10.1038/nm.2028. [DOI] [PubMed] [Google Scholar]
- 17.Ramakrishnan R, et al. Chemotherapy enhances tumor cell susceptibility to CTL-mediated killing during cancer immunotherapy in mice. J Clin Invest. 2010;120(4):1111–1124. doi: 10.1172/JCI40269. [DOI] [PMC free article] [PubMed] [Google Scholar]
- 18.Bracci L, et al. Cyclophosphamide enhances the antitumor efficacy of adoptively transferred immune cells through the induction of cytokine expression, B-cell and T-cell homeostatic proliferation, and specific tumor infiltration. Clin Cancer Res. 2007;13(2 pt 1):644–653. doi: 10.1158/1078-0432.CCR-06-1209. [DOI] [PubMed] [Google Scholar]
- 19.Vincent J, et al. 5-Fluorouracil selectively kills tumor-associated myeloid-derived suppressor cells resulting in enhanced T cell-dependent antitumor immunity. Cancer Res. 2010;70(8):3052–3061. doi: 10.1158/0008-5472.CAN-09-3690. [DOI] [PubMed] [Google Scholar]
- 20.Lutsiak ME, Semnani RT, De Pascalis R, Kashmiri SV, Schlom J, Sabzevari H. Inhibition of CD4(+)25+ T regulatory cell function implicated in enhanced immune response by low-dose cyclophosphamide. Blood. 2005;105(7):2862–2868. doi: 10.1182/blood-2004-06-2410. [DOI] [PubMed] [Google Scholar]
- 21.Zhang Y, et al. Regulation of T cell activation and tolerance by PDL2. Proc Natl Acad Sci U S A. 2006;103(31):11695–11700. doi: 10.1073/pnas.0601347103. [DOI] [PMC free article] [PubMed] [Google Scholar]
- 22.Pfistershammer K, et al. No evidence for dualism in function and receptors: PD-L2/B7-DC is an inhibitory regulator of human T cell activation. Eur J Immunol. 2006;36(5):1104–1113. doi: 10.1002/eji.200535344. [DOI] [PMC free article] [PubMed] [Google Scholar]
- 23.Dong H, et al. Tumor-associated B7-H1 promotes T-cell apoptosis: a potential mechanism of immune evasion. Nat Med. 2002;8(8):793–800. doi: 10.1038/nm730. [DOI] [PubMed] [Google Scholar]
- 24.Ohigashi Y, et al. Clinical significance of programmed death-1 ligand-1 and programmed death-1 ligand-2 expression in human esophageal cancer. Clin Cancer Res. 2005;11(8):2947–2953. doi: 10.1158/1078-0432.CCR-04-1469. [DOI] [PubMed] [Google Scholar]
- 25.Jacobs JF, et al. Regulatory T cells and the PD-L1/PD-1 pathway mediate immune suppression in malignant human brain tumors. Neuro Oncol. 2009;11(4):394–402. doi: 10.1215/15228517-2008-104. [DOI] [PMC free article] [PubMed] [Google Scholar]
- 26.Hamanishi J, et al. Programmed cell death 1 ligand 1 and tumor-infiltrating CD8+ T lymphocytes are prognostic factors of human ovarian cancer. Proc Natl Acad Sci U S A. 2007;104(9):3360–3365. doi: 10.1073/pnas.0611533104. [DOI] [PMC free article] [PubMed] [Google Scholar]
- 27.Iwai Y, Ishida M, Tanaka Y, Okazaki T, Honjo T, Minato N. Involvement of PD-L1 on tumor cells in the escape from host immune system and tumor immunotherapy by PD-L1 blockade. Proc Natl Acad Sci U S A. 2002;99(19):12293–12297. doi: 10.1073/pnas.192461099. [DOI] [PMC free article] [PubMed] [Google Scholar]
- 28.Hirano F, et al. Blockade of B7-H1 and PD-1 by monoclonal antibodies potentiates cancer therapeutic immunity. Cancer Res. 2005;65(3):1089–1096. [PubMed] [Google Scholar]
- 29.Charles KA, et al. The tumor-promoting actions of TNF-alpha involve TNFR1 and IL-17 in ovarian cancer in mice and humans. J Clin Invest. 2009;119(10):3011–3023. doi: 10.1172/JCI39065. [DOI] [PMC free article] [PubMed] [Google Scholar]
- 30.Aspord C, et al. Breast cancer instructs dendritic cells to prime interleukin 13-secreting CD4+ T cells that facilitate tumor development. J Exp Med. 2007;204(5):1037–1047. doi: 10.1084/jem.20061120. [DOI] [PMC free article] [PubMed] [Google Scholar]
- 31.Lesterhuis WJ, et al. Vaccination of colorectal cancer patients with CEA-loaded dendritic cells: antigen-specific T cell responses in DTH skin tests. Ann Oncol. 2006;17(6):974–980. doi: 10.1093/annonc/mdl072. [DOI] [PubMed] [Google Scholar]
- 32.de Vries IJ, et al. Magnetic resonance tracking of dendritic cells in melanoma patients for monitoring of cellular therapy. Nat Biotechnol. 2005;23(11):1407–1413. doi: 10.1038/nbt1154. [DOI] [PubMed] [Google Scholar]
- 33.de Vries IJ, et al. Phenotypical and functional characterization of clinical grade dendritic cells. J Immunother. 2002;25(5):429–438. doi: 10.1097/00002371-200209000-00007. [DOI] [PubMed] [Google Scholar]
- 34.den Dekker E, et al. Monocyte cell surface glycosaminoglycans positively modulate IL-4-induced differentiation toward dendritic cells. J Immunol. 2008;180(6):3680–3688. doi: 10.4049/jimmunol.180.6.3680. [DOI] [PubMed] [Google Scholar]
- 35.Schaft N, et al. Peptide fine specificity of anti-glycoprotein 100 CTL is preserved following transfer of engineered TCR alpha beta genes into primary human T lymphocytes. J Immunol. 2003;170(4):2186–2194. doi: 10.4049/jimmunol.170.4.2186. [DOI] [PubMed] [Google Scholar]
- 36.Schaft N, et al. A new way to generate cytolytic tumor-specific T cells: electroporation of RNA coding for a T cell receptor into T lymphocytes. Cancer Immunol Immunother. 2006;55(9):1132–1141. doi: 10.1007/s00262-005-0098-2. [DOI] [PMC free article] [PubMed] [Google Scholar]
- 37.Schreibelt G, et al. Commonly used prophylactic vaccines as an alternative for synthetically produced TLR ligands to mature monocyte-derived dendritic cells. Blood. 2010;116(4):564–574. doi: 10.1182/blood-2009-11-251884. [DOI] [PubMed] [Google Scholar]
Associated Data
This section collects any data citations, data availability statements, or supplementary materials included in this article.


