Abstract
Hepatocellular carcinoma (HCC) is the fifth most common cancer worldwide. It is more prevalent in men than women. Related to this, recent genetic studies have revealed a causal role for androgen receptor (AR) in hepatocarcinogenesis, but the underlying molecular mechanism remains unclear. Here, we used genome-wide location and functional analyses to identify a critical mediator of AR signaling — cell cycle–related kinase (CCRK) — that drives hepatocarcinogenesis via a signaling pathway dependent on β-catenin and T cell factor (TCF). Ligand-bound AR activated CCRK transcription and protein expression via direct binding to the androgen-responsive element of the CCRK promoter in human HCC cell lines. In vitro analyses showed that CCRK was critical in human cell lines for AR-induced cell cycle progression, hepatocellular proliferation, and malignant transformation. Ectopic expression of CCRK in immortalized human liver cells activated β-catenin/TCF signaling to stimulate cell cycle progression and to induce tumor formation, as shown in both xenograft and orthotopic models. Conversely, knockdown of CCRK decreased HCC cell growth, and this could be rescued by constitutively active β-catenin or TCF. In primary human HCC tissue samples, AR, CCRK, and β-catenin were concordantly overexpressed in the tumor cells. Furthermore, CCRK overexpression correlated with the tumor staging and poor overall survival of patients. Our results reveal a direct AR transcriptional target, CCRK, that promotes hepatocarcinogenesis through the upregulation of β-catenin/TCF signaling.
Introduction
Hepatocellular carcinoma (HCC), the fifth most common cancer and the third most frequent cause of cancer deaths worldwide, occurs mainly in men (1). HBV and HCV are the most important etiologic factors, accounting for approximately 80% of HCC cases. The risk of HCC is greatly increased in chronic viral carriers of the male sex (2–5), suggesting that sex steroid hormones may also contribute to the development of HCC (6, 7). Findings from mouse models have shown that apart from the protective effect of estrogen (8), elevated activity of the androgen axis is the major contributor to the sex-related disparity in HCC (9–11).
Androgen receptor (AR) is a ligand-dependent transcription factor that mediates the effects of androgen in vital physiological and pathological processes, including cancer initiation and progression (12). Binding of androgen induces conformational change and nuclear translocation of AR, where it forms a homodimer and binds to its cognate response DNA sequence called androgen-responsive element (ARE). The transcriptional activity of AR can be augmented by the HBV X and HCV core oncoproteins (13–15), providing a synergism between androgen and chronic viral infection in HCC development. Overexpression of AR has been demonstrated in 60%–80% of human HCCs (16, 17). Recent genetic studies further established the pivotal role of AR in hepatocarcinogenesis, in which liver-specific knockout of AR significantly reduced tumorigenicity in carcinogen- and HBV-induced HCC mouse models (18, 19). Nevertheless, the molecular mechanisms of AR-induced hepatocarcinogenesis are largely unknown.
Aberrant activation of the Wnt/β-catenin pathway occurs in most HCCs and contributes to their growth and survival (20–23). In the absence of Wnt signaling, the transcriptional coregulator β-catenin is targeted for ubiquitination and degradation by phosphorylation through glycogen synthase kinase-3β (GSK3β) and casein-kinase 1α in a “destruction box” complex. Activation of Wnt signaling leads to the phosphorylation of Dishevelled, which prevents GSK3β from phosphorylating β-catenin. This results in the accumulation of β-catenin, which translocates into the nucleus and binds the T cell factor (TCF)/LEF family of transcription factors to regulate target gene expression. Besides genetic mutations, the mechanism underlying constitutive β-catenin activation in HCCs is poorly understood (21, 24).
While the ligand-activated AR has been shown to directly regulate HBV replication via viral promoter binding (19, 25), it remains unclear whether AR signaling directly affects the hepatocellular genome to promote HCC development. In the present study, we aimed to identify the direct AR transcriptional target genes in HCC cells by ChIP microarray (or ChIP-chip) (26–28). Consistent with the major function of AR in G1/S cell cycle progression (29, 30), we showed that cell cycle–related kinase (CCRK) is a direct critical mediator of AR signaling in liver and HCC cells. We further demonstrated the oncogenic properties of CCRK in vitro and in vivo, which were at least partially mediated by the activation of β-catenin/TCF signaling. Importantly, CCRK was overexpressed in approximately 70% of primary HCCs and significantly correlated with the elevated AR and active β-catenin levels. Moreover, we also addressed the clinical significance of CCRK overexpression.
Results
Identification of direct AR transcriptional target genes in HCC cells.
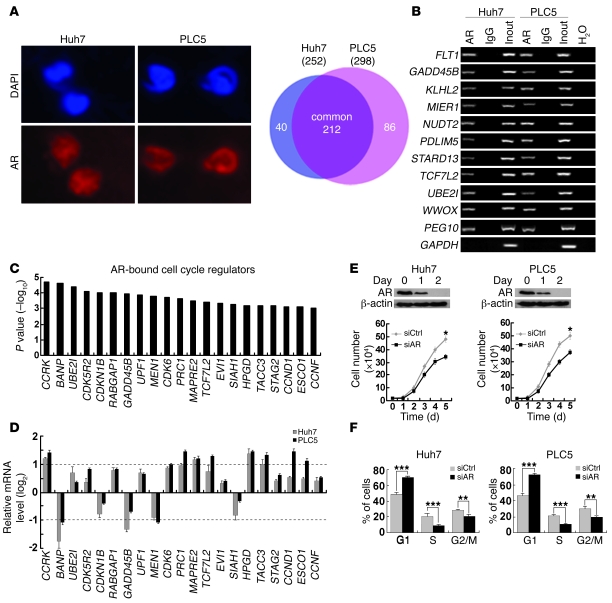
In order to characterize the direct targets of AR that confer oncogenic properties in HCC, we first performed ChIP coupled with promoter arrays covering approximately 17,000 best-defined human transcripts in the AR-expressing Huh7 and PLC5 HCC cell lines (Figure 1A). We identified 338 AR target promoters with high confidence (P < 0.01), 212 of which were common in both HCC cell lines (Figure 1A and Supplemental Table 1; supplemental material available online with this article; doi: 10.1172/JCI45967DS1). Conventional and quantitative ChIP-PCR analysis validated that all 10 randomly selected loci showed strong enrichment for AR antibody but not IgG control (Figure 1B and Supplemental Figure 1). The specificity of AR ChIP was further confirmed by the amplification of a previously reported AR target, PEG10 (31), but not GAPDH as a negative control (Figure 1B and Supplemental Figure 1). Notably, gene ontology analysis of the identified AR target genes revealed a significant enrichment of cell cycle regulators (21 out of 212; Figure 1C) compared with the proportion in human genome (1152 out of 24373) (32) (P = 0.0008, χ2 test). Quantitative RT-PCR showed that the transcript levels of 8 of these targets were either significantly increased (CCRK, CDK6, PRC1, MAPRE2, HPGD, TACC3) or decreased (BANP, MEN1) by an AR agonist R1881 (approximately 2-fold) in both HCC cell lines (Figure 1D). HCC cell growth was significantly retarded when AR expression was silenced by siRNA against AR (siAR) compared with a control sequence that does not match any known human gene (siCtrl) (P < 0.05; Figure 1E) or when AR activity was inhibited by AR antagonist bicalutamide (P < 0.01; Supplemental Figure 2). In addition, knockdown of AR significantly decreased G1/S cell cycle progression (P ≤ 0.001; Figure 1F). Collectively, these data suggest that AR directly regulates cell cycle–related genes to promote HCC cell proliferation.
Figure 1. Genome-wide location analysis of AR-binding sites identifies cell cycle–related target genes in HCC cells.
(A) Identification of AR direct target genes using ChIP-chip. In Huh7 and PLC5 HCC cells, AR expression was localized in the nuclei, which were counterstained by DAPI. Venn diagram showing the significant overlap of AR target genes between the 2 cell lines. Original magnification, ×400. (B) Confirmation of 10 randomly selected AR target genes by ChIP-PCR using anti-AR antibody or irrelevant antibody against IgG (negative control) in Huh7 and PLC5 cells. Input (2%) represents the genomic DNA. PEG10 and GAPDH were included as positive and negative controls, respectively. (C) Enrichment of cell cycle regulators in AR target genes as denoted by their highly significant binding P values. (D) Quantitative RT-PCR analysis of the AR-bound cell cycle regulator expressions in Huh7 and PLC5 cells treated with the AR agonist R1881 (100 nM) for 6 hours relative to the untreated cells. GAPDH was used as an internal control. (E) Silencing AR expression retarded HCC cell growth. Western blot analysis of AR following RNA interference. β-actin was used as a loading control. Cell growth was inhibited in Huh7 and PLC5 cells treated with siAR compared with siCtrl-treated cells. (F) G1/S cell cycle progression was inhibited after knockdown of AR expression in both HCC cell lines. *P < 0.05; **P < 0.01; ***P < 0.001. Data are presented as mean + SD of 3 independent experiments.
AR transcriptionally upregulates CCRK expression.
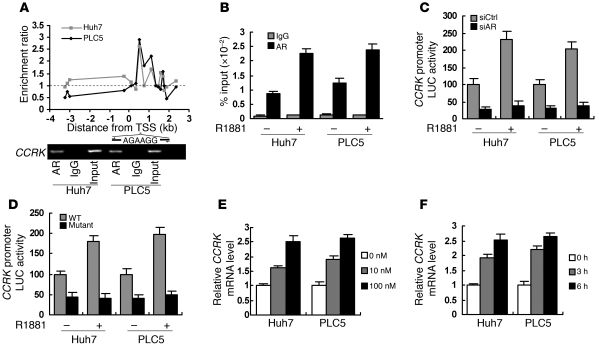
Because CCRK has the highest AR-binding affinity among the identified cell cycle regulators (Figure 1C), its transcriptional regulation and function were further characterized. The AR-binding site in CCRK promoter was mapped at 0.5- to 1-kb downstream of transcription start site (TSS), where a putative ARE (AGAAGG, +0.7 kb of TSS) (33) was located (Figure 2A). Conventional and quantitative ChIP-PCR confirmed the CCRK promoter occupancy of AR in both HCC cell lines (Figure 2, A and B). We next cloned the AR-bound CCRK promoter region (+29 to 828 bp of TSS) to pGL3 reporter for luciferase assay and showed that knockdown of AR inhibited the CCRK promoter activity (Figure 2C). Moreover, R1881 increased AR binding (Figure 2B) and transactivation (Figure 2C) of the CCRK promoter by approximately 2-fold. The function of the putative ARE in the CCRK promoter was verified by using site-directed mutagenesis, in which deletion of the 6-bp ARE resulted in significant reduction in both the basal and the R1881-induced promoter activities (Figure 2D). In addition, R1881 increased CCRK transcript levels in a dose- and time-dependent manner (Figure 2, E and F), which was unaffected by protein synthesis inhibitor cycloheximide (Supplemental Figure 3A). Similarly, physiological concentration range of testosterone dose dependently increased CCRK transcript levels (Supplemental Figure 3B). Using ectopic expression experiments, we further demonstrated that androgen-induced CCRK transcription was dependent on AR expression (Supplemental Figure 3C). Collectively, these data strongly demonstrate that ligand-activated AR directly upregulates CCRK transcription through promoter binding.
Figure 2. Direct transcriptional activation of CCRK by AR in HCC cells.
(A) Enrichment map showing the AR-binding region in the CCRK proximal promoter in Huh7 and PLC5 cells. Dotted line indicative of no enrichment (IP/input) is shown as reference. Confirmation of CCRK as AR target gene by ChIP-PCR using primers encompassing the ARE within the AR-binding region. (B) R1881 (100 nM) increased the binding of AR to CCRK promoter in HCC cells. Data obtained by quantitative ChIP-PCR for anti-AR antibody and IgG control were plotted as percentage of input. (C) CCRK promoter activity was modulated by liganded AR. Luciferase activities relative to Renilla control were measured in R1881- and vehicle-treated HCC cells following siCtrl or siAR transfection. (D) The ARE in CCRK promoter was essential for transcriptional activation. The HCC cells were transfected with either the WT or ARE-deleted mutant construct followed by R1881 treatment and luciferase activity measurement. (E and F) CCRK expression was increased by R1881 in a dose- and time-dependent manner, respectively, as detected by quantitative RT-PCR. HCC cells were treated with different doses of R1881 for 6 hours (E) or with 100 nM R1881 for different periods of time (F). GAPDH was used as an internal control. Data are presented as mean + SD of 3 independent experiments.
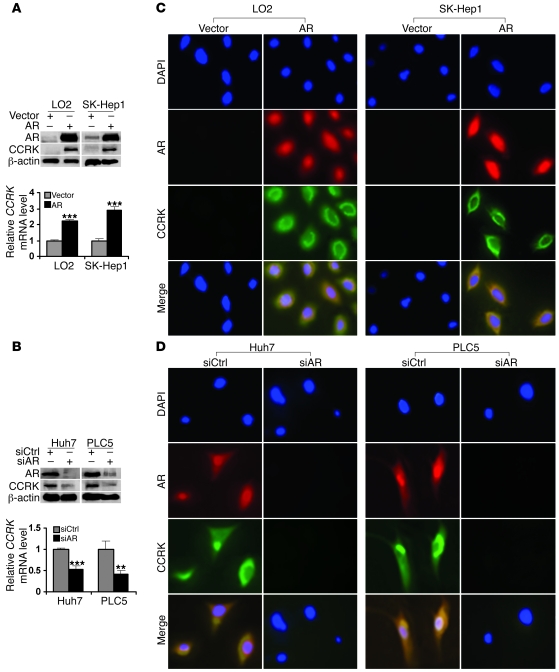
To confirm that AR induces CCRK expression, the AR gene was transiently transfected into immortal liver cell line LO2 and HCC cell line SK-Hep1, in which endogenous expression of AR is extremely low (Figure 3A). Quantitative RT-PCR demonstrated significantly higher levels of CCRK transcript in AR-expressing cells when compared with vector controls (P < 0.001; Figure 3A). Consistently, CCRK protein expression was also markedly increased (Figure 3A). On the other hand, knockdown of AR significantly reduced levels of CCRK transcript (P < 0.01 or 0.001) and protein in Huh7 and PLC5 cells (Figure 3B). To localize AR and CCRK in cells, we performed immunofluorescence staining following ectopic expression or knockdown of AR. In LO2 and SK-Hep1 cells transiently transfected with AR, thus exhibiting strong AR nuclear staining, we observed a marked increase in CCRK staining, predominantly in the perinuclear region (Figure 3C). In contrast, downregulation of AR in Huh7 and PLC5 cells diminished CCRK staining (Figure 3D). These data show that CCRK is upregulated by AR in human liver and HCC cells.
Figure 3. AR positively regulates CCRK transcript and protein expression in liver and HCC cells.
(A) Ectopic AR expression increased CCRK expression. AR and CCRK expression were detected by Western blot following transient transfection. β-actin was used as a loading control. The relative CCRK transcript level was detected in LO2 immortal liver and SK-Hep1 HCC cells by quantitative RT-PCR. GAPDH was used as an internal control. (B) Silencing AR expression downregulated CCRK transcript and protein expression in Huh7 and PLC5 HCC cells. **P < 0.01; ***P < 0.001. (C) Ectopic AR expression induced perinuclear CCRK localization. Double immunofluorescence staining of AR and CCRK was performed in LO2 and SK-Hep1 cells transiently transfected with AR-expressing vector or empty vector. The nuclei were counterstained with DAPI. (D) Localization of AR and CCRK in Huh7 and PLC5 cells following RNA interference. Original magnification, ×400. Data are presented as mean + SD of 3 independent experiments.
CCRK is critical for AR-induced oncogenic functions.
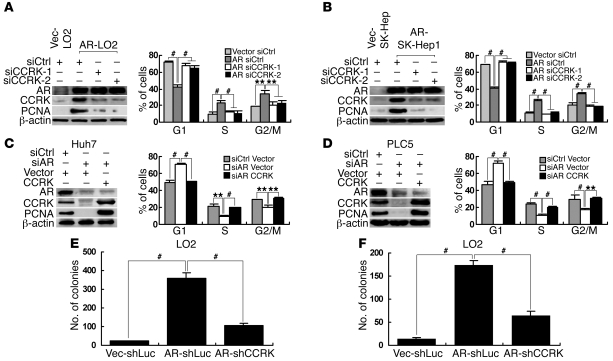
To investigate whether CCRK is involved in AR-induced cell cycle progression, LO2 and SK-Hep1 cells stably transfected with AR-expressing (referred to herein as AR-LO2 and AR-SK-Hep1, respectively) or empty vector (Vec-LO2 and Vec-SK-Hep1) were treated with R1881 and 2 independent siRNAs against CCRK (siCCRK-1 or siCCRK-2) or siCtrl. Ectopic expression of AR strongly induced CCRK expression and significantly promoted G1/S phase transition in LO2 and SK-Hep1 cells as shown by using BrdU and propidium iodide bivariate flow cytometry (P < 0.001; Figure 4, A and B, respectively). Notably, downregulation of CCRK blocked the AR-induced G1/S cell cycle progression (P < 0.001; Figure 4, A and B). In the reciprocal experiments, Huh7 and PLC5 cells treated with R1881 were transiently transfected with siAR or siCtrl as well as CCRK-expressing vector or empty vector. In both HCC cell lines, downregulation of AR significantly suppressed CCRK expression and induced cell cycle arrest in G1 (P ≤ 0.001; Figure 4, C and D). Importantly, ectopic CCRK expression rescued AR knockdown cells from G1 phase arrest (P < 0.001; Figure 4, C and D). Similar patterns of the cell cycle distribution could be observed by using standard propidium iodide flow cytometry (Supplemental Figure 4). These results demonstrate that upregulation of CCRK is crucial for AR-induced cell cycle progression.
Figure 4. CCRK is critical for AR-induced oncogenic functions.
(A and B) AR-induced G1/S cell cycle progression was abrogated by CCRK downregulation. AR, CCRK, and PCNA expression in R1881-stimulated (A) Vec-LO2 and AR-LO2 and (B) Vec-SK-Hep1 and AR-SK-Hep1 cells treated with siCtrl, siCCRK-1, or siCCRK-2 was detected by Western blot. β-actin was used as a loading control. The cell cycle distribution was measured by BrdU/propidium iodide bivariate flow cytometry. (C and D) Ectopic CCRK expression attenuated G1 phase arrest in AR-knockdown cells. Western blot and flow cytometry were performed in R1881-stimulated (C) Huh7 and (D) PLC5 cells transiently transfected with siCtrl or siAR and CCRK-expressing vector or empty vector. (E and F) AR-induced cellular proliferation and transformation were abrogated by CCRK downregulation. LO2 cells were transfected with AR-expressing vector or empty vector and shLuc or shCCRK vector for (E) focus formation and (F) soft agar assays. **P < 0.01; #P < 0.001. Data are presented as mean + SD of 3 independent experiments.
We next investigated whether CCRK also mediates AR functions in cellular proliferation and transformation. As expected, ectopic expression of AR in LO2 cells markedly induced focus formation (P < 0.001; Figure 4E) and anchorage-independent growth in soft agar (P < 0.001; Figure 4F). Notably, silencing of CCRK significantly attenuated the induced proliferation and malignant transformation in AR-expressing cells (P < 0.001; Figure 4, E and F). Consistently, AR caused an increase in the cellular proliferation marker PCNA, whereas depletion of CCRK in AR-expressing cells impeded PCNA expression (Figure 4, A and B). Conversely, ectopic CCRK expression in AR knockdown HCC cells rescued PCNA expression (Figure 4, C and D). Taken together, these results demonstrate that AR promotes cellular proliferation and transformation at least partially through the upregulation of CCRK.
Oncogenic properties of CCRK in HCC.
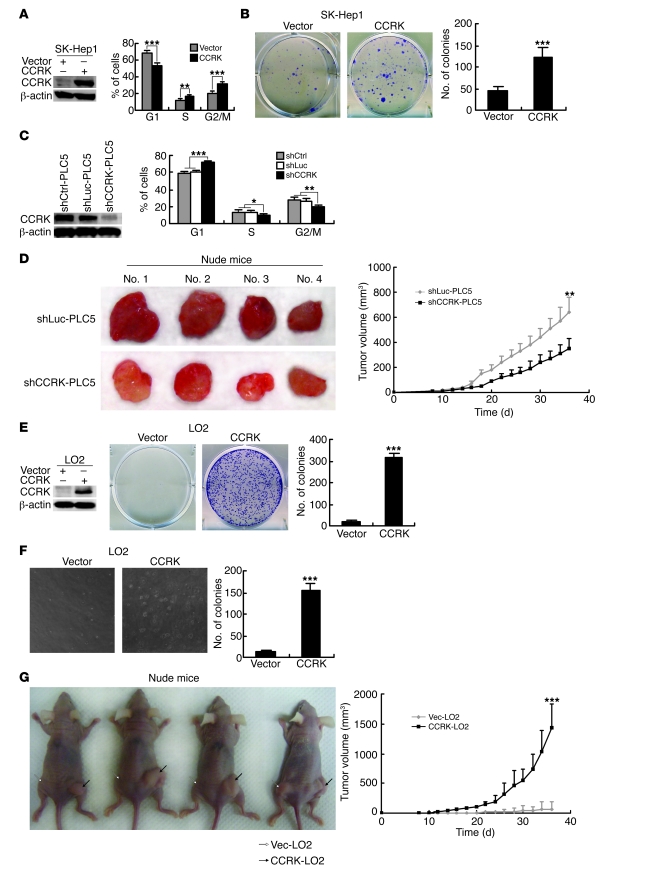
We next investigated whether CCRK per se can promote the growth and tumorigenicity of HCC cells. Ectopic expression of CCRK in SK-Hep1 cells significantly increased the fractions of cells in S and G2/M phase (P < 0.01; Figure 5A) and induced cellular proliferation as assessed by colony formation assay (P < 0.001; Figure 5B). On the other hand, PLC5 cells stably transfected with shRNA against CCRK (shCCRK-PLC5), thus lacking CCRK expression, showed significant G1/S phase delay compared with cells expressing shRNAs whose sequence does not match any known human gene and against luciferase (shCtrl-PLC5 and shLuc-PLC5, respectively; P < 0.001; Figure 5C). We next subcutaneously injected shCCRK-PLC5 and shLuc-PLC5 cells into the dorsal flanks of nude mice (n = 4 per group). Compared with shLuc-PLC5 cells, shCCRK-PLC5 cells exhibited significantly reduced tumor volume and growth rate (P < 0.01; Figure 5D). More importantly, ectopic CCRK expression in LO2 cells markedly induced focus formation (P < 0.001; Figure 5E) and anchorage-independent growth in soft agar (P < 0.001; Figure 5F). Furthermore, CCRK stably transfected LO2 cells (CCRK-LO2) displayed remarkable tumor growth in the xenograft model when compared with empty vector–transfected cells (Vec-LO2) (Figure 5G). In fact, the mean volume of tumors induced by CCRK-LO2 cells was 20-fold larger than that of Vec-LO2 cells, which formed either no tumor (3 of 4) or very small tumors (1 of 4) within 6 weeks (P < 0.001; Figure 5G). These findings show that CCRK exhibits strong oncogenic properties in HCC.
Figure 5. CCRK possesses oncogenic functions in HCC.
(A) Ectopic CCRK expression induced cell cycle progression in SK-Hep1 cells. β-actin was used as a loading control. (B) Focus formation assay of CCRK-expressing or control SK-Hep1 cells. Representative images of colonies formed are shown. (C) Silencing CCRK expression caused G1/S phase delay in PLC5 cells. Protein expression and cell cycle distribution in shCtrl-, shLuc-, and shCCRK-PLC5 cells were detected by Western blot and flow cytometry, respectively. β-actin was used as a loading control. (D) Silencing CCRK expression in PLC5 cells decreased tumor growth in vivo. Images of the tumors formed in nude mice induced by shLuc- and shCCRK-PLC5 cells are shown. Tumor volumes were measured for 36 days after subcutaneous injection. (E and F) Ectopic expression of CCRK in LO2 cells induced (E) anchorage-dependent and (F) -independent growth as detected by focus formation and soft agar assays, respectively. β-actin was used as a loading control. Representative images of colonies formed are shown. Original magnification, ×100. (G) CCRK drives tumor formation. Images of the tumors (black arrows) formed in nude mice induced by CCRK-LO2 cells. Vec-LO2 cells (white arrows) produced no or very small tumor. Tumor volumes were measured for 36 days after subcutaneous injection. *P < 0.05; **P < 0.01; ***P < 0.001. Data are presented as mean + SD of 3 independent experiments.
CCRK activates β-catenin/TCF signaling.
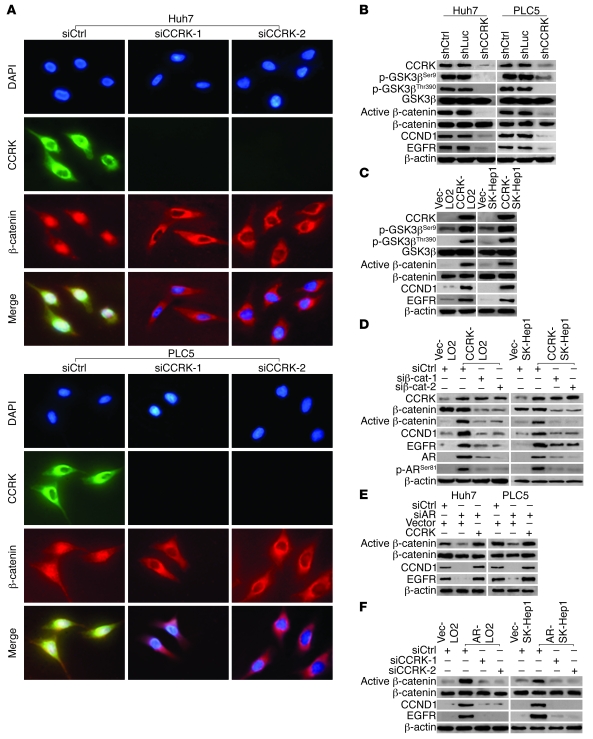
We next elucidated the mechanism underlying CCRK-induced oncogenesis. We postulated that CCRK modulates β-catenin signaling in HCC based on recent results from a protein kinase–enriched shRNA library screen (34). To test this hypothesis, we first performed double immunofluorescence and examined the effects of CCRK on β-catenin localization following RNA interference. Perinuclear expression of CCRK was associated with the nuclear accumulation of β-catenin in Huh7 and PLC5 cells transfected with control siRNA (Figure 6A). In sharp contrast, silencing of CCRK by 2 independent siRNAs led to redistribution of β-catenin to the cytoplasm, in particular the perinuclear area (Figure 6A). Consistent with the change of β-catenin subcellular localization, CCRK knockdown also decreased the level of active (dephosphorylated) β-catenin (35) but not the total β-catenin protein levels in Huh7 and PLC5 cells (Figure 6B). We next examined the effects of CCRK on GSK3β protein phosphorylation because GSK3β inactivation by phosphorylation stabilizes β-catenin (36). Downregulation of CCRK dramatically decreased the phosphorylation of GSK3β at serine 9 (Ser9) and threonine 390 (Thr390), but not the total GSK3β protein levels in Huh7 and PLC5 cells (Figure 6B). Conversely, ectopic expression of CCRK in CCRK-LO2 and CCRK-SK-Hep1 cells increased the GSK3β phosphorylation at both sites and also the active β-catenin levels compared with Vec-LO2 and Vec-SK-Hep1 cells (Figure 6C). Direct phosphorylation of recombinant GSK3β at Ser9 and Thr390 by recombinant CCRK was further demonstrated by using in vitro kinase assay (Supplemental Figure 5).
Figure 6. AR-CCRK–β-catenin regulatory circuitry.
(A) Redistribution of β-catenin from the nucleus to the perinuclear regions of Huh7 and PLC5 cells following CCRK knockdown. The siCtrl, siCCRK-1, and siCCRK-2-treated cells were stained for CCRK and β-catenin and counterstained with DAPI. Original magnification, ×400. (B) Silencing CCRK expression decreased GSK3β phosphorylation, active β-catenin, and β-catenin target gene expression in HCC cells. Expression of the indicated proteins was analyzed by Western blot in shCtrl-Huh7, shLuc-Huh7, shCCRK-Huh7, shCtrl-PLC5, shLuc-PLC5, and shCCRK-PLC5 cells. β-actin was used as a loading control. (C) GSK3β phosphorylation, active β-catenin, and β-catenin target gene expression were increased in CCRK-LO2 and -SK-Hep1 cells compared with Vec-LO2 and -SK-Hep1 cells. (D) CCRK-mediated upregulation of β-catenin activity increases AR expression and function. Expression of AR, phosphorylated AR at Ser81, and the other indicated proteins in vector control and CCRK-expressing LO2 and SK-Hep1 cells treated with siCtrl, siβ-catenin–1, or siβ-catenin–2 were detected by Western blot. (E and F) AR induces β-catenin activity via CCRK upregulation. Expression of active β-catenin and β-catenin target genes were analyzed by Western blot in (E) Huh7 and PLC5 and (F) LO2 and SK-Hep1 cells. The knockdown/overexpression of AR and CCRK were shown in Figure 4, A–D.
The β-catenin–driven hepatocarcinogenesis is mediated by its downstream proproliferative targets, e.g., cyclin D1 (CCND1) and EGFR (37, 38). Ablation of CCRK significantly reduced CCND1 and EGFR transcript (P < 0.01 or 0.001; Supplemental Figure 6) and protein expression in Huh7 and PLC5 cells (Figure 6B). On the contrary, ectopic expression of CCRK significantly increased CCND1 and EGFR transcript (P < 0.01 or 0.001; Supplemental Figure 6) and protein expression in LO2 and SK-Hep1 cells (Figure 6C). Moreover, knockdown of β-catenin in CCRK-expressing cells by 2 independent siRNAs abrogated the induction of active β-catenin and its target genes (Figure 6D). Collectively, these data demonstrate that CCRK activates β-catenin signaling, which is associated with GSK3β phosphorylation.
AR-CCRK–β-catenin regulatory circuitry.
Since crosstalk between AR and β-catenin has been previously described (39, 40), we determined whether CCRK-mediated upregulation of β-catenin activity alters AR function. Ectopic CCRK expression in LO2 and SK-Hep1 cells increased the levels of total and phosphorylated AR at Ser81, which has been shown to promote AR promoter selectivity and cancer cell growth (ref. 41 and Figure 6D). Notably, silencing of β-catenin attenuated the effects of CCRK on AR (Figure 6D), suggesting that CCRK-induced β-catenin activity positively regulates AR expression and function in liver and HCC cells. We further investigated whether AR reciprocally affects β-catenin activity via CCRK upregulation. Knockdown of AR reduced the expression of active β-catenin and β-catenin target genes, which could be rescued by ectopic CCRK expression in Huh7 and PLC5 cells (Figure 6E). Conversely, ectopic AR expression in LO2 and SK-Hep1 cells increased the levels of active β-catenin and β-catenin target genes, which were blocked by silencing of CCRK (Figure 6F). Taken together, our results indicate that AR, CCRK, and β-catenin constitute a positive regulatory circuit in HCC cells.
Active β-catenin signaling is required for CCRK-induced cell cycle progression and cell growth.
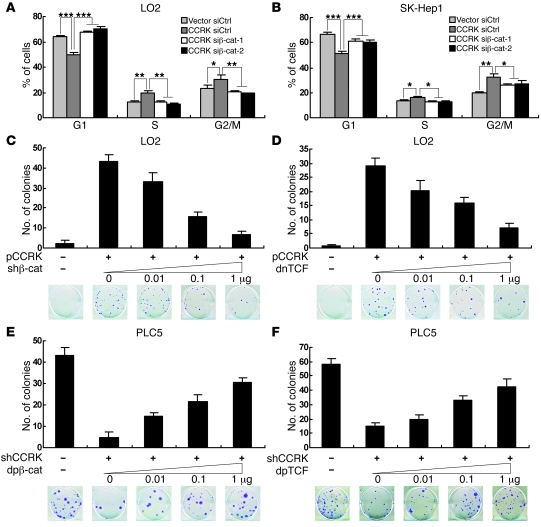
We next investigated the functional significance of active β-catenin signaling in CCRK-induced cell cycle progression. Ectopic expression of CCRK significantly promoted G1/S phase transition in LO2 cells (P < 0.001; Figure 7A). Notably, knockdown of β-catenin by 2 independent siRNAs completely abrogated cell cycle progression (P < 0.001; Figure 7A). Similarly, downregulation of β-catenin in CCRK-SK-Hep1 cells significantly counteracted CCRK-induced G1/S cell cycle progression (P < 0.001; Figure 7B).
Figure 7. CCRK induces cellular proliferation through the activation of β-catenin/TCF signaling.
(A and B) CCRK-induced G1/S cell cycle progression was abrogated by β-catenin downregulation. Cell cycle distribution in (A) Vec-LO2 and CCRK-LO2 and (B) Vec-SK-Hep1 and CCRK-SK-Hep1 cells treated with siCtrl, siβ-catenin–1, or siβ-catenin–2 was detected by flow cytometry. (C and D) Inhibition of β-catenin/TCF signaling attenuated CCRK-induced liver cell growth. CCRK-expressing vector or empty vector was transiently cotransfected into LO2 cells with increasing amounts of (C) shβ-catenin- or (D) dnTCF-expressing vector, and colony numbers were counted 3 weeks after transfection. Representative images of colonies formed are shown. (E and F) Constitutively active β-catenin and TCF rescued HCC cell growth inhibition induced by CCRK knockdown. shCCRK- or shCtrl-expressing vector was transiently cotransfected into PLC5 cells with increasing amounts of (E) dpβ-catenin– or (F) dpTCF-expressing vector, and colony numbers were counted 3 weeks after transfection. *P < 0.05; **P < 0.01; ***P < 0.001. Data are presented as mean + SD of 3 independent experiments.
β-catenin physically interacts with TCF/LEF transcription factors to regulate transcription (42). To further determine the effects of active β-catenin signaling on CCRK-induced cell growth, colony formation assays were performed on LO2 cells cotransfected with vectors expressing CCRK and shβ-catenin or a dominant-negative form of TCF (dnTCF) (43). Downregulation of β-catenin in CCRK-expressing LO2 cells by shβ-catenin decreased the number of colonies in a dose-dependent manner (Figure 7C). In accord, direct inhibition of β-catenin/TCF signaling by dnTCF also decreased the number of colonies dose dependently (Figure 7D). In the reciprocal experiments, colony formation assays were performed on PLC5 cells cotransfected with vectors expressing shCCRK and dominant-positive forms of β-catenin (dpβ-catenin) or TCF (dpTCF) (43). Notably, both dpβ-catenin and dpTCF alleviated the suppression of colony formation by shCCRK dose dependently (Figure 7, E and F, respectively). Taken together, these results strongly suggest that CCRK promotes liver and HCC cell proliferation through the activation of β-catenin/TCF signaling.
β-catenin depletion reverses the CCRK-induced tumorigenicity in nude mice.
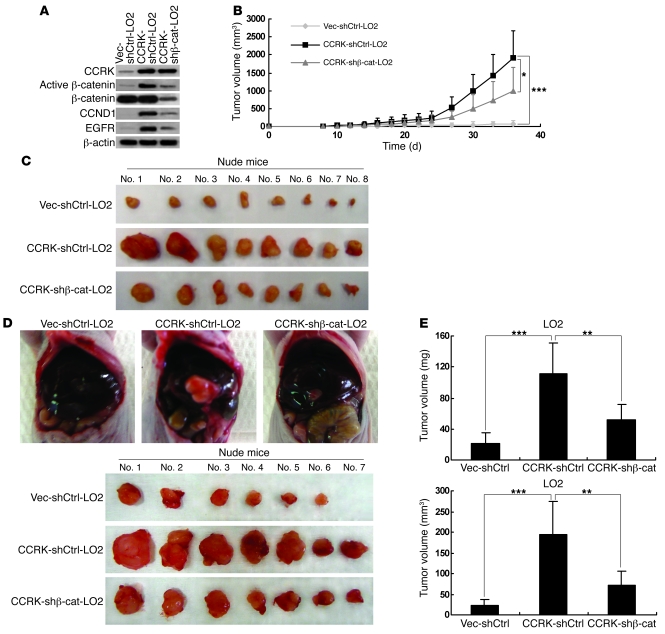
We next determined whether active β-catenin signaling is required for CCRK-induced tumorigenicity by xenograft experiments. As expected, stable transfection of shβ-catenin in CCRK-expressing LO2 cells abrogated the induction of active β-catenin and its target genes, CCND1 and EGFR (Figure 8A). We then subcutaneously injected Vec-shCtrl-LO2, CCRK-shCtrl-LO2, and CCRK–shβ-catenin–LO2 cells into nude mice (n = 8 per group). In contrast to vector control cells, the mice injected with CCRK-expressing cells exhibited greatly elevated tumor growth (P < 0.001), whereas β-catenin knockdown attenuated the induced tumorigenicity in CCRK-expressing cells (Figure 8B). The mean volume of tumors induced by CCRK–shβ-catenin–LO2 cells was 2-fold smaller than that induced by CCRK-shCtrl-LO2 (P < 0.05; Figure 8C). Western blot analysis on the xenograft tumor tissues further confirmed that the reduced tumorigenicity was associated with the decreased expression of the active β-catenin and its target genes (Supplemental Figure 7).
Figure 8. Silencing β-catenin expression reduces CCRK-induced tumorigenicity in nude mice.
(A) Expression of CCRK, CCND1, EGFR, active, and total β-catenin in Vec-shCtrl-LO2, CCRK-shCtrl-LO2, and CCRK–shβ-catenin–LO2 cells was detected by Western blot. β-actin was used as a loading control. (B) CCRK-shCtrl-LO2 cells displayed highly elevated tumor growth in nude mice when compared with Vec-shCtrl-LO2 cells. However, CCRK-induced tumorigenicity was decreased by β-catenin knockdown, as shown in mice injected with CCRK–shβ-catenin–LO2 cells. (C) Images of the tumors formed in the nude mice injected with the 3 types of cells are shown. (D) Intrahepatic tumorigenicity of Vec-shCtrl-LO2, CCRK-shCtrl-LO2, and CCRK–shβ-catenin–LO2 cells was determined by an orthotopic mouse model. Images of the tumors excised from the livers in each group are shown. (E) Knockdown of β-catenin significantly attenuated the intrahepatic tumorigenicity induced by CCRK. The weight and volume of the excised tumors in the 3 groups were measured. *P < 0.05; **P < 0.01; ***P < 0.001. Data are presented as mean + SD of 3 independent experiments.
We further verified these in vivo findings by using an orthotopic model. At 5 weeks after implantation (n = 7 per group), the tumors developed from Vec-shCtrl-LO2, CCRK-shCtrl-LO2, and CCRK–shβ-catenin–LO2 xenografts were excised from the livers (Figure 8D) and their volume and weight were measured. Both the tumor volume and weight of the CCRK-expressing orthografts were significantly increased when compared with that of the vector control orthografts (P < 0.001; Figure 8E). Notably, knockdown of β-catenin significantly attenuated the intrahepatic tumorigenicity induced by CCRK (P < 0.005; Figure 8E). These results confirm that active β-catenin signaling is a major mediator of CCRK-induced tumorigenicity.
CCRK expression positively correlates with AR and active β-catenin in primary HCCs.
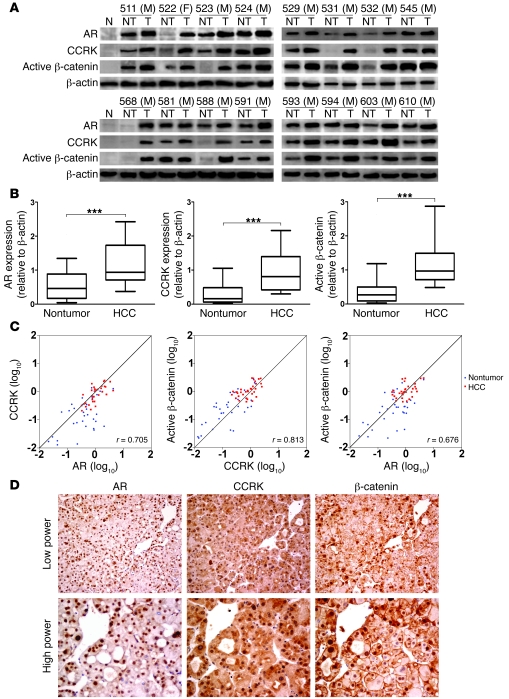
To further investigate whether the AR-CCRK–β-catenin pathway is involved in human HCC development, the correlations among AR, CCRK, and active β-catenin proteins were tested by Western blot in 33 pairs of HCC specimens. In contrast to the low basal levels in normal liver tissues, marked upregulation of AR, CCRK, and active β-catenin expressions were observed in HCCs (Figure 9A). Compared with the paired nontumor tissues, overexpression (defined as greater than 1.5-fold increase) (44) of AR, CCRK, and active β-catenin were detected in 57.6% (19/33), 75.8% (25/33), and 72.7% (24/33) of HCCs, respectively. Their average fold changes of expression in tumor tissues were significantly higher than those in the paired nontumor tissues (P < 0.0001, Wilcoxon’s matched pairs test; Figure 9B). Furthermore, association analysis showed that the expressions of AR, CCRK, and active β-catenin positively and significantly correlated with each other in these 33 pairs of HCC specimens (Pearson’s correlation coefficients: r = 0.705; r = 0.813; and r = 0.676; P < 0.0001; Figure 9C).
Figure 9. CCRK overexpression correlates with AR and active β-catenin levels in human HCCs.
(A) Western blot analysis of AR, CCRK, and active β-catenin in 16 representative primary HCC tissues (T) and their paired nontumor (NT) tissues as well as 2 normal liver specimens. β-actin was used as a loading control. M, male; F, female. (B) Relative protein expression levels of AR, CCRK, and active β-catenin in 33 paired HCC and nontumor tissues. The boxes represent the interquartile range; lines within boxes and whiskers denote median and 10–90 percentiles, respectively. (C) Correlation among AR, CCRK, and active β-catenin in 33 paired HCCs and matched nontumor tissues denoted with Pearson’s correlation coefficients. (D) Immunohistochemical staining of AR, CCRK, and β-catenin in the serial sections of a representative HCC case (#532M). AR staining showed strong nuclear positivity in the tumor cells. CCRK staining of the same area showed moderate strong cytoplasmic perinuclear positivity, while scattered nuclear positivity was also noted. β-catenin staining of the same area showed strong nuclear positivity. Original magnification, ×200 (low power); ×400 (high power). ***P < 0.0001. Data are presented as mean + SD of 3 independent experiments.
Immunohistochemical staining in the same cohort of HCC specimens demonstrated expression of AR, CCRK, and β-catenin in the tumor cells (Figure 9D). Whereas AR was predominantly located in the nuclei of HCC cells, CCRK was mainly found in the cytoplasm and to a less extent in both the nucleus and cytoplasm. In a subset of HCC specimens, nuclear staining of β-catenin could be demonstrated. Overall, the immunohistochemical scores of AR, CCRK, and β-catenin in HCC cells were significantly correlated with each other in this cohort (P < 0.05, Pearson’s χ2 test; Supplemental Table 2). Together, these results indicate that AR, CCRK, and active β-catenin were concordantly overexpressed in human HCCs.
Overexpression of CCRK is associated with poor prognosis of HCC patients.
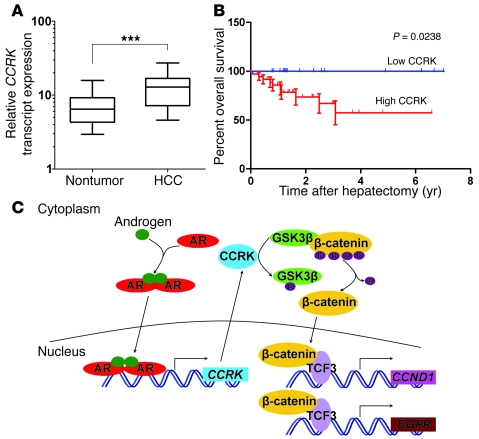
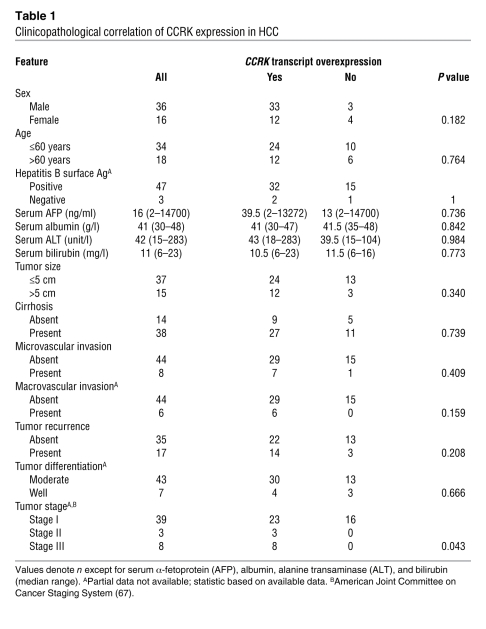
To investigate the correlation between CCRK overexpression and HCC prognosis, the CCRK transcript levels in 52 pairs of HCC cases were measured by quantitative RT-PCR. This cohort included the 33 HCCs used in the above experiments, of which both RNA and protein samples were available. The average fold change of CCRK transcript levels in tumor tissues was also significantly higher than that in the paired nontumor tissues (14.07 versus 8.10; P < 0.0001, Wilcoxon’s matched pairs test; Figure 10A). Overexpression of CCRK transcript was detected in 69.2% (36/52) of HCCs and was significantly associated with protein overexpression (P = 0.0122, Fisher’s exact test). We found that the overexpression of CCRK in HCCs was significantly associated with advanced tumor stage (P = 0.0428, Fisher’s exact test; Table 1). Kaplan-Meier analysis further revealed that the overexpression of CCRK was significantly associated with shorter overall survival rate (P = 0.0238; Figure 10B). Taken together, our findings in clinical HCC specimens reveal a positive correlation among AR, CCRK, and active β-catenin expression, further supporting a model of AR association with the CCRK promoter leading to the transcriptional upregulation of CCRK expression, thereby activating β-catenin/TCF signaling to induce the expression of downstream proproliferative target genes (Figure 10C).
Figure 10. CCRK overexpression is associated with the poor prognosis of HCC patients.
(A) Relative expression level of CCRK transcript in 52 paired HCC and nontumor tissues as detected by quantitative RT-PCR. PNN was used as an internal control. The boxes represent the interquartile range; lines within boxes and whiskers denote median and 10–90 percentiles, respectively. (B) Kaplan-Meier overall survival curves of HCC patients in correlation with CCRK overexpression. The overall survival rate was significantly decreased in the subgroup of HCC patients with high CCRK expression compared with the low CCRK–expressing subgroup. (C) Schematic representation of the highly activated AR-CCRK–β-catenin/TCF cascade in hepatocarcinogenesis, where activated AR transcriptionally upregulates CCRK expression, thereby activating β-catenin/TCF signaling to induce proproliferative target gene expression. ***P < 0.0001. Data are presented as mean + SD of 3 independent experiments.
Table 1 .
Clinicopathological correlation of CCRK expression in HCC
Discussion
Elucidating the factors causing the sex-related disparity of HCC has long been considered as a key for unrevealing critical pathways in hepatocarcinogenesis. A number of epidemiological and genotyping studies have attributed the male predominance in HCC to high testosterone levels and AR transcriptional activity (2, 5, 45, 46). Two recent elegant genetic studies have confirmed the critical role of AR in hepatocarcinogenesis by showing that liver-specific knockout of AR significantly reduced the incidence of carcinogen- and HBV-induced HCC tumors (18, 19). Although AR has been shown to promote cell growth and cellular oxidative stress in vitro and in vivo (18), the AR downstream target genes that execute these oncogenic functions have not been elucidated. Accumulating evidence has revealed that AR is a master regulator in G1/S phase progression in cancer cells and the crosstalk between this ligand-activated transcription factor and cell cycle pathways likely modulates the mitogenic response to androgen (29, 30). To date, only few direct AR target genes capable of mediating cell cycle progression have been uncovered (47, 48) and none was identified in HCC. Here we have applied ChIP-chip to catalog the direct transcriptional targets of AR in HCC cells. Consistent with its critical role in cell cycle regulation, we have identified a group of cell cycle regulators, with CCRK being the most significant AR-bound loci.
CCRK is a mammalian cyclin-dependent kinase (CDK) family member that plays an indispensable role in cell growth (49, 50). We have previously shown that CCRK is overexpressed in several human malignancies (44, 51, 52); however, the mechanism by which CCRK is dysregulated in cancer cells is yet unknown. In this study using in vivo promoter binding (ChIP), luciferase-reporter assays, site-directed mutagenesis, and expression analyses, we have unequivocally demonstrated that CCRK is transcriptionally upregulated by ligand-activated AR in human liver and HCC cells. Functional assays showed that CCRK plays a pivotal role in AR-induced cell cycle progression, cellular proliferation, and malignant transformation. Furthermore, CCRK expression in immortal liver cells induced focus formation, anchorage-independent growth, and tumor formation in immunodeficient mice, whereas CCRK knockdown in HCC cells reduced G1/S phase progression, focus formation, and tumorigenicity, thus demonstrating the strong oncogenic capacity of CCRK in HCC.
The oncogenic β-catenin/TCF-dependent transcriptional program is frequently activated in human HCCs (20, 21). Although aberrant β-catenin signaling has been primarily attributed to CTNNB1, AXIN1, and AXIN2 mutations, the occurrence of these genetic defects in HCCs was far less frequent than those showing abnormal accumulation of β-catenin (53–56). Our present findings demonstrated that CCRK activated β-catenin signaling and in turn upregulated the expression of β-catenin downstream targets. Moreover, our results indicate a vicious cycle: AR induces CCRK expression to stimulate β-catenin activity, while β-catenin, acting downstream of CCRK, induces AR expression and activity. The clinical relevance of this self-amplifying positive regulatory circuit was further supported by the concordant increase of AR, CCRK, and active β-catenin levels in primary HCC specimens. Taken together, our findings add a new dimension to the crosstalk between AR and β-catenin (39, 40, 57) and suggest that the AR-CCRK cascade may play a critical role in the constitutive β-catenin activation in cancers.
To date, the mechanism underlying β-catenin activation by CCRK remains unclear. While the N-terminal phosphorylation of GSK3β does not involve the canonical Wnt pathway (58, 59), recent studies have suggested that the C-terminal of GSK3β, specifically phosphorylation at Thr390, might be important for β-catenin activation (36, 60). Based on these and our findings, it is thus tempting to propose that direct phosphorylation of GSK3β at Thr390 by CCRK is a new pathway for β-catenin activation in HCC. However, further molecular genetic and biochemical evidence is needed to validate this hypothesis.
Emerging evidence suggests that deregulated CDK activity provokes tumor-associated cell cycle defects to induce unscheduled proliferation (61). Although previous studies demonstrated the ability of CCRK to phosphorylate and activate CDK2 (44, 49), the function of CCRK as a mammalian CDK-activating kinase remains uncertain (50). Our present findings offer an alternative mechanism for CCRK-induced cell cycle progression and cell proliferation. Knockdown of β-catenin abrogated CCRK-induced cyclin D1 expression and G1/S phase transition of liver cells. In accord, CCRK-induced colony formation was effectively abolished by inhibiting β-catenin/TCF signaling. Conversely, inhibition of colony formation by CCRK knockdown was reversed by constitutively active forms of β-catenin or TCF. These data provide compelling evidence that CCRK induces cellular proliferation through the activation of β-catenin/TCF signaling. The functional link between CCRK and β-catenin/TCF signaling was further demonstrated in vivo, where silencing of β-catenin in CCRK-expressing cells reduced active β-catenin levels and significantly attenuated tumorigenicity in both the xenograft and orthotopic models. The incomplete abrogation of tumorigenicity suggests that the full capacity of CCRK to produce tumors may extend beyond its ability to activate β-catenin. Upregulation of EGFR, an effector of the mitogenic pathway in mouse liver (37) and the angiogenic pathway in human HCCs (62, 63), may implicate an important signal route by which CCRK contributes to HCC development and progression.
The clinical relevance of CCRK overexpression was further addressed in this study by quantitative RT-PCR analysis in 52 pairs of HCC and matched nontumor liver specimens. We found that CCRK was overexpressed in approximately 70% of HCCs and was significantly correlated with tumor staging. More importantly, higher CCRK transcript levels in tumor tissues could distinguish a subset of patients with increased risk of poor overall survival, demonstrating the clinical significance of CCRK overexpression in HCC. In conclusion, our integrated approach shows for what we believe is the first time that the direct AR transcriptional target gene CCRK plays a critical role in hepatocarcinogenesis through the upregulation of β-catenin/TCF signaling. This kinase connects the AR and β-catenin/TCF cascades and provides a mechanistic basis for the aberrant β-catenin activation in human HCCs. Thus, disruption of the AR-CCRK–β-catenin–positive regulatory circuit is highly relevant to the design of therapeutic interventions in HCC and potentially the other male-predominant cancers.
Methods
Cell culture and expression vectors.
Huh7, PLC5, and SK-Hep1 HCC cell lines were maintained in high-glucose DMEM (Gibco; Invitrogen) supplemented with 10% FBS (Hyclone). The immortal human liver cell line LO2 was maintained in high-glucose DMEM supplemented with 10% FBS and 1% MEM Non-Essential Amino Acids (Gibco; Invitrogen). The cells were incubated at 37°C in a humidified chamber containing 5% CO2. For the hormone-depletion experiments, the cells were incubated in phenol-red free DMEM (Gibco; Invitrogen) supplemented with 5% charcoal/dextran-treated FBS (Hyclone), 1% l-glutamine (Gibco; Invitrogen), and 2% sodium pyruvate (Gibco). AR-expressing vector was kindly provided by Norman Maitland (University of York, York, United Kingdom). CCRK-expressing and shRNA vectors targeting CCRK (shCCRK: 5′-GAAGGTGGCCCTAAGGCGGTTGGAAGACG-3′) or firefly luciferase (shLuc: 5′-GTGAACATCACGTACGCGGAATACTTCGA-3′) were provided by Marie Lin (Chinese University of Hong Kong). Constitutively active β-catenin, dp-, and dn-TCF vectors were kindly provided by Alice Wong (University of Hong Kong). shRNA vector targeting β-catenin (shβ-catenin: 5′-GCTTGGAATGAGACTGCTGATCTCGAGATCAGCAGTCTCATTCCAAGC-3′) was purchased from Addgene.
Patients and clinical specimens.
Patients who underwent hepatectomy for HCC at the Prince of Wales Hospital (Hong Kong, China) were included in this study. The surgical specimens were processed immediately after the operation and snap-frozen in liquid nitrogen for RNA and protein extraction. All HCC patients gave written informed consent on the use of clinical specimens for research purposes. Studies using human tissue were reviewed and approved by the Joint CUHK-NTEC Clinical Research Ethics Committee.
ChIP assays, microarray hybridization, and data analysis.
ChIP coupled with microarray hybridization was performed as described previously (26, 64). Briefly, 1 × 10⁸ Huh7 or PLC5 cells treated with or without 100 nM R1881 (Waterstone Technology LLC) in hormone-depleted medium for 24 hours were crosslinked with 1% formaldehyde for 10 minutes at room temperature and quenched by glycine. After cell lysis, the chromatin was fragmented into 100–500 bp by Bioruptor Sonicator (Diagenode) and protein-DNA complexes were immunoprecipitated (IP) by 5 μg anti-AR antibody (Cell Signaling) or anti-IgG antibody (Sigma-Aldrich) Dynal magnetic bead (Invitrogen) mix on rotator at 4°C overnight. After washing and reversal of crosslinks, the IP and input DNA were purified, amplified by linker-mediated PCR, and labeled by Cy5 and Cy3, respectively. Dye-coupled DNA was cohybridized onto the human promoter ChIP-chip microarray set (Agilent) that contains 487,008 probes covering the proximal promoter regions of approximately 17,000 best-defined human transcripts. The microarray data were analyzed by feature extraction (Agilent) and deposited in the GEO database (GEO GSE25884). Statistical analysis was performed by using ChIP Analytics software (version 1.3), which utilizes the Whitehead neighborhood model to make binding calls based on an intensity-based P value of each probe and its neighbors. This algorithm computes robust regions of increased probe signal (peaks), where probes having P values of less than 0.01 were regarded as significant AR-DNA–binding events.
Conventional and quantitative ChIP-PCR assays.
For target gene validation, PCR primers targeting a region within 150 bp of the putative binding site were designed to detect IP and input DNA. 2 μl IP and 2% input DNA were used as a template for conventional PCR assay. For quantitative ChIP-PCR, equal amounts of IP and diluted input DNA were used for Power SYBR Green–based detection (Applied Biosystems), as previously described (26). The sequences of primers used are listed in Supplemental Table 3.
RNA interference and transfection.
Cells were transfected with 25 nM siRNAs against AR (siAR: 5′-GAAAGCACUGCUACUCUUCAG-3′), 100 nM siRNAs against CCRK (siCCRK-1 and -2: 5′-GAAGGUGGCCCUAAGGCGG-3′ and 5′-GGCGGUUGGAGGACGGCUU-3′), β-catenin (siβ-cat-1 and -2: 5′-AAGUCCUGUAUGAGUGGGAAC-3′ and 5′-CUCGGGAUGUUCACAACCGAA-3′), and a control sequence (siCtrl: 5′-UUCUCCGAACGUGUCACGU-3′) using HiPerfect (QIAGEN) according to the manufacturer’s protocols. The expression vectors were transfected into cells using FuGENE 6 (Roche) according to the manufacturer’s instructions. Stable transfectants were selected for 4 weeks with appropriate antibiotics. Resistant colonies were isolated, and individual clones were expanded in the selection medium.
Site-directed mutagenesis and luciferase reporter assay.
The CCRK promoter region (+29 to 828 bp) was cloned into pGL3–basic vector (Promega) to generate the CCRK-promoter luciferase reporter. The ARE (712-AGAAGG-717) deletion mutant was then generated by using the QuikChange II Site-Directed Mutagenesis Kit (Stratagene). The primers were designed using Stratagene’s web-based QuikChange Primer Design Program, available online. PCR reaction was performed to synthesize the mutant strand using PfuUltra High-Fidelity DNA polymerase (2.5 U/μl, Stratagene) under the following conditions: step 1: 95°C, 2 minutes; step 2: 30 cycles of 95°C, 30 seconds; 55°C, 1 minutes; 68°C, 6 minutes. Dpn I restriction enzyme (10 U/μl; Stratagene) was used to digest the parental supercoiled dsDNA at 37°C for 1 hour. The deletion mutation was verified by DNA sequencing. Huh7 and PLC cells in hormone-depleted medium were transiently transfected with the CCRK promoter constructs and Renilla luciferase reporters. After 24 hours, the cells were further transfected with 25 nM siAR or siCtrl for 2 days with or without 100 nM R1881 treatment in the last 24 hours. Cells were harvested and assayed by the Dual Luciferase Reporter Assay System (Promega) using GloMax microplate luminometer (Promega). All experiments were performed in triplicate and as 2 independent experiments.
Quantitative RT-PCR.
Total RNA was extracted by using TRIzol reagent (Invitrogen). 1 μg RNA was reverse transcribed to cDNA using Reverse Transcription Master Kit (Invitrogen) according to the manufacturer’s instructions. For quantitative PCR analysis, aliquots of cDNA were amplified using Power SYBR Green PCR Master Mix (Applied Biosystems) and 7500 Fast Real-Time PCR System (Applied Biosystems). GAPDH was used as an internal control for cell lines, while PNN was used for tissues because of its very low variation coefficient in human HCCs (65). All reactions were performed in triplicate. The sequences of primers used are listed in Supplemental Table 3.
Western blot.
Protein lysates from cell lines and tissues were prepared using protease inhibitor cocktail–containing (Roche) lysis buffer (50 mM Tris-HCl, pH 7.5, 150 mM NaCl, 1% NP-40, 0.5% Na-deoxycholate) and T-PER Tissue Protein Extraction Reagent (Thermo Scientific), respectively. Protein concentration was determined by the Bradford method (Bio-Rad Laboratories). 50 μg of protein was resolved by 10% SDS-polyacrylamide gel electrophoresis and electroblotted onto equilibrated nitrocellulose membrane (Bio-Rad Laboratories). Membranes were incubated with primary antibodies at 4°C overnight followed by secondary antibodies for 1 hour at room temperature. Antibody-antigen complexes were detected using the Western Blotting Chemiluminescence Luminol Reagent (Amersham). Primary antibodies used were rabbit anti-AR (Abcam), rabbit anti-pARSer81 (Millipore), rabbit anti-CCRK (Abcam), rabbit anti–β-catenin (Cell Signaling), mouse anti-active β-catenin (Millipore), rabbit anti-GSK3β (Cell Signaling), rabbit anti-pGSK3βSer9 (Cell Signaling), rabbit anti-pGSK3βThr390 (Cell Signaling), rabbit anti-CCND1 (Thermo Scientific), mouse anti-EGFR (BD Transduction laboratories), mouse anti-PCNA (Abcam), and mouse anti–β-actin (Sigma-Aldrich). Signals from tissues were quantified by BandScan software (Glyko) and defined as the ratio of target protein relative to β-actin.
In vitro kinase assay.
CCRK kinase activity was examined by using an in vitro kinase assay according to the manufacturer’s instructions (SignalChem). Briefly, 0.5 μg CCRK recombinant protein (Novus) was incubated with 1 μg GSK3β protein (SignalChem) as substrate at 30°C for 15 minutes. Phosphorylation of GSK3β at Ser9 and Thr390 was then detected by Western blot using specific phospho-GSK3β antibodies as mentioned above. AKT1 (SignalChem), known to induce phosphorylation of GSK3β at Ser9 (66), was used as a positive control.
Immunofluorescence.
Cells grown on coverslips were fixed with 3% paraformaldehyde and permeated with 0.1% Triton X-100. Nonspecific binding was blocked with 1% BSA for 30 minutes. The cells were then incubated with primary antibodies against rabbit anti-AR (Cell Signaling), mouse anti-CCRK (Sigma-Aldrich), or rabbit anti–β-catenin (Abcam) for 1 hour, followed by rhodamine-conjugated goat anti-rabbit antibody (Invitrogen) or FITC-conjugated goat anti-mouse antibody (Invitrogen) for 30 minutes. Nuclei were counterstained by DAPI (Invitrogen). Images were captured using confocal microscope (Nikon Eclipse TE2000-S).
Cell growth assay.
Cells (2 × 10⁴) seeded on 24-well plate were transfected with 25 nM siAR or siCtrl. The cell numbers were determined by Trypan blue dye exclusion every 24 hours for 5 consecutive days after transfection. All experiments were performed in triplicate.
Flow cytometry.
Cells in a 6-well plate were transfected with indicated siRNAs and/or vectors for 48 hours and fixed in ice-cold 70% ethanol before staining with propidium iodide (50 μg/ml; Sigma-Aldrich) for cell cycle distribution analysis. BrdU/propidium iodide double staining was also performed according to the manufacturer’s protocols (Roche). In brief, cells were incubated with BrdU (10 μM; Roche) at 37°C for 1 hour followed by fixation in ice-cold 70% ethanol for 30 minutes and denaturation in 4 N HCl for 20 minutes at room temperature. The cells were then stained by anti-BrdU FLUOS antibody (1:5; Roche) at 37°C for 45 minutes and, subsequently, propidium iodide for 1 hour. Cellular DNA content was determined using a FACSCalibur flow cytometer (BD Biosciences) and analyzed by WinMDI2.9 software. Data were obtained from 3 independent experiments.
Colony formation assay.
Cells seeded on 12-well plate with 50% to 80% confluence were transiently transfected with vectors. After 2 days, the cells were reseeded onto a 6-well plate and cultured for 3 weeks in antibiotic-containing selection medium. The resistant colonies were stained with 0.2% crystal violet and counted under the microscope. Data were obtained from 3 independent experiments.
Soft agar assay.
Cells seeded on a 6-well plate were covered with a layer of 0.6% agar in DMEM medium supplemented with 10% FBS. After transfection for 48 hours, cells were trypsinized, gently mixed with 0.3% agar medium mixture containing selective antibiotics, and seeded in triplicate onto a 6-well plate. After 4 weeks, the resistant colonies were stained with 0.2% crystal violet and counted under the microscope. Data were obtained from 3 independent experiments.
Xenograft mouse model.
Studies using female athymic nude mice (4 to 6 weeks old) were reviewed and approved by the Chinese University of Hong Kong Animal Experimentation Ethics Committee. 5 × 10⁶ cells were subcutaneously injected into the right and left flanks of the mice. Tumor size was measured every other day using a caliper, and the tumor volume was calculated as 0.5 × l × w2, with l indicating length and w indicating width. The mice were euthanized at 5–6 weeks, and the tumors were excised and snap-frozen for protein extraction.
Orthotopic mouse model.
An orthotopic HCC mouse model was used to determine intrahepatic tumorigenicity. 5 × 10⁶ cells were injected subcutaneously into the dorsal right flank of female athymic nude mice. Subcutaneous tumors were harvested 4 weeks after injection and cut into 1.0 mm3 pieces. One piece was then implanted into the left liver lobe of each mouse. The mice were sacrificed after 5 weeks, and the tumor size and weight were measured.
Immunohistochemistry.
5-μm sections from formalin-fixed paraffin-embedded archive tissues were deparaffinized, rehydrated, and rinsed in distilled water. Antigen retrieval was done by using a pressure cooker with 1 mM EDTA, pH 8.0, (for CCRK) or 10 nM citrate buffer, pH 6.0, (for AR and β-catenin) for 45 minutes. The endogenous peroxidase activity was then blocked by incubating the slides in 3% hydrogen peroxide in methanol for 10 minutes. The sections were then stained with polyclonal antibody against CCRK (1:25, Abcam), AR (1:50, Santa Cruz Biotechnology Inc.), and monoclonal antibody against β-catenin (1:50, BD Biosciences — BD Transduction Laboratories). The CCRK antibody was incubated at room temperature for 2 hours, and chromogen development was performed using the universal HRP Multimer Ultraview Kit on Benchmark XL (Ventana Medical System). The AR and β-catenin antibodies were incubated at 4°C for 16 hours, and detection was accomplished with EnVision+ polymer (Dako). The nuclear expression was assessed by a proportion score of the positive tumor cells and was categorized into 0 (negative), 1 (<10%), 2 (10%–20%), and 3 (>20%) for AR; 0 (negative), 1 (<5%), 2 (5%–10%), and 3 (>10%) for β-catenin. The cytoplasmic expression was assessed by Histoscore and consisted of a proportion score and an intensity score. The proportion score was according to the proportion of tumor cells with positive cytoplasmic staining (0, none; 1, ≤ 10%; 2, 10% to ≤ 25%; 3, >25% to 50%; 4, >50%). The intensity score was assigned for the average intensity of positive tumor cells (0, none; 1, weak; 2, intermediate; 3, strong). The cytoplasmic score of CCRK was the product of proportion and intensity scores ranging from 0 to 12 and was categorized into low (scores 0 to 3), intermediate (scores 4–6), and high (scores 7–12). The scoring was independently assessed by 2 investigators (Ka F. To and Joanna Tong).
Statistics.
Unless otherwise indicated, data are presented as mean + SD of 3 independent experiments. GraphPad Prism 5 (GraphPad Software) was used for data analysis. The independent Student’s t test was used to compare cellular proliferation, cell cycle distribution, colony formation, gene expression, and tumorigenicity between 2 selected groups. The protein and transcript levels of AR, CCRK, and active β-catenin in the HCCs and the matched nontumor tissues were compared using nonparametric Wilcoxon’s matched pairs test. The correlation between protein expressions was analyzed using Pearson’s χ2 test. The CCRK transcript level in HCCs was categorized as high (HCC/nontumor ratio >1.5-fold) and low (ratio <1.5-fold) as previously described (44). The clinicopathological features in patients with high and low CCRK-expressing HCCs were compared using Fisher’s exact test for categorical variables and the Mann-Whitney U test for continuous data. The Kaplan-Meier survival analysis was performed, where the overall survival times were calculated from the date of curative surgery to death or last follow-up of patients. A 2-tailed P value of less than 0.05 was considered statistically significant.
Supplementary Material
Acknowledgments
We would like to express our gratitude to Alice Wong (University of Hong Kong, Hong Kong, China) for critical reading of the manuscript and the provision of the dpβ-catenin, dpTCF, and dnTCF vectors for this study. We thank N. Maitland (University of York) for provision of the AR-expressing vector. We also thank Joanna Tong and Wei Kang for their excellent technical support. This work was supported by the General Research Fund (Ref. No. CUHK462710) from the Research Grants Council (Hong Kong, China) and the Direct Grant (Ref. No. 2041415) from the Chinese University of Hong Kong.
Footnotes
Conflict of interest: The authors have declared that no conflict of interest exists.
Citation for this article: J Clin Invest. 2011;121(8):3159–3175. doi:10.1172/JCI45967.
References
- 1.Parkin DM. Global cancer statistics in the year 2000. Lancet Oncol. 2001;2(9):533–543. doi: 10.1016/S1470-2045(01)00486-7. [DOI] [PubMed] [Google Scholar]
- 2.Yu MW, Chen CJ. Elevated serum testosterone levels and risk of hepatocellular carcinoma. Cancer Res. 1993;53(4):790–794. [PubMed] [Google Scholar]
- 3.Shiratori Y, et al. Characteristic difference of hepatocellular carcinoma between hepatitis B- and C- viral infection in Japan. Hepatology. 1995;22(4 pt 1):1027–1033. doi: 10.1002/hep.1840220403. [DOI] [PubMed] [Google Scholar]
- 4.Lee CM, et al. Age, gender, and local geographic variations of viral etiology of hepatocellular carcinoma in a hyperendemic area for hepatitis B virus infection. Cancer. 1999;86(7):1143–1150. doi: 10.1002/(SICI)1097-0142(19991001)86:7<1143::AID-CNCR7>3.0.CO;2-Z. [DOI] [PubMed] [Google Scholar]
- 5.Yu MW, et al. Hormonal markers and hepatitis B virus-related hepatocellular carcinoma risk: a nested case-control study among men. J Natl Cancer Inst. 2001;93(21):1644–1651. doi: 10.1093/jnci/93.21.1644. [DOI] [PubMed] [Google Scholar]
- 6.De Maria N, Manno M, Villa E. Sex hormones and liver cancer. Mol Cell Endocrinol. 2002;193(1–2):59–63. doi: 10.1016/S0303-7207(02)00096-5. [DOI] [PubMed] [Google Scholar]
- 7.Yeh SH, Chen PJ. Gender disparity of hepatocellular carcinoma: the roles of sex hormones. Oncology. 2010;78 suppl 1:172–179. doi: 10.1159/000315247. [DOI] [PubMed] [Google Scholar]
- 8.Naugler WE, et al. Gender disparity in liver cancer due to sex differences in MyD88-dependent IL-6 production. Science. 2007;317(5834):121–124. doi: 10.1126/science.1140485. [DOI] [PubMed] [Google Scholar]
- 9.Toh YC. Effect of neonatal castration on liver tumor induction by N-2-fluorenylacetamide in suckling BALB/c mice. Carcinogenesis. 1981;2(11):1219–1221. doi: 10.1093/carcin/2.11.1219. [DOI] [PubMed] [Google Scholar]
- 10.Kemp CJ, Leary CN, Drinkwater NR. Promotion of murine hepatocarcinogenesis by testosterone is androgen receptor-dependent but not cell autonomous. Proc Natl Acad Sci U S A. 1989;86(19):7505–7509. doi: 10.1073/pnas.86.19.7505. [DOI] [PMC free article] [PubMed] [Google Scholar]
- 11.Zender L, Kubicka S. Androgen receptor and hepatocarcinogenesis: what do we learn from HCC mouse models? Gastroenterology. 2008;135(3):738–740. doi: 10.1053/j.gastro.2008.07.034. [DOI] [PubMed] [Google Scholar]
- 12.Gelmann EP. Molecular biology of the androgen receptor. J Clin Oncol. 2002;20(13):3001–3015. doi: 10.1200/JCO.2002.10.018. [DOI] [PubMed] [Google Scholar]
- 13.Chiu CM, et al. Hepatitis B virus X protein enhances androgen receptor-responsive gene expression depending on androgen level. Proc Natl Acad Sci U S A. 2007;104(8):2571–2578. doi: 10.1073/pnas.0609498104. [DOI] [PMC free article] [PubMed] [Google Scholar]
- 14.Kanda T, Steele R, Ray R, Ray RB. Hepatitis C virus core protein augments androgen receptor-mediated signaling. J Virol. 2008;82(22):11066–11072. doi: 10.1128/JVI.01300-08. [DOI] [PMC free article] [PubMed] [Google Scholar]
- 15.Yang WJ, et al. Hepatitis B virus X protein enhances the transcriptional activity of the androgen receptor through c-Src and glycogen synthase kinase-3beta kinase pathways. Hepatology. 2009;49(5):1515–1524. doi: 10.1002/hep.22833. [DOI] [PubMed] [Google Scholar]
- 16.Nagasue N, Ito A, Yukaya H, Ogawa Y. Androgen receptors in hepatocellular carcinoma and surrounding parenchyma. Gastroenterology. 1985;89(3):643–647. doi: 10.1016/0016-5085(85)90463-9. [DOI] [PubMed] [Google Scholar]
- 17.Nagasue N, et al. Androgen receptor in hepatocellular carcinoma as a prognostic factor after hepatic resection. Ann Surg. 1989;209(4):424–427. doi: 10.1097/00000658-198904000-00006. [DOI] [PMC free article] [PubMed] [Google Scholar]
- 18.Ma WL, et al. Androgen receptor is a new potential therapeutic target for the treatment of hepatocellular carcinoma. Gastroenterology. 2008;135(3):947–955. doi: 10.1053/j.gastro.2008.05.046. [DOI] [PMC free article] [PubMed] [Google Scholar]
- 19.Wu MH, et al. Androgen receptor promotes hepatitis B virus-induced hepatocarcinogenesis through modulation of hepatitis B virus RNA transcription. Sci Transl Med. 2010;2(32):32ra35. doi: 10.1126/scitranslmed.3001143. [DOI] [PMC free article] [PubMed] [Google Scholar]
- 20.El-Serag HB, Rudolph KL. Hepatocellular carcinoma: epidemiology and molecular carcinogenesis. Gastroenterology. 2007;132(7):2557–2576. doi: 10.1053/j.gastro.2007.04.061. [DOI] [PubMed] [Google Scholar]
- 21.Thompson MD, Monga SP. WNT/beta-catenin signaling in liver health and disease. Hepatology. 2007;45(5):1298–1305. doi: 10.1002/hep.21651. [DOI] [PubMed] [Google Scholar]
- 22.Chiba T, et al. Enhanced self-renewal capability in hepatic stem/progenitor cells drives cancer initiation. Gastroenterology. 2007;133(3):937–950. doi: 10.1053/j.gastro.2007.06.016. [DOI] [PubMed] [Google Scholar]
- 23.Zeng G, Apte U, Cieply B, Singh S, Monga SP. siRNA-mediated beta-catenin knockdown in human hepatoma cells results in decreased growth and survival. Neoplasia. 2007;9(11):951–959. doi: 10.1593/neo.07469. [DOI] [PMC free article] [PubMed] [Google Scholar]
- 24.Barker N, Clevers H. Mining the Wnt pathway for cancer therapeutics. Nat Rev Drug Discov. 2006;5(12):997–1014. doi: 10.1038/nrd2154. [DOI] [PubMed] [Google Scholar]
- 25.Wang SH, Yeh SH, Lin WH, Wang HY, Chen DS, Chen PJ. Identification of androgen response elements in the enhancer I of hepatitis B virus: a mechanism for sex disparity in chronic hepatitis B. Hepatology. 2009;50(5):1392–1402. doi: 10.1002/hep.23163. [DOI] [PubMed] [Google Scholar]
- 26.Cheng AS, et al. Combinatorial analysis of transcription factor partners reveals recruitment of c-MYC to estrogen receptor-alpha responsive promoters. Mol Cell. 2006;21(3):393–404. doi: 10.1016/j.molcel.2005.12.016. [DOI] [PubMed] [Google Scholar]
- 27.Kondo Y, et al. Gene silencing in cancer by histone H3 lysine 27 trimethylation independent of promoter DNA methylation. Nat Genet. 2008;40(6):741–750. doi: 10.1038/ng.159. [DOI] [PubMed] [Google Scholar]
- 28.Qin H, et al. An integrative ChIP-chip and gene expression profiling to model SMAD regulatory modules. BMC Syst Biol. 2009;3:73. doi: 10.1186/1752-0509-3-73. [DOI] [PMC free article] [PubMed] [Google Scholar]
- 29.Boonyaratanakornkit V, Edwards DP. Receptor mechanisms mediating non-genomic actions of sex steroids. Semin Reprod Med. 2007;25(3):139–153. doi: 10.1055/s-2007-973427. [DOI] [PubMed] [Google Scholar]
- 30.Balk SP, Knudsen KE. AR, the cell cycle, and prostate cancer. Nucl Recept Signal. 2008;6:e001. doi: 10.1621/nrs.06001. [DOI] [PMC free article] [PubMed] [Google Scholar]
- 31.Jie X, et al. Androgen activates PEG10 to promote carcinogenesis in hepatic cancer cells. Oncogene. 2007;26(39):5741–5751. doi: 10.1038/sj.onc.1210362. [DOI] [PubMed] [Google Scholar]
- 32.Mukherji M, et al. Genome-wide functional analysis of human cell-cycle regulators. Proc Natl Acad Sci U S A. 2006;103(40):14819–14824. doi: 10.1073/pnas.0604320103. [DOI] [PMC free article] [PubMed] [Google Scholar]
- 33.Massie CE, et al. New androgen receptor genomic targets show an interaction with the ETS1 transcription factor. EMBO Rep. 2007;8(9):871–878. doi: 10.1038/sj.embor.7401046. [DOI] [PMC free article] [PubMed] [Google Scholar]
- 34.Firestein R, et al. CDK8 is a colorectal cancer oncogene that regulates beta-catenin activity. Nature. 2008;455(7212):547–551. doi: 10.1038/nature07179. [DOI] [PMC free article] [PubMed] [Google Scholar]
- 35.Staal FJ, Noort Mv M, Strous GJ, Clevers HC. Wnt signals are transmitted through N-terminally dephosphorylated beta-catenin. EMBO Rep. 2002;3(1):63–68. doi: 10.1093/embo-reports/kvf002. [DOI] [PMC free article] [PubMed] [Google Scholar]
- 36.Thornton TM, et al. Phosphorylation by p38 MAPK as an alternative pathway for GSK3beta inactivation. Science. 2008;320(5876):667–670. doi: 10.1126/science.1156037. [DOI] [PMC free article] [PubMed] [Google Scholar]
- 37.Tan X, et al. Epidermal growth factor receptor: a novel target of the Wnt/beta-catenin pathway in liver. Gastroenterology. 2005;129(1):285–302. doi: 10.1053/j.gastro.2005.04.013. [DOI] [PMC free article] [PubMed] [Google Scholar]
- 38.Patil MA, et al. Role of cyclin D1 as a mediator of c-Met- and beta-catenin-induced hepatocarcinogenesis. Cancer Res. 2009;69(1):253–261. doi: 10.1158/0008-5472.CAN-08-2514. [DOI] [PMC free article] [PubMed] [Google Scholar]
- 39.Liu S, et al. Inappropriate activation of androgen receptor by relaxin via beta-catenin pathway. Oncogene. 2008;27(4):499–505. doi: 10.1038/sj.onc.1210671. [DOI] [PubMed] [Google Scholar]
- 40.Wang G, Wang J, Sadar MD. Crosstalk between the androgen receptor and beta-catenin in castrate-resistant prostate cancer. Cancer Res. 2008;68(23):9918–9927. doi: 10.1158/0008-5472.CAN-08-1718. [DOI] [PMC free article] [PubMed] [Google Scholar]
- 41.Gordon V, et al. CDK9 regulates AR promoter selectivity and cell growth through serine 81 phosphorylation. Mol Endocrinol. 2010;24(12):2267–2280. doi: 10.1210/me.2010-0238. [DOI] [PMC free article] [PubMed] [Google Scholar]
- 42.Graham TA, Weaver C, Mao F, Kimelman D, Xu W. Crystal structure of a beta-catenin/Tcf complex. Cell. 2000;103(6):885–896. doi: 10.1016/S0092-8674(00)00192-6. [DOI] [PubMed] [Google Scholar]
- 43.Gottardi CJ, Wong E, Gumbiner BM. E-cadherin suppresses cellular transformation by inhibiting beta-catenin signaling in an adhesion-independent manner. J Cell Biol. 2001;153(5):1049–1060. doi: 10.1083/jcb.153.5.1049. [DOI] [PMC free article] [PubMed] [Google Scholar]
- 44.Ng SS, et al. Cell cycle-related kinase: a novel candidate oncogene in human glioblastoma. J Natl Cancer Inst. 2007;99(12):936–948. doi: 10.1093/jnci/djm011. [DOI] [PubMed] [Google Scholar]
- 45.Yu MW, et al. Androgen-receptor gene CAG repeats, plasma testosterone levels, and risk of hepatitis B-related hepatocellular carcinoma. J Natl Cancer Inst. 2000;92(24):2023–2028. doi: 10.1093/jnci/92.24.2023. [DOI] [PubMed] [Google Scholar]
- 46.Yeh SH, et al. Somatic mutations at the trinucleotide repeats of androgen receptor gene in male hepatocellular carcinoma. Int J Cancer. 2007;120(8):1610–1617. doi: 10.1002/ijc.22479. [DOI] [PubMed] [Google Scholar]
- 47.Jin F, Fondell JD. A novel androgen receptor-binding element modulates Cdc6 transcription in prostate cancer cells during cell-cycle progression. Nucleic Acids Res. 2009;37(14):4826–4838. doi: 10.1093/nar/gkp510. [DOI] [PMC free article] [PubMed] [Google Scholar]
- 48.Wang Q, et al. Androgen receptor regulates a distinct transcription program in androgen-independent prostate cancer. Cell. 2009;138(2):245–256. doi: 10.1016/j.cell.2009.04.056. [DOI] [PMC free article] [PubMed] [Google Scholar]
- 49.Liu Y, Wu C, Galaktionov K. p42, a novel cyclin-dependent kinase-activating kinase in mammalian cells. J Biol Chem. 2004;279(6):4507–4514. doi: 10.1074/jbc.M309995200. [DOI] [PubMed] [Google Scholar]
- 50.Wohlbold L, et al. The cyclin-dependent kinase (CDK) family member PNQALRE/CCRK supports cell proliferation but has no intrinsic CDK-activating kinase (CAK) activity. Cell Cycle. 2006;5(5):546–554. doi: 10.4161/cc.5.5.2541. [DOI] [PubMed] [Google Scholar]
- 51.Wu GQ, et al. Cell cycle-related kinase supports ovarian carcinoma cell proliferation via regulation of cyclin D1 and is a predictor of outcome in patients with ovarian carcinoma. Int J Cancer. 2009;125(11):2631–2642. doi: 10.1002/ijc.24630. [DOI] [PubMed] [Google Scholar]
- 52.An X, et al. Functional characterisation of cell cycle-related kinase (CCRK) in colorectal cancer carcinogenesis. Eur J Cancer. 2010;46(9):1752–1761. doi: 10.1016/j.ejca.2010.04.007. [DOI] [PubMed] [Google Scholar]
- 53.Satoh S, et al. AXIN1 mutations in hepatocellular carcinomas, and growth suppression in cancer cells by virus-mediated transfer of AXIN1. Nat Genet. 2000;24(3):245–250. doi: 10.1038/73448. [DOI] [PubMed] [Google Scholar]
- 54.Wong CM, Fan ST, Ng IO. beta-Catenin mutation and overexpression in hepatocellular carcinoma: clinicopathologic and prognostic significance. Cancer. 2001;92(1):136–145. doi: 10.1002/1097-0142(20010701)92:1<136::AID-CNCR1301>3.0.CO;2-R. [DOI] [PubMed] [Google Scholar]
- 55.Taniguchi K, et al. Mutational spectrum of beta-catenin, AXIN1, and AXIN2 in hepatocellular carcinomas and hepatoblastomas. Oncogene. 2002;21(31):4863–4871. doi: 10.1038/sj.onc.1205591. [DOI] [PubMed] [Google Scholar]
- 56.Zucman-Rossi J, et al. Differential effects of inactivated Axin1 and activated beta-catenin mutations in human hepatocellular carcinomas. Oncogene. 2007;26(5):774–780. doi: 10.1038/sj.onc.1209824. [DOI] [PubMed] [Google Scholar]
- 57.Mulholland DJ, Dedhar S, Coetzee GA, Nelson CC. Interaction of nuclear receptors with the Wnt/beta-catenin/Tcf signaling axis: Wnt you like to know? Endocr Rev. 2005;26(7):898–915. doi: 10.1210/er.2003-0034. [DOI] [PubMed] [Google Scholar]
- 58.McManus EJ, et al. Role that phosphorylation of GSK3 plays in insulin and Wnt signalling defined by knockin analysis. Embo J. 2005;24(8):1571–1583. doi: 10.1038/sj.emboj.7600633. [DOI] [PMC free article] [PubMed] [Google Scholar]
- 59.Doble BW, Patel S, Wood GA, Kockeritz LK, Woodgett JR. Functional redundancy of GSK-3alpha and GSK-3beta in Wnt/beta-catenin signaling shown by using an allelic series of embryonic stem cell lines. Dev Cell. 2007;12(6):957–971. doi: 10.1016/j.devcel.2007.04.001. [DOI] [PMC free article] [PubMed] [Google Scholar]
- 60.Buescher JL, Phiel CJ. A noncatalytic domain of glycogen synthase kinase-3 (GSK-3) is essential for activity. J Biol Chem. 2010;285(11):7957–7963. doi: 10.1074/jbc.M109.091603. [DOI] [PMC free article] [PubMed] [Google Scholar]
- 61.Malumbres M, Barbacid M. Cell cycle, CDKs and cancer: a changing paradigm. Nat Rev Cancer. 2009;9(3):153–166. doi: 10.1038/nrc2602. [DOI] [PubMed] [Google Scholar]
- 62.Moon WS, et al. Expression of betacellulin and epidermal growth factor receptor in hepatocellular carcinoma: implications for angiogenesis. Hum Pathol. 2006;37(10):1324–1332. doi: 10.1016/j.humpath.2006.04.022. [DOI] [PubMed] [Google Scholar]
- 63.Ueda S, et al. PTEN/Akt signaling through epidermal growth factor receptor is prerequisite for angiogenesis by hepatocellular carcinoma cells that is susceptible to inhibition by gefitinib. Cancer Res. 2006;66(10):5346–5353. doi: 10.1158/0008-5472.CAN-05-3684. [DOI] [PubMed] [Google Scholar]
- 64.Lee TI, Johnstone SE, Young RA. Chromatin immunoprecipitation and microarray-based analysis of protein location. Nat Protoc. 2006;1(2):729–748. doi: 10.1038/nprot.2006.98. [DOI] [PMC free article] [PubMed] [Google Scholar]
- 65.Cougot D, et al. The hepatitis B virus X protein functionally interacts with CREB-binding protein/p300 in the regulation of CREB-mediated transcription. J Biol Chem. 2007;282(7):4277–4287. doi: 10.1074/jbc.M606774200. [DOI] [PubMed] [Google Scholar]
- 66.Cross DA, Alessi DR, Cohen P, Andjelkovich M, Hemmings BA. Inhibition of glycogen synthase kinase-3 by insulin mediated by protein kinase B. Nature. 1995;378(6559):785–789. doi: 10.1038/378785a0. [DOI] [PubMed] [Google Scholar]
- 67. Liver (including intrahepatic bile ducts). In: Greene FL, et al. eds.AJCC Cancer Staging Manual . 6th ed. Chicago, IL: Springer Press; 2002:131–138 . [Google Scholar]
Associated Data
This section collects any data citations, data availability statements, or supplementary materials included in this article.


