Abstract
Discrete molecular dynamics simulation (DMD) uses simplified and discretized models enabling simulations to advance by event rather than by timestep. DMD is an instance of discrete event simulation and so is difficult to scale: even in this multi-core era, all reported DMD codes are serial. In this paper we discuss the inherent difficulties of scaling DMD and present our method of parallelizing DMD through event-based decomposition. Our method is microarchitecture inspired: speculative processing of events exposes parallelism, while in-order commitment ensures correctness. We analyze the potential of this parallelization method for shared-memory multiprocessors. Achieving scalability required extensive experimentation with scheduling and synchronization methods to mitigate serialization. The speed-up achieved for a variety of system sizes and complexities is nearly 6× on an 8-core and over 9× on a 12-core processor. We present and verify analytical models that account for the achieved performance as a function of available concurrency and architectural limitations.
Keywords: Parallel discrete molecular dynamics, parallel discrete event simulation, parallel processing
1 Introduction
Discrete, or Discontinuous, Molecular Dynamics (DMD) uses simplified models; for example atoms are modeled as hard spheres, covalent bonds as infinite barriers, and van der Waals forces as a series of one or more square wells. This discretization enables simulation to be advanced by event, rather than timestep. Events occur when two particles cross a discontinuity in inter-particle potential. The result is simulations that are typically faster than timestep-driven molecular dynamics [4, 18, 19, 26]. The simplicity of the models can be substantially compensated for by the capability of researchers to refine interactively simulation models [24, 25].
The problem addressed here is that for DMD, as for discrete event simulation (DES) in general, causality concerns make it difficult to scale to a significant number of processors [5, 16]. While the parallelization of DMD has been well-studied [16, 23], we are aware of no existing production parallel DMD (PDMD) codes. The difficulty in parallelizing DMD (as, in general, in parallelizing DES) is that dependencies can arise unpredictably and virtually instantaneously In some Parallel DES application domains, e.g., in network simulation, it is possible to circumvent this by predicting a window during which event processing is safe (conservative approach) or by making a similar assumption to ensure that the amount of work that may need to be undone is limited (optimistic approach) [5]. DMD, however, is chaotic: there is no safe window [12].
Our approach is motivated by the following observations.
A recent algorithmic advance in DMD event queuing has reduced the complexity of the most time-consuming operations from O(logN) to O(1) [18]. This has significantly reduced the amount of work to maintain a central event queue.
Previous PDMD work has been based on spatial decomposition [5, 11, 13, 16]. While workable in one and two dimensions, 3D simulation is far more complex. This requires, for cubic decomposition, that each thread exchange information with a large number of neighbors (26) for potential conflicts. Or, if decomposition is done by slices, then it must handle a drastic increase in the ratio of surface area to volume and so the number of interactions per thread-pair.
Many of the successful PDMD implementations were reported more than a decade ago (and mostly for 2D) [11, 13]. Since then, event processing speed has increased dramatically, through advances in both processors and algorithms, especially when contrasted with interprocessor communication latency. This means that parallelizing DMD through spatial decomposition is likely to be less efficient. On the other hand, shared memory multicore processors have evolved to become the dominant computing platform and maintaining a centralized event queue on such devices is not so expensive.
We therefore parallelize using event-based, rather than spatial, decomposition [7]. Overall, our method uses an approach that has proved successful both in CPU design [6] and in hardware implementations of PDMD [8, 17]: parallelize through deeply pipelined processing, but maintain in-order commitment. In software this translates as follows. There is a single centralized event queue. Multiple threads dequeue events in parallel and process them speculatively. Various types of hazards are checked by using shared data structures, and event processing is cancelled or restarted as necessary. As with hardware implementations, in-order commitment assures correctness.
We have implemented our method on shared memory multicore computers and have achieved a speedup of 5.9× on an 8 core and 9.2× on a 12 core processor. We have also analyzed the potential of parallelism in DMD and identified the obstacles that limit achieving it in full on currently available computing platforms. Overall, our contributions are as follows.
A scalable parallel DMD system based on a novel design that is appropriate for production applications. We are not aware of any other such system.
Experiments with both known and new optimizations that update long-standing issues such as cell size and queue insertion policy [11, 20], as well as describe the interaction of the latter with the latest queue data structure.
Extensive exploration of synchronization and scheduling mechanisms to minimize serialization. This is the key to scaling event-based decomposition.
Analysis of performance that accounts for scaling limitations by modeling the available concurrency and also the interaction between application and architecture.
The rest of this paper is organized as follows. In the next section we summarize discrete event simulation and its application to molecular dynamics. We concentrate on the event queue and discuss in some detail a data structure that has not previously been integrated into PDMD. In the following sections we describe how we chose the basic parameters, including data structure shape, cell size, and event queue insertion policy. We follow with our PDMD design, starting with a discussion of DMD hazards in general, how we deal with them conceptually, and then with our system. Next we present some critical implementation issues: three possible scheduling mechanisms, and other software refinements. We then present the scalability results, followed by various analytical models fleshed out with system-level measurements, and a conclusion.
2 DMD: Basics and Standard Implementation Issues
2.1 DES/DMD Overview
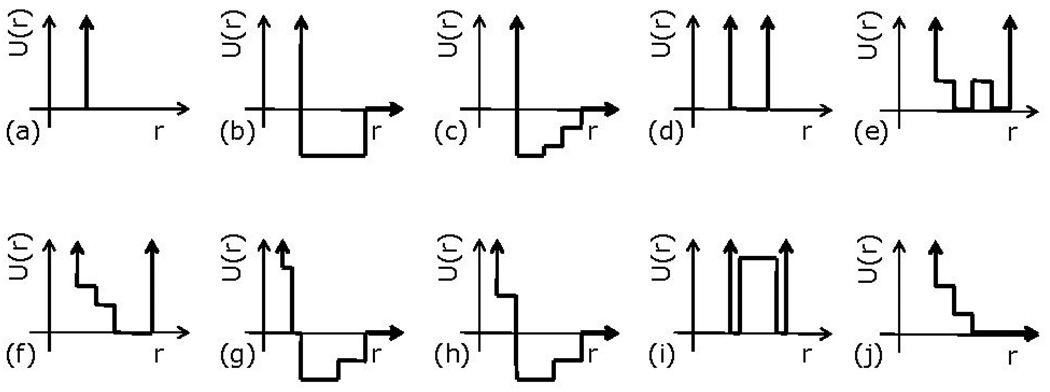
MD is the iterative application of Newton’s laws to ensembles of particles. It is transformed into DMD by simplifying the force models: all interactions are folded into spherically symmetric stepwise potential models. Figure 1 shows a selection of the potentials described in the literature (see, e.g., [1, 19, 24]). It is through this simplification of forces that the computation mode shifts from timestep-driven to event-driven.
Figure 1.
A collection of DMD potential models used in different studies (from [1, 19, 24]). (a) Simple hard sphere characterized by infinite repulsion at the sphere diameter. (b) Hard spheres with an attractive potential square well, zero interaction after a given cut-off radius. (c) A square well potential with multiple levels. (d) Single-infinite square well used for covalent bonds, angular constraints, and base-stacking interactions. (e) Dihedral constraint potential. (f) Hydrogen-bonding auxiliary distance potential function. g) Discretized van der Waals and solvation non-bonded interactions potential. h) Lysine-arginine-phosphate interaction potential in DNA-histone nucleosome complex. (i) Two-state bond used to create auxiliary bonds between backbone beads if they are also linked by a covalent bond. (j) Repulsive ramp with two steps for auxiliary interactions in hydrogen bond and with multiple steps to model liquids with negative thermal expansion coefficient.
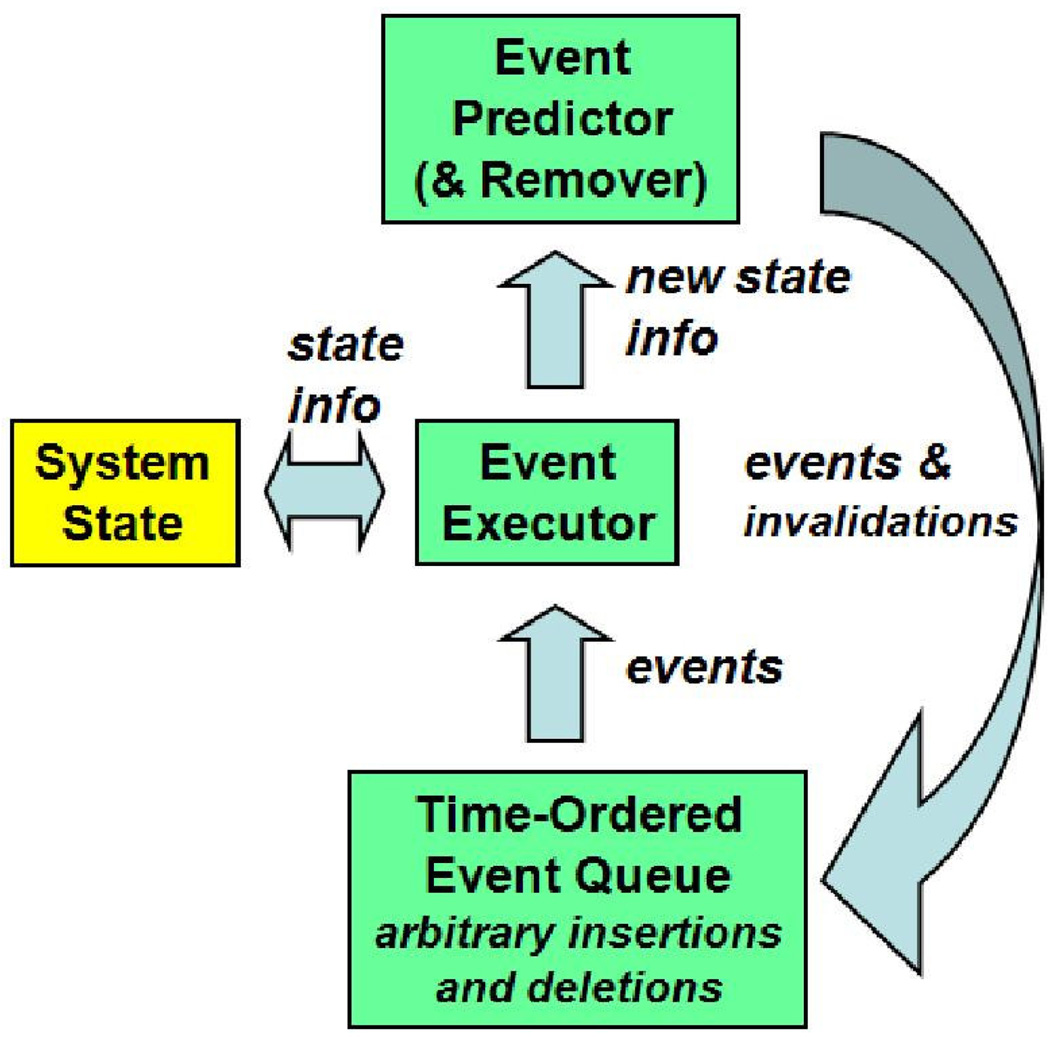
Overviews of DMD can be found in many standard MD references (e.g., Rapaport [21]) and DMD surveys [1, 19, 24]. A DMD system follows the standard DES configuration (Figure 2) and consists of the
System State, which contains the particle characteristics: velocity, position, time of last update, and type;
Event Predictor, which transforms the particle characteristics into pairwise interactions (events);
Event Processor, which turns the events back into particle characteristics; and
Event Priority Queue, which holds events waiting to be processed ordered by time-stamp.
Figure 2.
DES/DMD block diagram.
Execution proceeds as follows. After initialization, the next event (involving, say, particles a and b) is popped off the queue and processed. Then, all other previously predicted events involving a and b, if any, are removed from the queue, since they are no longer valid. Finally, new events involving a and b are predicted and inserted into the queue.
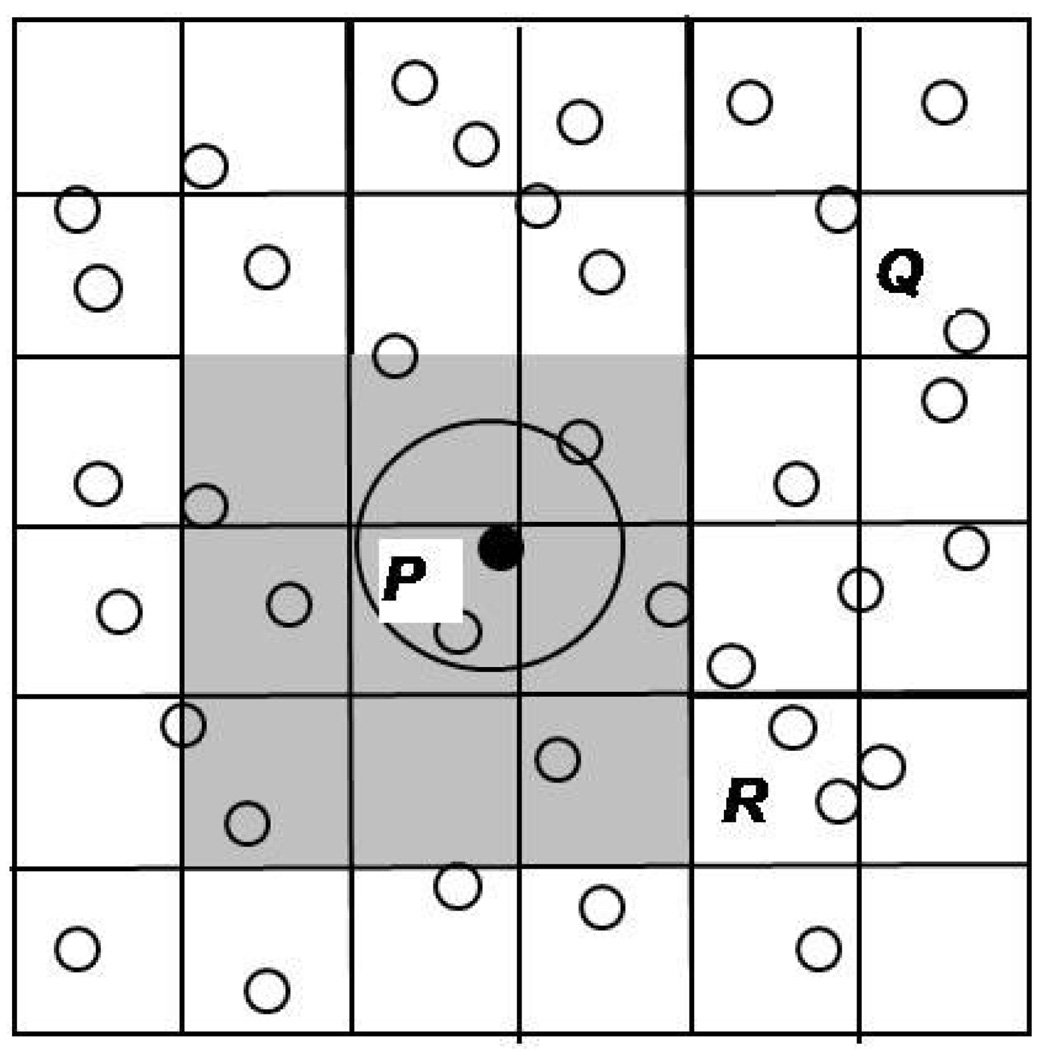
To bound the complexity of event prediction, the simulated space is subdivided into cells (as in MD) (Figure 3). Since both the number of particles per cell and the number of cells in a neighborhood (27 in 3D) are fixed, the number of predictions per event is also bounded and independent of the total number of particles. One complication of using cells in DMD is that, since there is no system-wide clock advance during which cell lists can be updated, bookkeeping must be facilitated by treating cell crossings as events and processing them explicitly. Cell size is usually determined such that two particles have to be in the same or adjacent cells to interact with each other (cell dimension > particle interaction cut-off distance). Thus for any home cell, we ensure that checking only the 26 neighboring cells (in 3D) is always sufficient. Particles in other cells must enter these neighboring cells prior to interacting with home cell particles; such events are handled separately as cell-crossings.
Figure 3.
Cell subdivision in DMD. Neighboring cells should cover the particle cut-off radius.
One design issue that has received much attention is how many of the newly predicted events to insert into the event queue [10]. The original algorithm by Rapaport [20] inserts all predicted events. Lubachevsky’s method [11] keeps only a single event, the earliest one, per particle. The reduced queue size, however, comes at a cost: whenever the sole event involving a particle is invalidated, the events for that particle must be repredicted. This is done by converting the invalidated event into an advancement event of that particle; when the advancement event is processed, new predictions are made. There is thus a trade-off between the processing required to update the larger queue and that required for reprediction. We compare the performance of these methods in Section 3.3.
2.2 Software Priority Queues
While parallelization retains the established mechanisms for event processing and prediction, queue operations are significantly affected. Much work has been done in optimizing the DMD event queue (see survey in [18]) with the design converging as is described in this and the next subsection.
The basic operations for the priority queue are as follows: dequeue the event with the highest priority (smallest time stamp), insert newly predicted events, and delete events in the queue that have been invalidated. A fourth operation can also be necessary: advancing, or otherwise maintaining, the queue to enable the efficient execution of the other three operations.
The data structures typically are
An array of particle records, indexed by particle ID;
An array to save information on which particle belongs to which cell;
An event pool;
An event priority queue; and
A series of linked lists, at least one per particle, with the elements of each (unordered) list consisting of all the events in the queue associated with that particular particle [21].
Implementation of priority queues for DMDis discussed by Paul [18]; they have for the most part been based on various types of binary trees, and all share the property that determining the event in the queue with the smallest value requires O(logN) time [14]. Using these structures, the basic operations are performed as follows. Operations using Paul’s queueing structure are described in the next section.
Dequeue: The tree is often organized so that for any node the left-hand descendants are events scheduled to occur before the event at the current node, while the right-hand descendants are scheduled to occur after it. The event with highest priority is then the left-most leaf node. This dequeue operation is therefore either O(1) or O(logN) depending on bookkeeping. Our implementation is a binary search tree, therefore the worst case asymptotic bound is O(logN), as long as the binary tree shape is maintained.
Insert: Since the tree is ordered by tag, insertion is O(logN) (again, in the worst case and as long as the binary tree shape is maintained).
Delete: For Rapaport queueing, when an event involving particles a and b is processed, all other events in the queue involving a and b must be invalidated and their records removed. This is done by traversing the particles’ linked lists and removing events both from those lists and the priority queue. Deleting an event from the tree is O(logN) (again, in worst case and as long as the binary tree shape is maintained). A particular event generally invalidates O(1) events, independent of simulation size, since cell subdivision method limits the maximum number of predicted events per particle.
Advance/Maintain: Binary trees are commonly adjusted to maintain their shape. This is to prevent their (possible) degeneration into a list and so a degradation of performance from O(logN) to O(N). With DMD, however, it has been shown empirically by Rapaport [20] and verified by us elsewhere, that event insertions are nearly randomly (and uniformly) distributed with respect to the events already in the queue. The tree shape is therefore maintained without rebalancing, although the average access depth is slightly higher than the minimum.
2.3 Implementation with Paul’s Event Queue (PaulQ)
In this subsection we summarize the primary DMD data structures. The event queue is based on work by G. Paul [18], which leads to a reduction in asymptotic complexity of priority queue operations from O(logN) to O(1), and a substantial benefit in realized performance.
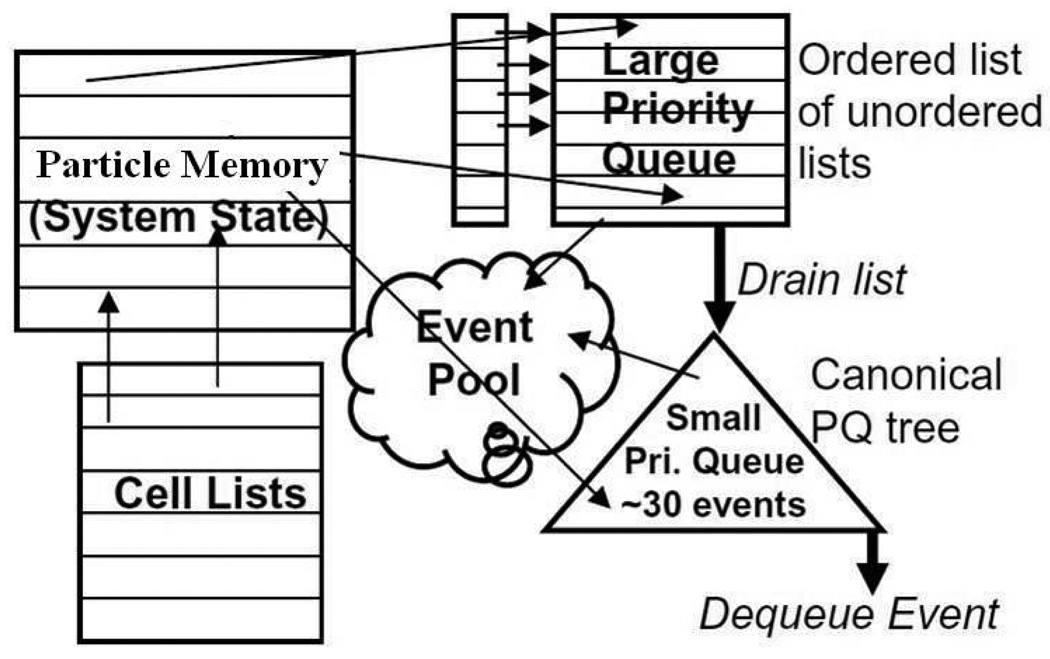
The observation is that most of the O(logN) complexity of the priority queue operations is derived from the continual accesses of events that are predicted to occur far in the future. The idea is to partition the priority queue into two structures. This is shown in Figure 4, along with most of the other major data structures. A small number of events at the head of the queue, say 30, are stored in a fully ordered binary tree as before, while the rest of the events are stored in an ordered list of small unordered lists. Also retained are the particle memory and the per-particle linked lists of events that are used for invalidates.
Figure 4.
DMD data structures including Paul’s two-level event queue
To facilitate further explanation, let Tlast be the time of the last event removed from the queue and T be the time of the event to be added to the queue. Each of the unordered lists contains exactly those events predicted to occur within its own interval of Ti…Ti + Δt where Δt is fixed for all lists. That is, the ith list contains the events predicted to occur between (T – Tlast) = i * Δt and (T – Tlast) = (i + 1) * Δt. The interval Δt is chosen so that the tree never contains more than a small number of events.
Using these structures, the basic operations are performed as follows.
Dequeue: While the tree is not empty, operation is as before. If the tree is empty, a new ordered binary tree is created from the list at the head of the ordered array of lists.
Insert: For (T – Tlast) < Δt, the event is inserted into the tree as before. Otherwise, the event is appended to the ith list, where i = [(T – Tlast)/Δt].
Delete: If the event is in binary tree, it is removed as before. If it is in the unordered list, it is simply removed from that list. It should be noted that, particle and event data is stored such that finding an event to delete takes O(1) time.
Advance/Maintain: The array of lists is constructed as a circular array. Steady state is maintained by continuously draining the next list in the ordered array of lists whenever a tree is depleted.
For the number of lists to be finite there must exist a constant Tmax such that for all T, (T - Tlast) < Tmax. In the rare case where this relation is violated, the event is put in a separate overflow list, which is drained after all the lists have been drained once. Performance of this data structure (PaulQ) depends on tuning Δt. The smaller Δt, the smaller the tree at the head of the queue, but the more frequent the draining and the larger the number of lists.
We return to the other data structures in Figure 4. For any simulation model, all of these structures can be implemented highly efficiently as fixed sized arrays [2]. Particle memory depends on the number and type of particles; cell lists on the simulation size and cell size; event pool on the number of particles, the insertion policy, and the energy landscape; and the queues depend on the parameters just described.
2.4 Experimental Methods
The baseline code is by Rapaport and is described in [21] (Ch14). This code is highly efficient being written in C in a “FORTRAN-like” style and including standard optimizations (such as described in [2]). All modifications were also written in C and compiled using gcc (v4.2.4) with O3 optimization. Execution times were measured on two platforms.
A 64-bit, 2-processor, 8-core Dell Precision T-7400 Workstation with 4GB of RAM. Each processor is a quad-core Intel Xeon CPU E5420 (Harpertown) @2.50GHz. This was built with a 45nm process, has a Penryn microarchitecture, 32KB L1 I-Cache, 32KB L1 D-Cache, and two 6MB L2 caches, each shared by two cores. The operating system was Ubuntu Linux (v8.04).
A 64-bit, 2-processor, 12-core AMD Magny-Cours Server with 16 GB of RAM. Each processor is a 6-core AMD Opteron CPU 6172 (Istanbul) @2.10GHz. This was build with a 45 nm process, has a Bulldozer architecture, 64KB L1 I-Cache, 64 KB L1 D-Cache, 512KB L2 Cache, 6 MB of L3 cache shared by the 6 cores. The operating system was GNU/Linux (v2.6).
DMD simulations are generally evaluated in terms of events computed per unit time. For clarity, we count only Payload events. These include all events that involve particles crossing discontinuities in potentials (as shown in Figure 1). Overhead events are needed only to ensure correct simulation and/or maintain data. There are two such event types.
Cell-crossing: When a particle crosses the boundary of a cell. This is present in all models.
Advancement: This is required only if we implement Lubachevsky-style event queuing [11] where only the earliest event for each particle is queued. If that earliest event Ea,b for a particle a is a collision, but the other participant b is involved in another collision Eb,c before Ea,b takes place, then Ea,b event is turned into an advancement event Ea for a. During the execution of Ea, the position of a is updated and new events are predicted.
In all experiments we simulated 10 million payload events, but in general performance is independent of simulation time beyond a brief initialization phase. Following standard procedures (see, e.g., [21]), the particles were initially distributed uniformly in a 3D grid. The simulation box size was determined from the density and the number of particles. Particles were assigned velocities in random directions, but with a fixed magnitude depending on the temperature. Velocities were adjusted to make the center of mass stationary. Particles were then assigned to cells and events predicted and scheduled for each particle. Runtime was measured after all initializations were done, and when actual event processing had begun.
2.5 Simulation Models and Conventions
Various models have been created to accommodate molecular systems of differing complexity, flexibility, and desired resolution of the system of interest. They all have in common, however, the use of spherically symmetric step potentials, some of which are shown in Figure 1. Somewhat surprisingly, DMD simulator throughput (in events/second) is affected only marginally by model complexity. For example, the difference in throughput between simulations using a simple square well, shown in Figure 1b, and complex square wells, shown in Figure 1c and 1g, is negligible (see Section 6.1). The reason is that the added model complexity is processed using a switch/case statement to identify the correct discontinuity, which requires only a few instructions. A similar observation is made for per-particle differences in step functions, including particle radius. As a result the simulation throughput also doe s not materially change as a function of number of particle types in the simulation, or whether some particles are covalently bonded or not. Some factors that do affect throughput are the number of particles, the radius of the furthest discontinuity from the particle center, and the simulation density.
As a consequence, for this study, instead of parallelizing any particular models in use, we chose, without loss of generality, a generic simulation framework that encompasses the properties that have an effect on event throughput. Note that adding complexity, such as processing reactions rather than simple discontinuities in potentials, necessarily adds to the work needed per event and so improves the scalability of most parallelizations. In that sense the performance improvements reported here are lower bounds.
Our simulations are of identically sized hard spheres of unit diameter and unit mass. Simulated time is presented in MD unit time. Conversion from MD units to real units is immediate and a description with specific examples can be found in [21]. Systems have periodic boundary with wrap-around effects considered as necessary. Unless stated otherwise, we use a square well potential with fixed radius of 2.5 MD units. Variations in density and temperature are tested. For density, a liquidlike density of 0.8 is used by default, but there is little effect on performance until the density falls below 0.4 (see Section 6.1). Temperature variation has virtually no effect on relative performance (see Section 6.1). Cell lists are used to bound the complexity of event prediction, with cell size fixed at slightly larger than the square well radius. The selection of cell size is described in Section 3.2. In the experiments we report results for three different sizes: 2K, 16K and 128K particles. There is little relative change in performance beyond 128K particles. The chosen parameters are typical for liquid simulation [21] and are sufficiently general to represent most of the biomolecular DMD simulations reported in the literature.
3 Establishing a DMD Serial Baseline
The primary purpose of this section is to describe the parameter selection of the serial baseline code and then present a profile of that code. In the process we update results of long-standing issues of cell size and queue insertion policy, as well as describe the interaction of the latter with the latest queue data structure.
3.1 Selecting PaulQ Parameters
Two parameters, the number of linear lists n and the scaling factor s (s = 1/Δt) must be chosen to specify the implementation of the PaulQ [18]. The method described in Paul’s paper to determine these parameters ends up requiring large memory, due to having too many lists (example: list size of 35×106 for 70K particles). For our simulations, we determined in a slightly different way that is much simpler and requires less memory. It should be noted that, as also mentioned in paul’s paper, the performance of PaulQ is only marginally sensitive to the choice of s. For example, a choice of s which results in a doubling of the number of events in the binary tree results in only one additional level in the tree.
Step 1. Through simulation, fix the # of lists, n
For Rapaport policy: n = SimSize × 64
For Lubachevsky policy: n = SimSize
Thus, n is always set to be the same as the size of the event pool, which is the maximum possible number of predicted events at any given time. In parallel implementations, since events are deleted in a lazy manner, sometimes we may need to have more events in event pool than the maximum possible number of predicted events. However, such case was not observed in the simulations we performed.
Step 2. Tmax (the maximum difference between the time associated with a newly predicted event and the current time) is determined using cell-crossing events only.
Step 3. The scaling factor s is determined using the following equation: n = s × Tmax.
Step 4. A few other neighboring values are tried for scaling factor and the best value is chosen.
Values are presented in Table 1.
Table 1.
Computed parameters for various simulation sizes and queueing policies.
| SimSize | 2K | 16K | 128K | |||
|---|---|---|---|---|---|---|
| # of lists | s. factor | # of lists | s. factor | # of lists | s. factor | |
| Rappaport | 131072 | 1195 | 1048576 | 63 | 8388608 | 72 |
| Lubachevsky | 2048 | 2304 | 16384 | 13696 | 131072 | 41984 |
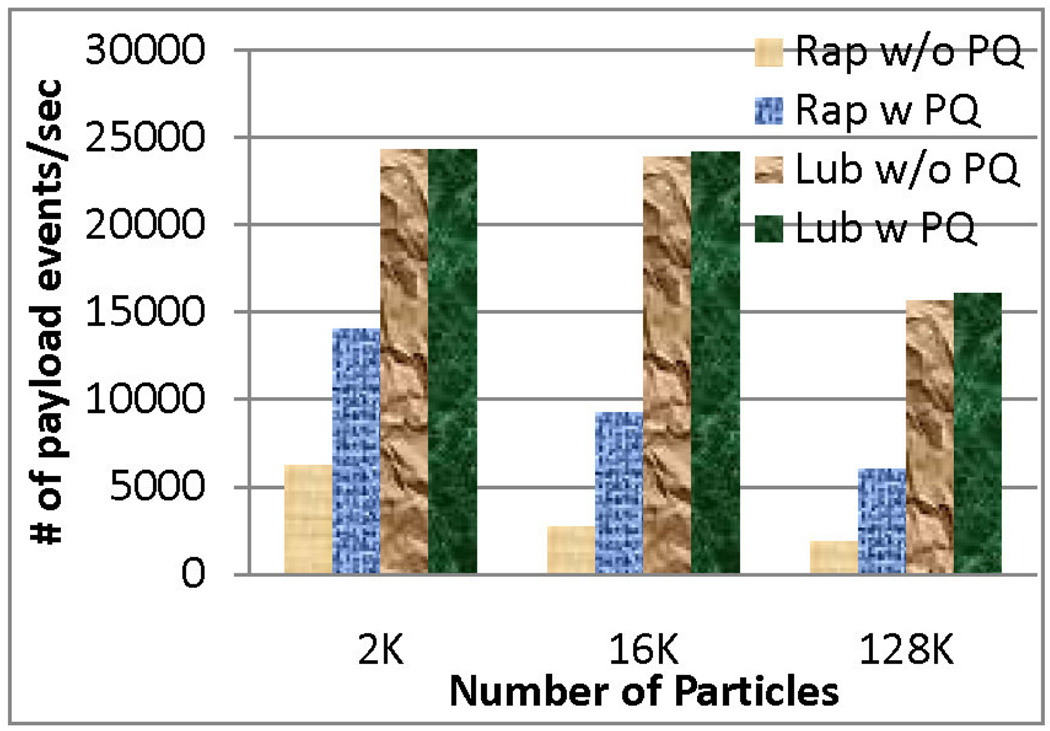
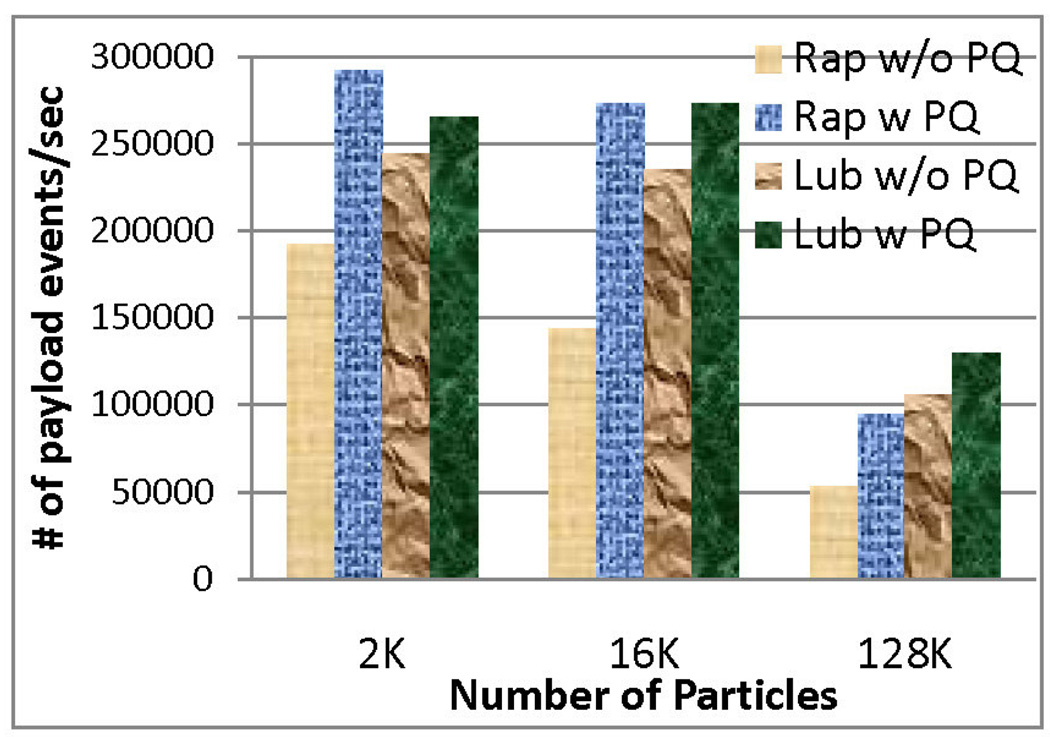
Figure 6 shows how implementing the PaulQ improved performance for the square well model simulation, the target of this paper. For reference, we also present the result for a simple hard sphere model in Figure 5. As shown in these figures, the speed-up was more significant for Rapaport style, since it originally had a larger tree size and more frequent access to the tree. Lubachevsky style already had smaller sized tree and less frequent updates, hence the improvement was less too. The average tree size was about 60 for the Lubachevsky policy and about 200 for the Rapaport policy for the square well model.
Figure 6.
Performance of Rap Vs. Lub (Square-well model of density 0.8)
Figure 5.
Performance of Rap Vs. Lub (Simple hard sphere model of density 0.8)
We also examined reducing the number of lists with the more aggressive use of the “overflow list” (see Section 2.3). We found, however, that unlike our hardware implementation of this algorithm [8], this optimization has little benefit here.
3.2 Selecting Cell Sizes
Selecting the cell size involves determining the optimal trade-off between the number of predictions per event (more with a larger cell size) and the fraction of overhead cell-crossing events (decreases with larger cell size). Setting the cell size to slightly larger than the cut-off radius ensures that all relevant events can be found in the 27 cell neighborhood. For higher density systems, such as we assume here for liquid simulations, this is the cell size we use; the resulting proportion of cell-crossings to payload events is about 1:5.
For low density systems, especially when they are simulating only hard spheres with no square well potential, a substantially larger cell size is naturally optimal. We found, however, that a density somewhat lower than 1 particle per cell is preferred; rather the cell size should be selected so as to fit 3–6 particles in the 27-cell neighborhood.
3.3 Event Queuing Policy: Rapaport vs. Lubachevsky
There has been much discussion about the relative benefits of the two best-known queueing policies, those originated by Rapaport [20] and Lubachevsky [11], respectively, and reviewed here in Sections 2.1 and 2.5. We find that the discussion is far from over and likely to continue as new algorithms, simulation models, and computer architectures are explored.
The Rapaport method queues all predicted events and also maintains a linked list of events for each particle to facilitate event invalidation. Since it saves all predicted events, cell-crossing events can be implemented efficiently. Unlike the Lubachevsky method, it does not require advancement events.
One advantage of the Lubachevsky method is that it has fewer events to queue, although with a small tree accessed with logarithmic complexity the number of operations saved may not be large. There is some advantage, however, with respect to memory hierarchy performance in having a smaller working set size. Another advantage of the Lubachevsky method is that it avoids the linked lists in the Rapaport method.
There also exists a hybrid approach that saves all predicted events but queues only the earliest one [15]. This reduces the tree size, but still requires linked lists. The PaulQ data structure, however, diminishes the advantage of this method, and the linked list operations dominates. We therefore consider further only the Rapaport and Lubachevsky methods.
Use of the PaulQ data structure favors Rapaport because the tree operation is no longer the most time consuming part. But Rapaport style queueing still requires linked lists to track all events of each particle. Figures 5 and 6 show the improvement in both methods when the PaulQ is used.
Simulation density matters. In low density simulations, particles travel farther between collisions causing a higher proportion of cell-crossing events. This favors Rapaport because, in the Lubachevsky method, regardless of event type, all neighboring cells must be checked to predict new events. But in the Rapaport method, for cell-crossing events, only one-third of the neighboring cells need to be checked. That is, only the particles in the newly entered cell need to be checked.
Models requiring a large number of predictions per particle, such as square-wells, favor Lubachevsky because it keeps only the earliest. Models requiring small numbers of predictions favor Rapaport because it does not have Advancement events.
From our experiments, we have found that the Lubachevsky method performs better as the system becomes denser and larger, the Rapaport method for the converse. Since we are here more concerned with the former, we assume the Lubachevsky method for the remainder of this paper.
3.4 Serial Reference Code
We have augmented the baseline code to support:
The Lubachevsky insertion policy (in addition to Rapaport’s),
Paul’s data structure, and
Arbitrary spherically symmetric potentials.
The event insertion policy and data structure modifications were validated against the original code and square-well potential was incorporated into the validated version. The new potential was verified through checks of internal consistency and of conservation of physical invariants.
Table 2 shows event statistics and serial runtimes. In all cases, the force model was the square well, density was 0.8, queueing was Lubachevsky style, and the event queue used the PaulQ data structure. Scaling results in Section 6 are all normalized to these serial runtimes. In profiling the serial baseline execution we found the following breakdown: event execution, including state update, takes 1%; event commitment, including queueing operations, takes 3%; and event prediction takes 97%.
Table 2.
Breakdown of event types for runs of 10M payload events.
| # of particles | Runtime (sec) | % cell crossings | % advancements | % payload events |
|---|---|---|---|---|
| 2K | 411s | 1.3% | 36.0% | Repulsive collision: 13.9% Well entry: 17.6% Well exit: 15.6% Well bounce: 15.6% |
| 16K | 414s | 1.3% | 36.2% | Repulsive collision: 12.0% Well entry: 20.0% Well exit: 15.0% Well bounce: 15.5% |
| 128K | 623s | 1.8% | 36.9% | Repulsive-collision: 6.1% Well entry: 28.3% Well exit: 13.9% Well bounce: 13.1% |
4 Issues in Parallelizing DMD
4.1 PDMD Hazards
Parallelizing DMD presents certain difficulties. Given three events Eex, Epre, and Ecan where:
Eex is the event at the head of the queue being processed at time t,
Epre is an event predicted due to Eex, and
Ecan is an event cancelled due to Eex.
Then
Epre can be inserted at any position in the event queue, including the head,
Ecan can be at any position in the event queue, including the head, and
another event E caused by Eex (perhaps indirectly through a cascade of intermediate events) can occur at time t + ε after Eex where ε is arbitrarily small and at a distance δ from Eex in the simulation space where δ is arbitrarily large.
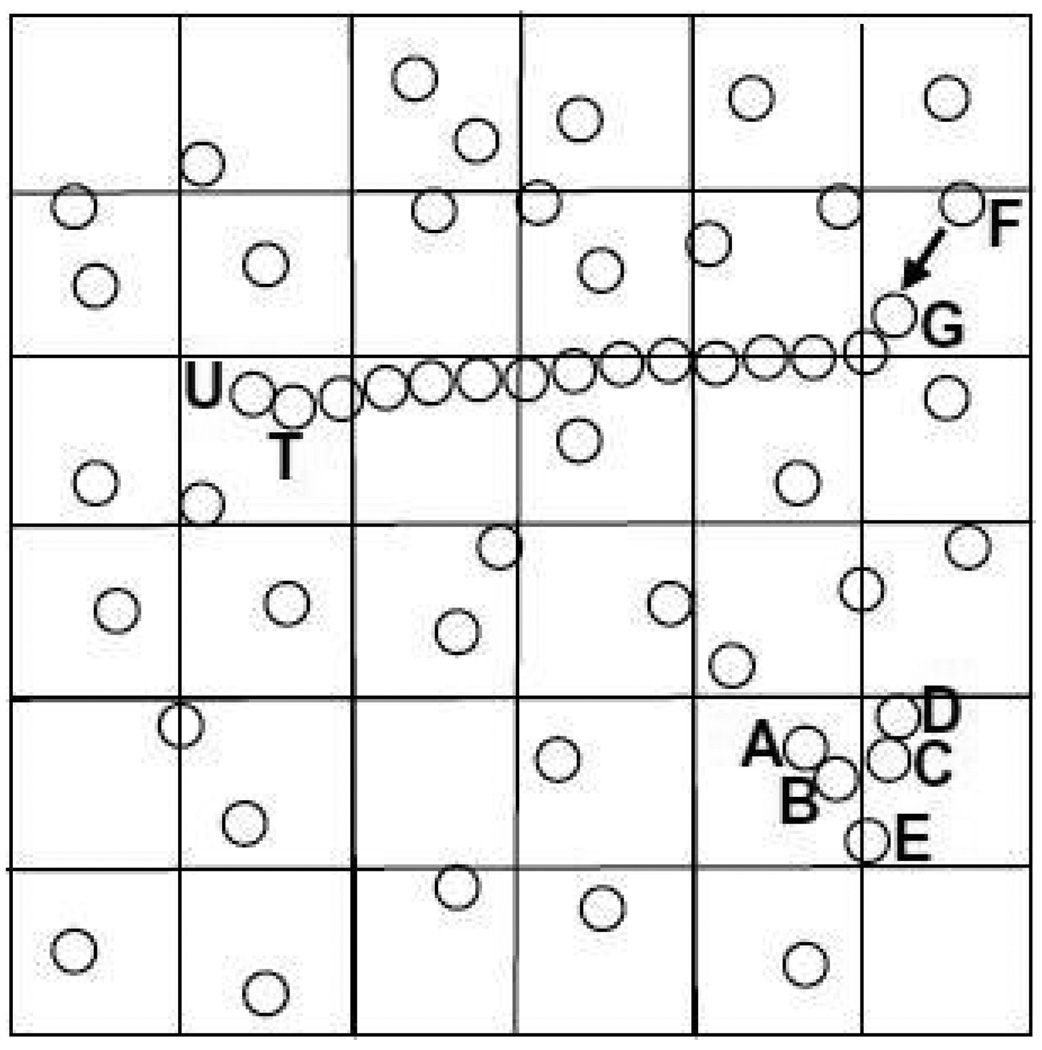
Examples of these occurrences are shown in Figure 7. In the lower part, events EA,B and EC,D occur at times t0 and t0+ε. Previously predicted event EB,E gets cancelled, even though it is currently at the head of the queue. Newly predicted event EB,C will happen almost immediately and so gets inserted at the head of the queue. The upper part of Figure 7 shows how causality can propagate over a long distance δ. After EF,G, a cascade of events causes ET,U to happen almost instantly and on the other side of the simulation space. Although long distance events such as in Figure 7 may appear to be rare, they are actually fundamental to polymer simulations. The polymer forms a chain with rigid links. A force applied to one end - say, by an atomic force microscope that is unraveling a protein - creates exactly such a scenario.
Figure 7.
Events AB and CD cause BC and cancel BE. Event FG causes TU almost instantly and at long distance.
These conditions introduce hazards in to the concurrent processing of events. In each of the following cases, let E1 and E2 be the events in the processing queue with the lowest and next lowest time-stamps, respectively.
Causality Hazards occur when the processing of events out of order causes an event to occur incorrectly. For example, let event E1 be such that its execution causes E2 to be cancelled, either directly, or through a cascade of new events inserted into the event queue with time-stamps between those of E1 and E2. Then the sequence E1, E2 presents a causality hazard and should not be processed concurrently.
Coherence Hazards occur when predictions are made with stale state information. For example, let E1 and E2 be processed concurrently. Then even if there is no causality hazard, there may still be a coherence hazard. For example, a particle taking part in E2 may be predicted to collide with a particle taking part in E1, but only in the now stale system state prior to update due to the execution of E1. Coherence hazards can exist only among events in the neighboring cells.
Combined Causality and Coherence Hazards occur as follows. Let a new event Enew caused by E1 be inserted into the queue ahead of E2 and not invalidate E2, but still result in a coherence hazard. That is, Enew could change the state used in E2’s prediction phase, or vice versa.
Efficient detection and resolution of these hazards is a key to creating scalable parallel DMD codes.
4.2 Possible Approaches to PDMD
Parallelization of DMD can be achieved in at least three different ways.
Spatial decomposition. The simulation space is partitioned into some number of sectors and one or more are assigned to each thread. Events can be processed conservatively, letting no causality hazard occur ever; or optimistically allowing some sort of rollback when causality hazard occurs. In any case, as we mentioned before, this approach becomes complex for 3D simulations. For cubic decomposition, each thread must exchange information with a large number of neighbors (26) for potential conflicts. Or, if partitioning is by slices, then it must handle a drastic increase in the ratio of surface area to volume and so the number of interactions per thread-pair. Spatial decomposition is likely to become ever more challenging as the latency ratio of interprocessor communication to event processing continues to increase.
Functional decomposition. For any event, there is work that can be performed in parallel. In particular, there are likely to be predictions needed with respect to a number of nearby molecules. The advantage of functional decomposition within events is that hazards are not an issue. The disadvantage is that the predictions can be executed in a few hundred nanoseconds and so extremely fine-grained invocation and synchronization is required.
Event based decomposition. Some number of threads process events in parallel, dequeueing new events as the old ones are completed. This is the method we propose in this paper. The advantage is that concurrency can be tuned to limit synchronization overhead (as described in Section 5). The disadvantage is that some serialization cannot be avoided.
While previous PDMD work has been based on spatial decomposition [5, 11, 13, 16] we are not aware of any such systems currently in use for 3D simulations. We are not aware of any system based on functional decomposition. We believe our system to be the first to use event based decomposition.
5 Parallelizing DMD through Event-Based Decomposition
5.1 A Pipelined Event Processor
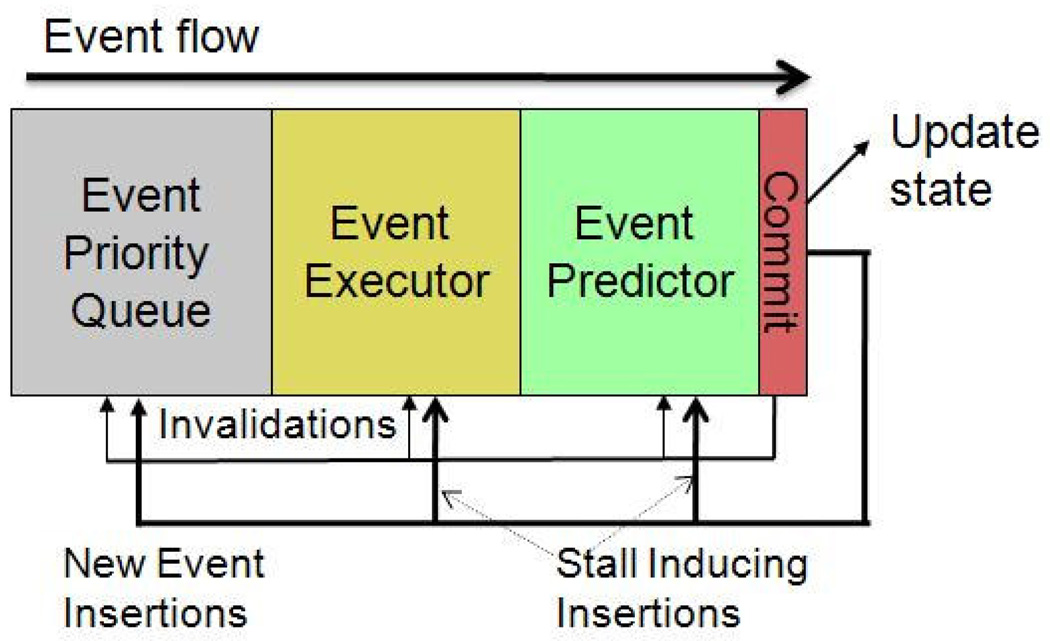
The main idea in our design is to process DMD in a single pipeline (as shown in Figure 8). That is, while a large number of events can be processed simultaneously, at most one event at a time is committed. Viewed another way, this design is of a microarchitecture that processes events rather than instructions: the logic is analogous to that used in modern high-end CPUs for speculative instruction execution. In this subsection we describe how hazards and commitment are handled in this literal design (see [17] for details). In the next we describe how this design translates conceptually into a multithreaded software version. We end this section by describing some deeper software issues and how they can be addressed.
Figure 8.
DMD with a dedicated pipelined event processor. The event queue is several orders of magnitude larger than the processing stages even for modest simulations.
Commitment consists of the following steps: (i) updating the system state, (ii) processing all causal event cancellations and (iii) new event insertions, and (iv) advancing the event priority queue. As in a CPU, dependences—this time among events rather than instructions—combined with overlapped executions cause hazards. And as in a CPU, these hazards are compounded by speculation.
Causality Hazards: The problem is that a new event can be inserted anywhere in the pipeline, including the processing stages. But this cannot be allowed because then it will have skipped some of its required computation. Insertion at the beginning of the processing stages, however, results in out-of-order execution which allows causality hazards. A solution is to insert the event at the beginning of the processing stages, but to pause the rest of the pipeline until the event finds the correct slot. This results in little performance loss for simulations of more than a few hundred particles.
Coherence Hazards: After an event E completes its execution, it begins prediction. The problem is that there will be several events ahead of E, however, none of which has yet committed, but which will change the state when they do. This has the potential to make E’s predictions incorrect because they may be made with respect to stale data (coherence hazard). One solution begins with the observation that E is predicting events only in its 27 cell neighborhood. It checks the positions of the events ahead of it in the predictor stages, an operation we call a neighborhood check, or hood-check for short. If the neighborhood is clear, i.e., it is hood-safe, then E proceeds, otherwise it waits. This check results in substantially more performances than that due to causality hazards, but it is still not large for simulation spaces of 323 or greater.
Combined Causality and Coherence Hazards: The problem is that an event E can be inserted ahead of events that have already begun prediction assuming they were hood-safe. The solution is as follows. As before, E must be inserted at the beginning of the processing stages. The added complication is that events in the predictor stages with time-stamps greater than E must restart their predictions. Since the probability of such insertions is small, however, this causes little additional overhead.
5.2 Conceptual Description of Software Implementation
The conceptual implementation of our method on software is shown in Figure 9.
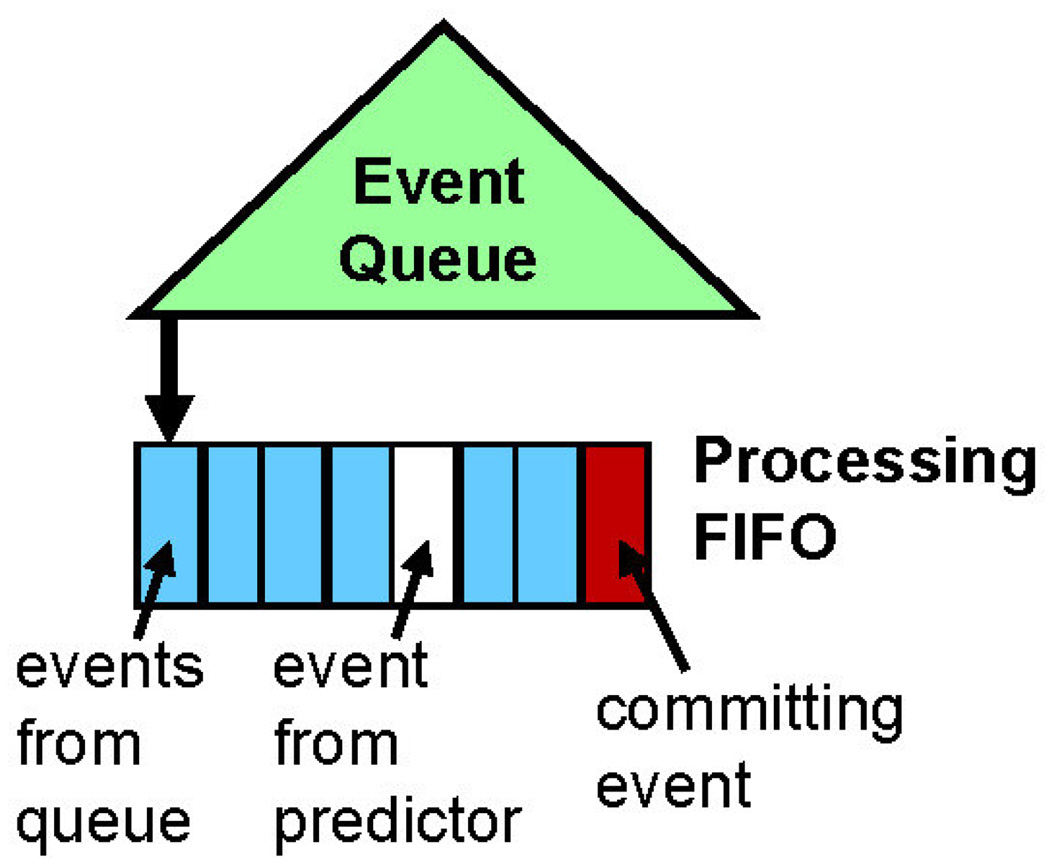
A FIFO is appended to the head of the event queue and contains the events that are currently being processed. This is analogous to the following processing components in Figure 8: the Event Executor, the Event Predictor, and Commit. While this FIFO is not necessary algorithmically, it is useful in visualizing how hazards and synchronization are handled.
Each event in the FIFO is processed by an individual thread.
The FIFO is ordered by time-stamp to facilitate handling of hazards, but processing is not otherwise constrained.
Events are committed serially and in order. This allows the handling of all causality hazards.
Events can be added to FIFO in two ways. They can be dequeued from the event queue and appended to the back of the FIFO. Or they can be inserted directly from the predictor.
All coherence hazards are handled by checking whether any of the preceding events in the FIFO are in the same neighborhood. Since such hazards occur rarely (see section 6.2), the hood-check is not done before a thread takes an event for processing, rather it is done right before committing. A small committed-event history is maintained for this purpose.
Figure 9.
Parallel DMD implemented on software with an event FIFO.
Event handling now contains the following tasks where processing and commitment are separated explicitly.
Event Execution and Prediction: Calculate state updates, predict new events, and save these as temporary data.
Synchronization: Wait until the event’s turn to commit.
Handling potential coherence hazards: Perform hood-checks; restart the event or update processing results as necessary.
Committing and, potentially, discarding, the processing result.
5.3 Implementing PDMD through Event-Based Decomposition
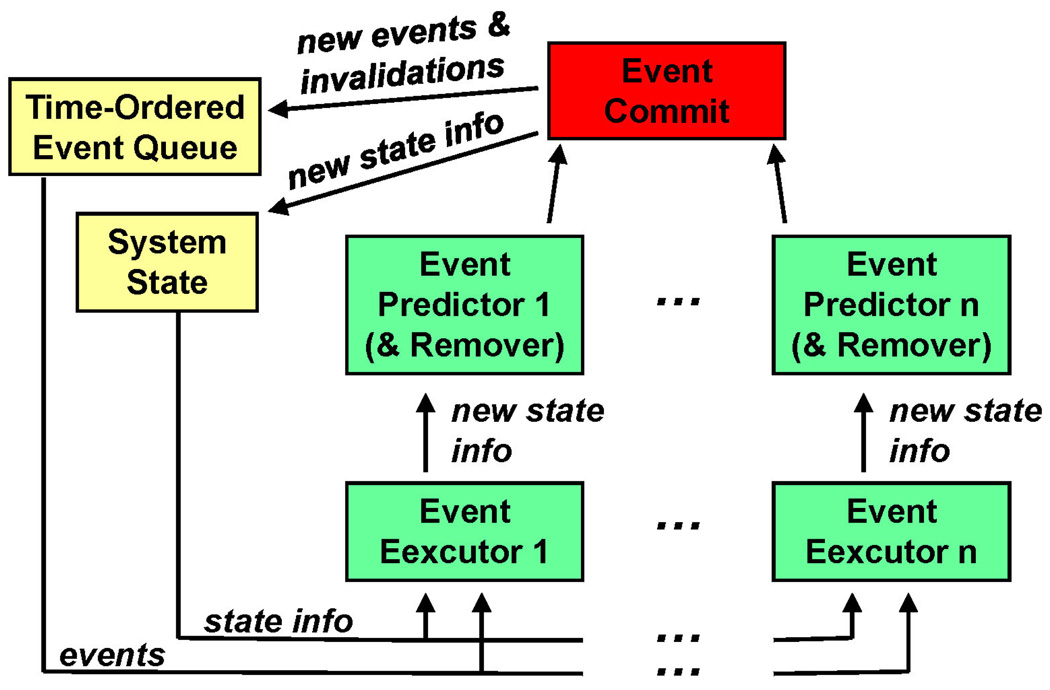
After translating these ideas into the standard DES framework (e.g., Figure 2), we obtain the design in Figure 10. There are several implementation issues which must be handled carefully if any speed-up is to be obtained: serial commitment, including updates of all of the data structures; locks on shared data structures, including the potential waiting time for threads to obtain new data; and contention in accessing a shared computing resource, i.e., shared memory.
Figure 10.
PDMD in the standard DES framework.
PDMD through event-based decomposition can be implemented in various ways, depending on the synchronization scheme. Here we present three implementations where two implementations (the first and the third) proved to be more efficient than the other.
Implementation of Code 1
In Code 1 synchronization is done using a variable, EventToCommit, which holds the ID of the highest priority event, i.e., of the event at the head of the queue. Initially, Thread 0 is assigned the highest priority event and EventToCommit is set to the ID of that event. Since all threads will poll EventToCommit to check their turn, no other synchronization is necessary. A thread updates the shared data structures and particle states only when it has processed the highest priority event. Thus only one thread commits at a time (and updates shared data structures and particle states). A committing thread also dequeues the next highest priority event available from the event queue, before it updates the value of EventToCommit. This guarantees that the highest priority event is always assigned to a thread.
Once an event is assigned to a thread, the event will not be deleted and its turn to commit will eventually arrive. In the case where it has to be deleted, it is only marked as canceled; at commit time it is discarded. This ensures that no thread ends up in an infinite loop. Hazards (and conversion to advancement events for the Lubachevsky method) are checked before committing the result of an event. If hazards (or conversions to advancement events) exist, then the event is reprocessed as necessary.
As a thread commits an event it notifies all the other threads. This information is used by each thread to handle hazards and conversions. Every thread maintains a fixed size data structure for this information. If too many threads commit ahead of a particular thread and cause an overflow, then that thread simply reprocesses its event at commit time.
Main Thread{
        Initialize all data structures, including the event queue;
        EndCondition = False;
        EventToCommit = The very first event to be processed and committed;
        Invoke Compute Threads and assign them each the highest priority event that is available.
(Note: Only one thread will be assigned the ’EventToCommit’ event; Main Thread will also continue as a Computing Thread.)
         Wait until all threads are done. }
Compute Thread{
        While (Not EndCondition){
            Process assigned event;
            Wait until ( (EventToCommit = assigned event) or (EndCondition));
   (Note: Only one thread will reach beyond this point at a time, except when EndCondition is true;)
            If (EndCondition) return;
            If (Event has been cancelled){
                 Discard event;
                 Assign itself the next highest priority event that is available;
                 EventToCommit = Next event to be processed and committed; }
            Else if (No ConversionToAdvancement and No hazard) {
                 Commit result;
                 Assign itself the next highest priority event available;
                 Update EndCondition;
                 EventToCommit = Next event to be processed and committed; }
            Else{
                 Update result or re-process the event as necessary;
                 Commit result;
                 Assign itself the next highest priority event available;
                 Update EndCondition;
                 EventToCommit = Next event to be processed and committed; } } }
Implementation of Code 2
Code 1 has a simple synchronization method but requires threads to wait for their turn to commit. Due to load-imbalances (different types of events require different amount of processing time), unpredictable cachebehavior, and time to update the common data structures, threads spend much time waiting. In Code 2, threads do not wait; rather, after processing their assigned events, they only mark the event as processed. They then acquire a centralized global lock and try to commit all available events that are already processed. Then, as before, they assign themselves the highest priority unprocessed event, release the lock, and start processing the new event.
A centralized fixed size list of committed events is maintained. When an event is assigned to a thread, the current number of committed events is recorded. This number is used during commitment to determine hazards and conversions. As before, if too many events have been committed before a processed event can be committed, making it impossible to determine the hazards and conversions, then that event is simply restarted.
Main Thread{
        Initialize all data structures, including the event queue;
        EndCondition = False;
        Invoke Compute Threads and assign them each the highest priority event that is available.
        (Note: Main Thread will also continue as a Computing Thread.)
        Wait until all threads are done. }
Compute Thread{
        While (Not EndCondition){
            Process the assigned event and mark it as processed;
            Acquire Lock;
   (Note: Only one thread will reach beyond this point at a time)
            If (EndCondition) Release Lock and return;
            While (The highest priority event is marked as processed){
               If (Event has been cancelled){
                    Discard event; }
               Else if (No ConversionToAdvancement and No hazard) {
                    Commit result;
                    Update EndCondition; }
               Else{
                    Mark the event as not-processed;
                    It will be assigned to some thread again; } }
            Assign itself the next highest priority event that is available;
            Release Lock; } }
Implementation of Code 3
Code 2 allows threads to continue immediately after they have finished processing their assigned event, but it requires continually acquiring a centralized lock. Since the processing time of an event is short (typically 3 – 60 us), this requirement results in a substantial loss of performance. We have found that instead of allowing all threads to commit and get new work, better performance can be achieved by assigning a Master Thread for this purpose. This mechanism, however, requires synchronization between each master-slave thread pair. But now, instead of using one centralized lock, we use separate locks for each master-slave thread pair.
The implementation of the locks is done using flags and by allowing threads to spin on the values of their respective flags (somewhat similar to a ticket-lock). Two flags, threadGotWork and threadFinishedWork, are used for each master-slave pair. The Master Thread raises the flag threadGotWork for each thread once it has assigned an event to that thread. Meanwhile, each Slave Thread spins on its threadGotWork flag until it is raised. Once it is raised, the Slave Thread reads the event data and resets the flag. When the Slave Thread finishes processing the event, it raises its threadFinishedWork flag and again waits for its threadGotWork flag to be raised.
The Master Thread checks the threadFinishedWork flags of all the threads. Once it is raised by any Slave Thread, the Master Thread resets that flag, tries to commit the event, and assigns a new event to that thread. At this point, the Master Thread raises that threads threadGotWork flag and processing continues.
We declare these flags such that they reside in different cache blocks so that each thread can spin on their values independently without any false sharing. A centralized fixed-size data structure of committed events is maintained; its processing is analogous to that in the previous Codes.
Main Thread{
        Initialize all data structures, including the event queue;
        EndCondition = False;
        For (i = 0; i < threadCount; i++){
             threadGotWork[i] = 0;
             threadFinishedWork[i] = 1;
             threadEventID[i] = −1; }
        Invoke Compute Threads and assign them each the highest priority event available.
        (Note: Main Thread will continue as the Master Thread, threadNum = 0.)
        Wait until all threads are done. }
Compute Thread (threadNum){
        While (True){
            While (threadGotWork[threadNum] = 0){} // wait for flag;
            if (threadGotWork[threadNum] = −1) return;
            eventID = threadEventID [threadNum]; // get event
            threadGotWork[threadNum] = 0; // reset flag
            if (eventID != −1) Process Event;
            threadFinishedWork[threadNum] = 1; // raise flag } }
Master Thread (threadNum) {
        SlaveCount = Number of slave threads;
        While (SlaveCount != 0){
            For (i = 1; i < threadCount; i++){ // exclude master thread
                 if ( threadFinishedWork[i] = 1){ // check flag
                       threadFinishedWork[i] = 0; // reset flag
                       if (threadEventID[i] != −1) // mark thisevent as processed.
                       if (EndCondition){
                            threadGotWork[i] = −1; // signal end
                            SlaveCount = SlaveCount −1; }
                       else{
                            threadEventID [i] = next highest priority event available; // −1 if none available;
                            threadGotWork[i] = 1; } } }
            Commit highest priority events that are processed;
            Handle hazards, conversions, and restarts;
            Update EndCondition; } }
5.4 Efficient Restart
Restarting an event every time there is a coherence hazard (alone or combined with a causality hazard) is inefficient. We optimize this by updating only the necessary portion of the prediction.
In case a payload event has taken place in the neighborhood before the current event, it suffices to update the prediction for only those particles (one or both) that took part in that event and are in the same neighborhood.
In case a cell-crossing event has taken place in the neighborhood before the current event, if that new particle entered the neighborhood, then updating the prediction only for that particle suffices. If that new particle left the neighborhood, then (for our implementation) the event must be restarted. This is because, depending on the time of commitment of that cell-crossing event, it is possible that the current event may have used the incorrect cell-list (linked list of particles in the same cell) values.
In case an advancement event has taken place in the neighborhood before the current event, theoretically, updating prediction result for that particle is not needed. This is because nothing about that particle has changed. But, to ensure compatibility with the serial output, we update the prediction for that particle. If hardware had infinite precision, this would not be necessary.
6 Results
This section is organized as follows. We begin by presenting the basic scalability results of the three Codes presented in Section 5.3, together with a qualitative analysis. In the following subsections we present more detailed analyses: determining the parallelism inherent in PDMD with event-based decomposition; basic modeling of the inherent architectural limitations; and a quantitative analysis of the most promising Code, together with an experimentally validated analytical model that accounts for the details of the target architecture.
6.1 Scalability
The experimental setup and the baseline code are described in Section 2.4 and Section 3.4, respectively. The parallel versions have been created as described in Section 5. As described in Section 2.5, the energy model is of uniform hard spheres of radius 1 with simple square wells of radius 2.5. As discussed there this model generalizes with respect to relative performance to most models described in the literature.
All parallel versions were verified to have complete agreement with their respective serial versions. This consistency includes complete matches of all particle histories. The method used was as follows. All events were saved in order with participant information and time of occurrence. This was done for both serial and parallel versions which were checked to be exactly the same, including overhead events. Other physical parameters, e.g., energy, were also checked to have the same values. The codes are running and have been so tested in both Windows and Linux environments (except some versions that were used to test system-specific lock implementations).
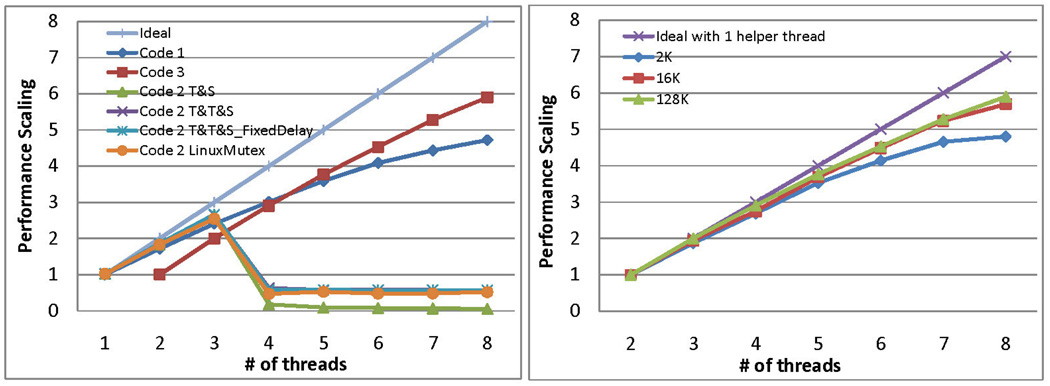
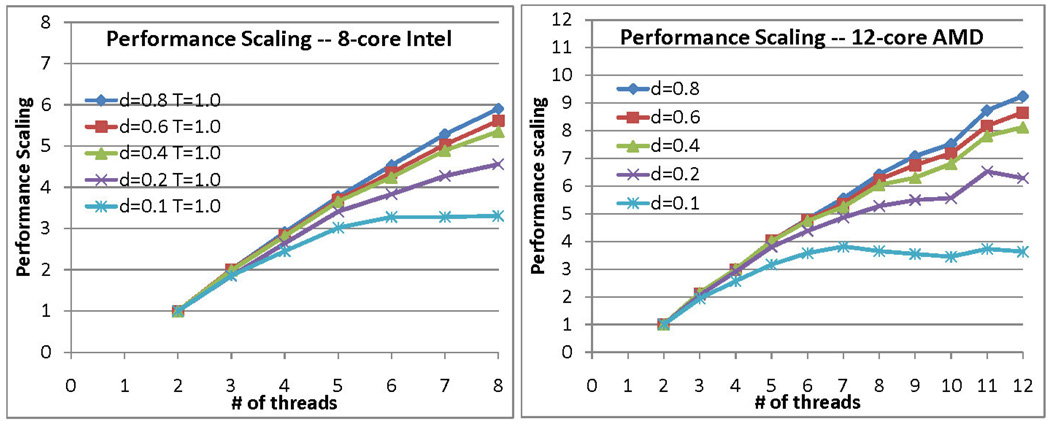
The primary scaling results are shown in Figures 11 and 12. As shown in Figure 11 (left panel), the best speedup is achieved by Code 3 with 5.9× for a 128K particle simulation using one master and seven slave threads. Figure 12 shows that for the 12-core AMD processor the best speedup is 9.1 with one master and 11 slave threads. Code 2 is clearly not viable, while Code 1 performs better for a smaller number of threads, and Code 3 performs better as the number of threads increased. This is because Code 3 uses a helper thread: initially the overhead is apparent, but it rapidly overtakes the other methods.
Figure 11.
Left panel shows performance scaling of the various Codes. Simulation size = 128K. For Code 2 performance with different locks is shown. Right panel shows performance scaling of Code 3 for different simulation sizes. For both Density = 0.8.
Figure 12.
Performance scaling of Code 3 for different densities and two different processors. Simulation size = 128K.
The right panel of Figure 11 shows the scaling of Code 3 with respect to simulation size: not surprisingly, better scaling is achieved for larger simulations and with the benefit of parallelization diminishing somewhat with small size (2K). This is mostly because of an increase in coherence hazards (see Section 6.2). Since Code 3 appears to be the preferred method, we discuss its performance in detail in the next subsections.
Code 1 has two inefficiencies that result in threads waiting additional time to commit. One is uneven load balance. Payload events spend more time in event-prediction than do cell-crossing events or advancement events. This is because a payload event predicts events for two particles, whereas the other types predict for only one particle. The other is increased cache misses and the random occurrence of those misses. This is because the order of start-of-processing does not guarantee the order of end-of-processing.
For Code 2, we note that the performance collapses suddenly with four or more threads. This is because of the bottleneck at the centralized lock and the small processing time per event. We performed extensive tuning of the lock, starting initially with the standard Linux function Mutex. We found that this Mutex has an undesirable system call and so replaced the function with various hand-tuned alternatives: Test&Set, Test&Test&Set, and Test&Test&SetWithFixedDelay (see, e.g., Culler et al., [3]). As shown in Figure 11, none of these did significantly better than the original.
Figure 12 shows how relative performance varies with particle density. There is apparently little variation for densities higher than 0.4. The effect of density on scaling is that it changes the amount of work per event: As density increases, more particles must be checked for potential events.
A number of other parameters were tested but found not to affect relative performance:
Various combinations of temperatures and particle densities with a temperature range from 0.4 to 1.6 and particle density from 0.1 to 0.8.
Model complexity with number of steps in the square well ranging from 1 to 15.
6.2 Available Concurrency
In this subsection we measure the available concurrency in PDMD (with event-based decomposition) for the simulation models described. Event-based decomposition enables all events to be executed concurrently as long as they are independent. Since this independence is hard to determine a priori—as the system state is changing continuously and unpredictably—all events but that at the head of the queue are necessarily processed speculatively and so may result in work being wasted. There are two possible reasons for this: (i) The event may need to be invalidated due to a causality hazard (and converted into an advancement event), and (ii) the event prediction may need to be recomputed due to a coherence hazard.
Effect of Causality Hazards
Recall that causality hazards occur through the cancellation of a speculatively processed event E when a particle P involved in E has been involved with a preceding event. In the Lubachevsky method this only happens if an event Enew involving P is inserted ahead of E after E has begun processing. We have examined the queue positions into which new events are inserted and have found that the positions are nearly uniformly randomly distributed. Moreover, the number of events in the queue is roughly equal to the number of particles being simulated. We find, therefore, that for likely numbers of threads T and particles N, the probability that an event will be part of a causality hazard Pcausality ≃ T/N. This makes the loss of concurrency due to causality hazards negligible.
A consequence is that few events are inserted into or deleted from the binary tree part of the event queue. Therefore, no additional FIFO-like data structure is needed. Instead, the binary tree is used directly to retrieve the highest priority events.
Effect of Coherence Hazards
Recall that coherence hazards occur when the predictions made during the processing of an event E may have been made using stale data. This occurs when an event preceding E is committed after E has begun processing and has occurred within the cell neighborhood of E. We have examined the spatial distribution of committed events and found that their locations are nearly uniformly randomly distributed. The probability that there will be a coherence hazard is therefore related to the number of threads T, the particle density ρ, and the ratio of the volume of the cell neighborhood to the overall simulation space. The cell neighborhood here is 42 cells rather than 27 because events typically span two neighboring cells. Given a square-well size dsq and a number of particles N, then the probability of a coherence hazard is approximately Pcoherence ≃ 1 – (1 – ρ * 42 * dsq3/N)T. Plugging in typical values of ρ = 0.8, T = 8, dsq = 2.5, and N = 128K, we obtain Pcoherence = .032. This value of Pcoherence, however, serves only as an upper bound on the number of restarts due to coherence hazard: Most can be avoided by using the methods for efficient restart described in Section 5.4.
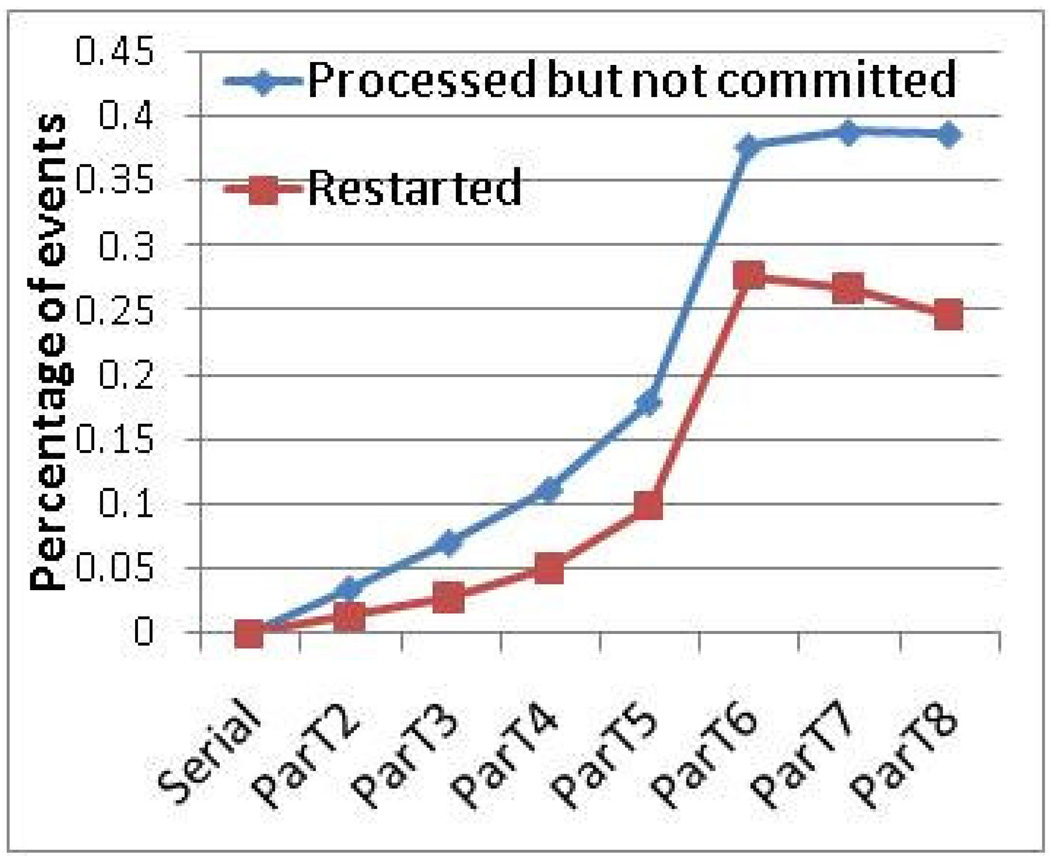
We now relate the theory to the actual implementation and effect on execution time. Figure 13 shows the measured fraction of the events that are processed but not committed and the events that need to restart. The latter events are a subset of the former because every restarted event has been processed before it is restarted. Restarts are mostly due to coherence hazards, but a small fraction are also caused by causality hazard (see immediately above). The fraction that is processed but not committed includes both the events that were restarted and the events that were processed but canceled later due to a causality hazard.
Figure 13.
Events that are processed but not committed represent wasted effort only. Restarted events represent, in addition to wasted effort, the need for the payload effort to be serialized. Graphs are for Code 3 and 128K particles.
Note that updating the prediction results and detecting the need to restart is handled by master thread during commitment. If an event needs to be restarted, it is immediately processed and committed by the master thread. This means that the restart latency is often hidden and slave threads can continue processing new events in parallel. These complex effects account for the non-linear behavior in Figure 13.
The most important conclusion from this subsection is that lack of available concurrency is likely to affect performance by only a fraction of a percent, and is not likely to affect scalability as much as architectural limitations (see Section 6.3).
6.3 Limitations on Scalability - Simple Model
In this Subsection we propose a simple analytical model for the limit on scalability. The two constraints are (i) serial commitment, and the associated synchronization overhead, and (ii) serialized memory access due to the shared bus. Each event-processing task has four components:
Icpu = CPU portion of independent code (independent: can be done in parallel),
Imem = Memory portion of independent code,
Scpu = CPU portion of synchronization code (synchronization: cannot be done in parallel), and
Smem = Memory portion of synchronization code.
Assuming that the application is not memory bound and that computation and memory access can be overlapped, processing time of an event by a single processor = Icpu + Scpu.
Constraint 1 - synchronization. For multiple processors P handling separate events, the Icpu can be processed in parallel while the Scpu must processed serially. Synchronization can be hidden as long as
P * Scpu ≤ Icpu + Scpu;
that is, PSyncLimit = (Icpu + Scpu)/Scpu.
Constraint 2 – shared memory. Similarly, the memory components can be hidden until the memory system approaches saturation:
P * (Imem + Smem) ≤ Icpu + Scpu;
that is, PShMemLimit = (Icpu + Scpu)/(Imem + Smem).
If neither of the constraints is in effect, then the application scales linearly. Otherwise maximum scaling is PSyncLimit or PShMemLimit, depending on which is stronger.
From measurement, we find that Scpu takes roughly 5% and Imem + Smem takes roughly 10% of the total time of event processing with a single processor. We estimate the memory access cycle count to be L2_LINE_MISS_COUNT × 100, where L2_LINE_MISS_COUNT was measured with VTune [22] and each miss is counted as 100 cycles (from [9] pp. 2–19 – 2–20). Therefore, for our target platform, when Constraint 1 dominates, the maximum linear scaling PSyncLimit = 20; when Constraint 2 dominates, the maximum linear scaling PshMemLimit = 10.
6.4 Architectural Limitations on Scalability
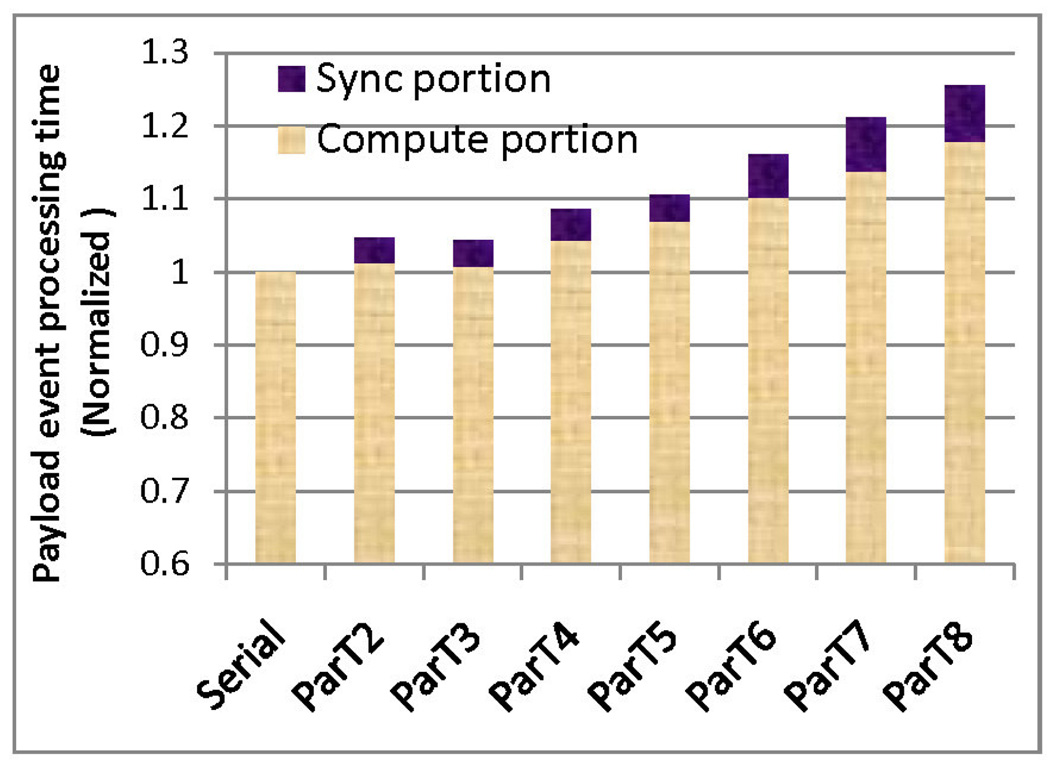
To account for the increased processing time per event we analyze in more detail the interaction between application and architecture. Figure 14 shows that the processing time per payload event increases by about 25% as the number of threads is increased to 8. Of this increase, 40% is due to synchronization overhead, including synchronization timing mismatch, while the other 60% is due to the increase in cache misses and bus utilitization.
Figure 14.
Event processing time as a function of number of threads; Code 3, size 128K.
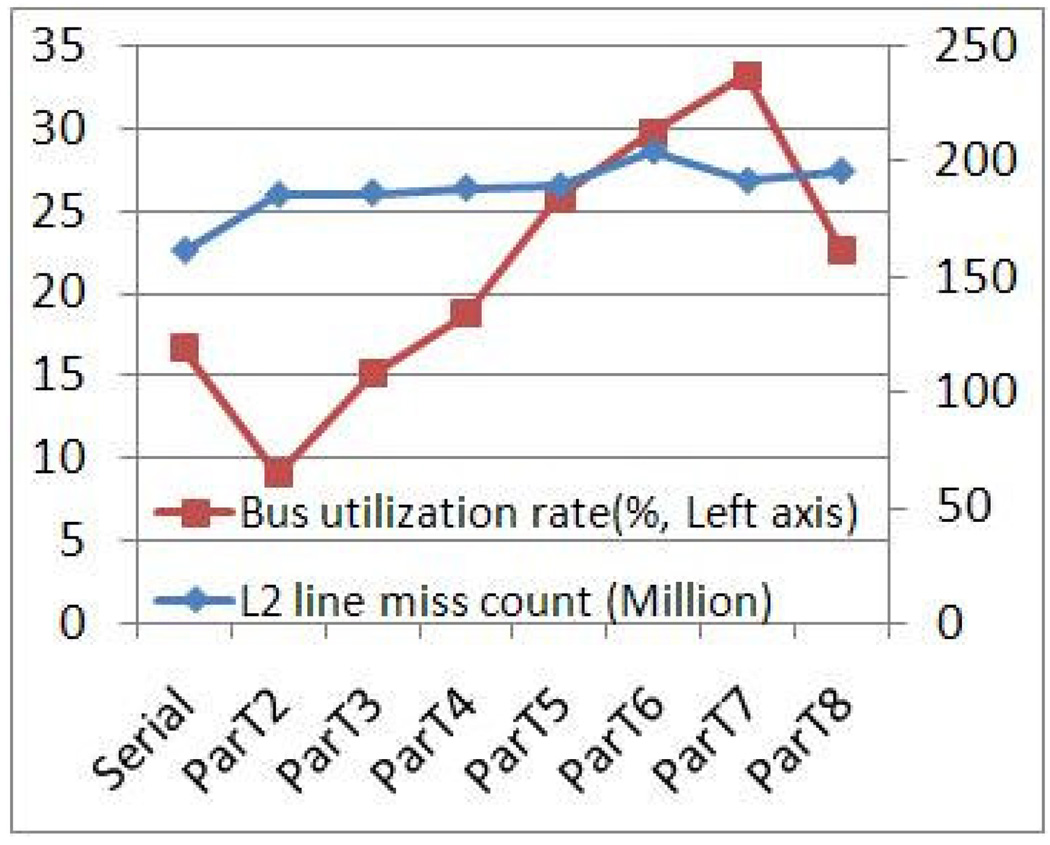
Figure 15 shows total cache misses and rate of bus utilization for the entire simulation period for the different numbers of threads. The data were collected with VTune (vtune_linux_9.1) [22] using separate runs of size 128K. We observe that the count of total cache misses increases slightly with the number of threads. This indicates that there is neither significant data reuse by a single thread nor data sharing among threads; these would cause substantial increases and decreases in cache misses, respectively. More likely is that the modest increase is related to synchronization: more threads means more misses on explicitly shared data.
Figure 15.
Rate of memory bus utilization and total number of L2 cache misses as a function of number of threads; Code 3, size 128K.
We observe also that bus utilization increases roughly linearly with the number of threads with exceptions between 1 and 2 and between 7 and 8. The first exception is because of the ‘shift between serial and parallel code with the latter having master and slave threads. The second exception is most likely due to system effects as no cores remain free. We note that the increase in bus utilization increases memory latency through queueing and other delays. We have tested the memory hierarchy and found that, for random accesses (non-DMA), the bus saturates at 60%.
These results match the those of Section 6.2: that threads are almost always working on events in different neighborhoods and thus different data sets. And since every prediction requires accessing data of a new particle, there is little reuse or sharing of cached data.
To confirm our analysis on architectural limitation we use the following procedure. First, we project PDMD performance based on the fact that the addition of each thread increases individual event processing time. Second, we validate the projection against the observed scaling result. Third, we present a hypothesis that the majority of the increase is due to architectural limitation. And finally, we validate the hypothesis by using a microbenchmark that has data access pattern similar to those of the application.
The addition of each thread increases individual event processing time. Therefore, speed-up is limited by that increase rate. For example, if using 7 processors causes 30% increase in processing time, then speed-up = (Original Processing Time)/(New Processing Time/7) = 100/(130/7) = 7/(1 + 0.3) = 5.38. For PDMD, the addition of each thread causes roughly a 5% increase in event processing time. Of this 2% is due to synchronization timing mismatch, confirmed from measurement in Figure 14, and the rest is due to increased time in memory access. The latter portion is a hypothesis based on the increase in cache misses and bus utilization.
Based on the above discussion, the equation of projected speed up for implementation 3 is, Speed-up = # of slave threads / (1 + increase rate x # of slave threads).
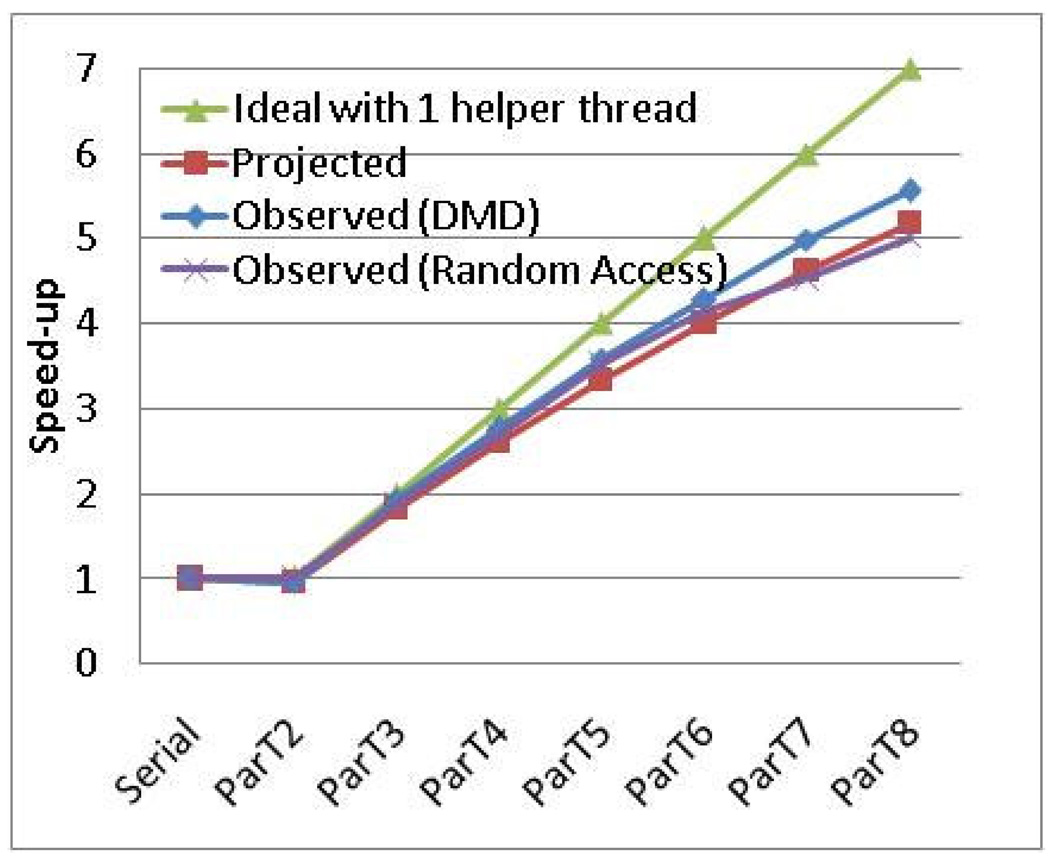
For example, for 8 processors (7 slave threads), the projected speed-up = 7/(1 + 0.05 * 7) = 7 / 1.35 = 5.18; the observed speed-up is 5.36. For 7 processors (6 slave threads), projected speed-up = 6/(1 + 0.05 * 6) = 6 / 1.30 = 4.61 and observed speed-up is 4.82. Thus the projection conforms well with the observed results, as shown in Figure 16.
Figure 16.
Overlap of scaling result for an analytical model with PDMD scaling result
To confirm our analysis on architectural limitation, we designed a microbenchmark that has a data access pattern similar to our DMD application: Data of similar size is accessed in nearly random fashion. Figure 16 shows how the scalability result of that program overlaps with our DMD application, confirming the fact that the increase in data access time is a major obstacle to good scaling of PDMD. Therefore with a 5% increase in event processing time per thread, the projected runtime, with more than two threads T = (serial runtime * (1 + 0.05 * (# of threads −1))) / (# of threads - 1).
We validate our hypothesis that a 3% increase in event processing time per additional thread is caused by architectural limitation, i.e., the increase in cache miss count and bus utilization. We created a program that has a single loop and accesses different portions of a large data set randomly in each iteration. We kept the data size the same as our DMD application. If our hypothesis was correct, the scaling pattern of this program would resemble the scaling pattern of DMD. In fact, as shown in Figure 16, the scaling result of the random access program almost perfectly overlaps with the DMD result. DMD scales slightly better, since its data access is not entirely random. We conclude that we have accounted for the architectural limitations that limit the scalability of PDMD with event-based decomposition.
7 Conclusion
In this paper, we examine the issues of parallelizing DMD, and present a PDMD simulator implemented with event based decomposition. Our method is microarchitecture inspired, where speculative processing of events enables multi-threading, and in-order commitment ensures correctness of simulation. We have achieved speedups of 5.9× on an 8-core and 9.1× on a 12-core processor. The relative speedups vary little across a wide range of simulation models: with respect to model complexity, with the exception of simple hard spheres as in Figure 1a; number of particles, beyond a few thousand; temperature; and density, beyond around 0.4.
We have also studied various other issues in DMD simulator construction, e.g., comparison of event queuing methods, selecting cell size, Paul’s data structure, and synchronization and scheduling issues. We also analyzed the performance of our method and concluded that the increase in cache misses and bus utilization rate, due to the increase in participating threads, seems to be the major obstacle towards achieving higher performance on shared-memory multi-processors. The need for frequent synchronization also remains a significant obstacle. An efficient hardware implementation of our method (pipelining instead of using multiple computational cores) seems highly promising as future work.
Acknowledgments
Josh Model, George Bishop, Francois Kosie, and Tony Dean contributed to previous versions of this work. We thank the anonymous reviewers for their many excellent suggestions.
Footnotes
Publisher's Disclaimer: This is a PDF file of an unedited manuscript that has been accepted for publication. As a service to our customers we are providing this early version of the manuscript. The manuscript will undergo copyediting, typesetting, and review of the resulting proof before it is published in its final citable form. Please note that during the production process errors may be discovered which could affect the content, and all legal disclaimers that apply to the journal pertain.
This work was supported in part by the NIH through award #R01-RR023168-01, by IBM through a Faculty Award, and facilitated by donations from Altera Corporation and Gidel. Web: http://www.bu.edu/caadlab.
A preliminary version of some of this work was presented at the IEEE 20th International Conference on Application-Specific Systems, Architectures, and Processors (ASAP 2009).
References
- 1.Buldyrev S. Application of discrete molecular dynamics to protein folding and aggregation. Lecture Notes in Physics. 2008;752:97–131. [Google Scholar]
- 2.Chellappa S, Franchetti F, Pueschel M. How to write fast numerical code: A small introduction. Generative and Transformational Techniques in Software Engineering II, Lecture Notes in Computer Science. 2008;v5235:196–259. [Google Scholar]
- 3.Culler D, Singh J, Gupta A. Parallel Computer Architecture: A Hardware/Software Approach. San Francisco, CA: Morgan-Kaufmann; 1999. [Google Scholar]
- 4.Dokholyan N. Studies of folding and misfolding using simplified models. Current Opinion in Structural Biology. 2006;16:79–85. doi: 10.1016/j.sbi.2006.01.001. [DOI] [PubMed] [Google Scholar]
- 5.Fujimoto R. Parallel discrete event simulation. Communications of the ACM. 1990;33(10):30–53. [Google Scholar]
- 6.Hennessy J, Patterson D. Computer Architecture: A Quantitative Approach. San Mateo, CA: Morgan Kaufman Publishers, Inc; 2007. [Google Scholar]
- 7.Herbordt M, Khan M, Dean T. Parallel discrete event simulation of molecular dynamics through event-based decomposition; Proc. International Conference on Application Specific Systems, Architectures, and Processors; 2009. pp. 129–136. [Google Scholar]
- 8.Herbordt M, Kosie F, Model J. An efficient O(1) priority queue for large FPGA-based discrete event simulations of molecular dynamics. Proc. IEEE Symp. on Field Programmable Custom Computing Machines. 2008:248–257. [Google Scholar]
- 9.Intel Corporation. Intel 64 and IA-32 Architectures Optimization Reference Manual. 2009 [Google Scholar]
- 10.Krantz A. Analysis of an efficient algorithm for the hard-sphere problem. ACM Transactions on Modeling and Computer Simulation. 1996;6(3):185–209. [Google Scholar]
- 11.Lubachevsky B. How to simulate billiards and similar systems. J. of Computational Physics. 1991;94:255–283. [Google Scholar]
- 12.Lubachevsky B. Simulating billiards: Serially and in parallel. International Journal in Computer Simulation. 1992;2:373–411. [Google Scholar]
- 13.Marin M. Billiards and related systems on the bulk-synchronous parallel model. Proc. Parallel and Distributed Simulation. 1997 [Google Scholar]
- 14.Marin M, Cordero P. An empirical assessment of priority queues in event-driven molecular dynamics simulation. Computer Physics Communications. 1995;92:214–224. [Google Scholar]
- 15.Marin M, Risso D, Corcero P. Effcient algorithms for many-body hard particle molecular dynamics. J. of Computational Physics. 1993;109:306–317. [Google Scholar]
- 16.Miller S, Luding S. Event-driven molecular dynamics in parallel. J. of Computational Physics. 2003;193(1):306–316. [Google Scholar]
- 17.Model J, Herbordt M. Discrete event simulation of molecular dynamics with configurable logic. Proc. IEEE Conference on Field Programmable Logic and Applications. 2007:151–158. [Google Scholar]
- 18.Paul G. A complexity O(1) priority queue for event driven molecular dynamics simulations. J. Computational Physics. 2007;221:615–625. [Google Scholar]
- 19.Proctor E, Ding F, Dokholyan N. Discrete molecular dynamics. Wiley Interdisciplinary Reviews: Computational Molecular Science. 2011;1(1):80–92. [Google Scholar]
- 20.Rapaport D. The event scheduling problem in molecular dynamics simulation. J. of Computational Physics. 1980;34:184–201. [Google Scholar]
- 21.Rapaport D. The Art of Molecular Dynamics Simulation. Cambridge University Press; 2004. [Google Scholar]
- 22.Reinders J. Vtune Performance Analyzer Essentials. Intel Press; 2005. [Google Scholar]
- 23.Sigurgeirsson H, Stuart A, Wan W-L. Algorithms for particle-field simulations with collisions. J. of Computational Physics. 2001;172:766–807. [Google Scholar]
- 24.Urbanc B, Borreguero J, Cruz L, Stanley H. Ab initio discrete molecular dynamics approach to protein folding and aggregation. Methods in Enzymology. 2006;412:314–338. doi: 10.1016/S0076-6879(06)12019-4. [DOI] [PubMed] [Google Scholar]
- 25.Urbanc B, Cruz L, Teoplow D, Stanley H. Computer simulations of alzheimer’s amyloid β-protein folding and assembly. Current Alzheimer’s Research. 2006;3:493–504. doi: 10.2174/156720506779025170. [DOI] [PubMed] [Google Scholar]
- 26.Yun S, Guy H. Stability tests onknown and misfolded structures with discrete and all atom molecular dynamics simulations. Journal of Molecular Graphics and Modelling. 2011;29(5):663–675. doi: 10.1016/j.jmgm.2010.12.002. [DOI] [PMC free article] [PubMed] [Google Scholar]


