Abstract
Objective
Type 1 Diabetes (T1DM) is a proinflammatory state and confers an increased risk for vascular complications. Toll-like receptors (TLR) could participate in diabetic vasculopathies. Whether TLR activation contributes to the proinflammatory state of T1DM and the pathogenesis of diabetic nephropathy (DN) remains unknown.
Methods and Results
We induced T1DM in TLR2 knockout mice (TLR2−/−) and wild-type littermates (C57BL/6J-WT) using streptozotocin (STZ). Fasting blood, peritoneal macrophages, kidneys were obtained for flow cytometry, Western blot, microscopy, cytokine assays at 6 and 14 weeks after induction of diabetes. Macrophage TLR2 expression and MyD88 dependent signaling were increased in diabetic mice (WT+STZ) compared to non-diabetic WT mice. These biomarkers were attenuated in diabetic TLR2−/− macrophages. WT+STZ mice showed increased kidney:body weight ratio due to cell hypertrophy, increased albuminuria, decreased kidney nephrin, podocin, and podocyte number and increased TGF-β and laminin compared to WT mice. Nephrin, podocin and podocyte number and effacement were restored and TGF-β, laminin levels were decreased in TLR2−/−+ STZ mice kidneys versus WT+STZ. Peritoneal and Kidney macrophages were predominantly M1 phenotype in WT+STZ mice; this was attenuated in TLR2−/−+STZ mice.
Conclusion
These data support a role for TLR2 in promoting inflammation and early changes of incipient diabetic nephropathy, in addition to albuminuria and podocyte loss.
Keywords: TLR2, nephropathy, inflammation, diabetes, complications
Introduction
Type 1 Diabetes (T1DM) is a pro-inflammatory state as evidenced by increased levels of C-reactive protein, inflammatory cytokines, and NF-kB activation (1–3), which is further accentuated in T1DM patients with microvascular complications (4–7). Diabetic nephropathy (DN) is the leading cause for end stage renal disease in USA affecting 30% of T1DM patients (7–9). The mechanism of kidney injury in diabetes is multifactorial and recent findings suggest an important role for activation of immunologic pathways (10). Studies support increased biomarkers of inflammation in diabetic kidneys (11–13).
The emerging concept that activation of innate immune system and inflammation via toll-like receptor (TLR) activation in the pathogenesis of T1DM and its complications is significant (14–18). Recent findings have shown increased TLR2/4 expression, signaling, ligands, and functional activation in T1DM subjects compared to controls (19, 20), which is further accentuated in monocytes of T1DM with microvascular complications (mainly nephropathy) (16). Over-activation of TLRs contributes to the pathogenesis of acute kidney injury, ischemic renal damage, and allograft rejection. (21). Recently, Brown et al (22) showed in a murine model of crescentic glomerulonephritis that administration of a synthetic TLR2 ligand (Pam3CSK4) significantly influenced disease severity through a TLR2-dependent mechanism. These data imply that selective targeting of TLR2 and the signaling pathways may have major clinical implications. However, at the present time, the role of TLR2 in diabetic vascular complications including DN is not known.
There are distinct changes in kidney structure and clearance function in early stages of diabetes preceding the appearance of pathologic levels of albumin in urine. Thus, renal hypertrophy, and onset of glomerular accumulation of extracellular matrix proteins in the form of thickening of glomerular basement membrane and mesangial matrix expansion due to increase in contents of laminin are seen generally within days of onset of diabetes in rodent models (23). Thickening of glomerular basement membrane, is associated with TGF-β and laminin expression, can occur early in DN and may even precede albuminuria. Nephrin, a transmembrane receptor protein essential for maintaining the structure and function of the glomerular slit diaphragm, is significantly decreased in DN (24,25). Nephrin in podocytes interacts with other proteins such as podocin and regulates a number of cell signaling pathways including stimulation of mitogen activated protein kinases (26). TGF-β expression in DN is known to increase extracellular matrix protein synthesis (laminin, fibronectin, etc) and decrease matrix degradation (27,28).
However, the interaction of the innate immunity pathway involving TLRs and the well established biochemical changes such as increase in matrix laminin and TGF-β expression and decrease in podocyte number and slit diaphragm proteins and albuminuria in early stage of DN has not been studied. Thus, the aim of this study was to examine if genetic deficiency of TLR2 attenuates the increased inflammation associated with T1DM and ameliorates early abnormalities in DN.
Methods
Please see details in online supplement, available at http://atvb.ahajournals.org
Animals
TLR2−/− (male; 8–10 week age) mice generated on a C57BL/6J genetic back ground (wild type) were purchased from the Jackson Laboratory (Bar Harbor, ME). Diabetes was induced by injecting multiple low doses of streptozotocin (STZ; Sigma; 50mg/kg body weight i.p. daily for four days), a widely accepted method for inducing T1DM in mice (29) and insulin pellets (2U/day) were implanted in the mice to maintain compensated hyperglycemia.
Flow cytometry
Surface TLR2 and TLR4 expression and markers of M1 phenotype (Ly6C, IL-6, CCR2) and M2 phenotype (CD206, CD163) in peritoneal and kidney macrophages was performed by flow cytometry as described previously (30,31).
Levels of serum amyloid P component (SAP) were analyzed by ELISA. Macrophage, serum, and kidney tissue levels of interleukin-1 beta (IL-1β), interleukin-6 (IL-6), interleukin-8 (KC/IL-8), IP-10, Monocyte chemoattractant protein-1 (MCP-1), and tumor necrosis factor-alpha (TNF-a) were measured using a multiplex cytokine assay Intra and inter-assay CV were determined to be <14%.
Nuclear/Cytoplasmic Extracts and NF-kB Transcription Factor Assays
Nuclear and cytoplasmic extracts were prepared from isolated macrophages and kidneys as described previously (32).
Western Blotting
Western blot analysis was used to examine the downstream signaling events.
siRNA Transfection assays
THP-1 cells (ATCC) were incubated in normoglycemic (LG: 5.5mM) and hyperglycemic conditions (HG: 15mM glucose) for 48 hours with specific TLR2 or scrambled siRNA (Ambion, TX) as described previously (32).
Transmission Electron Microscopy (TEM) of diabetic kidneys and immunohistochemistry
Structural changes in diabetic kidneys were detected using TEM and following the CAP protocols of UC Davis Medical School as described previously (33,34).
Statistical analysis
Statistical analyses were performed using SAS. Data are expressed as mean ± S.D for parametric data and as median and interquartile range for non-parametric data. Following ANOVA, parametric data were analyzed using paired, two tailed t-tests and non-parametric data using Wilcoxon signed rank tests. Level of significance was set at P<0.05. Pearson’s and Spearman correlations were computed for variables of interest such as nephrin, podocin, laminin, WT-1 score, podocyte width and microalbuminuria.
Results
Baseline characteristics of the mice are provided in Table 1. There were no significant differences in body weight and lipid levels between the 4 groups of mice. Following STZ injection, as expected, there was significant elevation in glucose levels when compared to wild type or TLR2−/−mice (Table 1).
Table 1.
Baseline Characteristics
| WT (n=5) | TLR2−/− (n=5) | WT+STZ(n=20) | TLR2−/−+STZ(n=22) | |
|---|---|---|---|---|
| Weight (gms) | 29 ± 2 | 30± 3 | 29 ± 5 | 25 ± 4 |
| Glucose (mg/dL) | 120± 12 | 138± 11 | 566± 106* | 489± 101* |
| Total Cholesterol(mg/dL) | 40± 4 | 44±9 | 55± 13 | 48±10 |
| Triglyceride (mg/dL) | 138±13 | 165±28 | 162± 41 | 148± 33 |
| Kidney/body wt ratio (%of control) | 99±2 | 91±4‡ | 132±17* | 99±9*† |
| Microalbumin:creatinine Ratio ( μg/mg) | 7±5(median: 6) | 9±7(median: 7) | 89±29*(median: 86) | 28±17§ (median: 26) |
Data is presented as mean ± SD.
P<0.001 vs WT and TLR2−/−;
P<0.04 vs WT+STZ;
P<0.04 vs WT;
p=0.015 vs WT+STZ; Blood glucose was obtained by measurements from the tail vein.
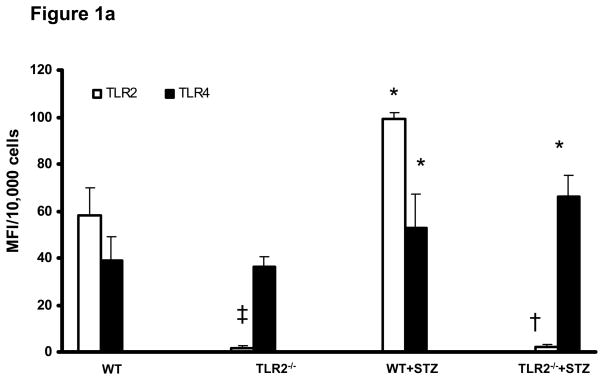
TLR2 and TLR4 expression was examined in all the groups. Compared to non-diabetic WT mice, WT diabetic mice (WT+STZ) had increased expression of both TLR2 and TLR4 in macrophages, while TLR2−/−diabetic mice (TLR2−/−+ STZ) had increased expression only of TLR4 (Figure 1a). The extremely low MFI for TLR2 in TLR2−/− mice was consistent with the isotype controls (background). TLR2 levels were significantly increased in kidney macrophages of WT+STZ mice compared to WT mice(WT: 46 ± 11 mfi/105 cells; WT+STZ:75 ± 21 mfi/105 cells; p<0.05).
Figure 1.
Figure 1a: Surface expression of TLR2 and TLR4: Peritoneal macrophages were obtained from WT (n=5), TLR2−/− (n=5), WT+STZ (n=20) and TLR2−/−+STZ (n=22) mice at 6 weeks and surface expression of TLR2 and TLR4 were assessed by flow cytometry as described in Methods. Values are expressed as MFI/10,000 cells (mean ± SD). *P<0.001 vs WT and TLR2−/−; †P<0.001 vs WT or WT+STZ; ‡P<0.05 vs WT.
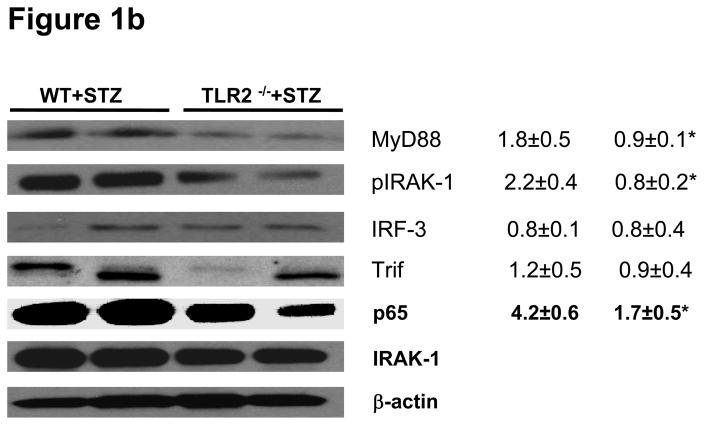
Figure 1b: TLR2-MyD88 dependent signaling: MyD88, IRAK-1 phosphorylation, IRF3, Trif, and nuclear p65 protein levels were measured in peritoneal macrophage lysates from WT+STZ (n=20) and TLR2−/−+STZ mice (n=22) at 6 weeks using Western lot assay. Representative blots with densitometric ratios were depicted in the figure. Values are expressed as protein/β-actin ratio (mean± SD). *P<0.001 vs WT+STZ mice. Total IRAK-1 and β-actin were used as internal controls.
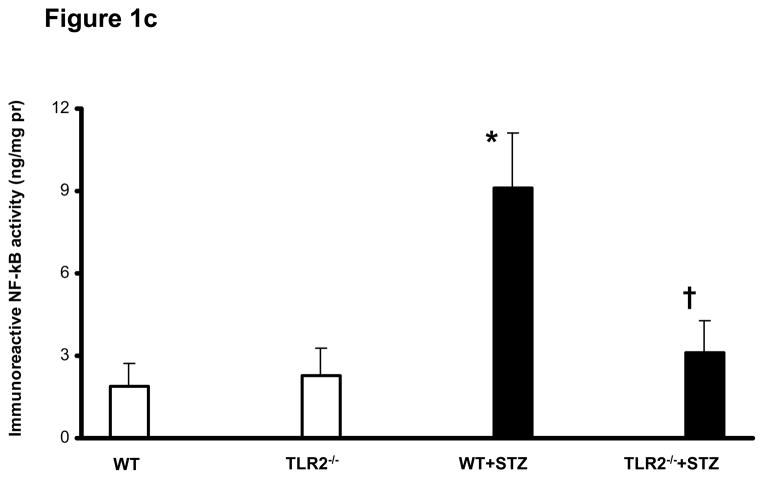
Figure 1c: Nuclear NF-kB activation in peritoneal macrophages of WT (n=5), TLR2−/− (n=5), WT+STZ (n=20) and TLR2−/−+STZ (n=22) mice at six weeks was determined by Trans-AM activity assay and normalized to nuclear protein as described in Methods. Values are expressed as ng/mg protein (mean ± SD). *P<0.005 vs WT and TLR2−/−; †P<0.001 vs WT+STZ mice.
TLR2 activates NFKb via MyD88 resulting in transcription of pro-inflammatory genes (18). Infiltrating macrophage derived products in the diabetic kidney induce inflammation and are involved in the subsequent development and progression of DN (11, 12, 35). However, it is not clear if macrophage TLR2 mediated inflammation play a role in this process. Therefore, levels of MyD88, IRAK-1 protein phosphorylation, Trif, IRF3, and NF-kB activity were examined in peritoneal macrophages of the mice. TLR2−/−+STZ mice showed significant reduction in MyD88 expression and phosphorylation of IRAK-1, while there was no significant abrogation of non-MyD88 dependent signaling proteins such as Trif and IRF3 (Figure 1b) compared to the WT+STZ mice. As shown in Figure 1c, concomitant with the activation of MyD88 dependent signaling cascade, WT+STZ mice macrophages had significantly increased nuclear NF-kB activity compared to WT and TLR2−/− mice. Furthermore, compared to WT+STZ mice, there was a significant decrease in STZ-induced NF-kB activity in the TLR2−/−+STZ mice (55% reduction, P<0.001). In addition, there was significant increase in MyD88 (50%.), phosphorylation of IRAK-1 (63%.) activity in WT+STZ mice compared to WT mice (Figure 1b).
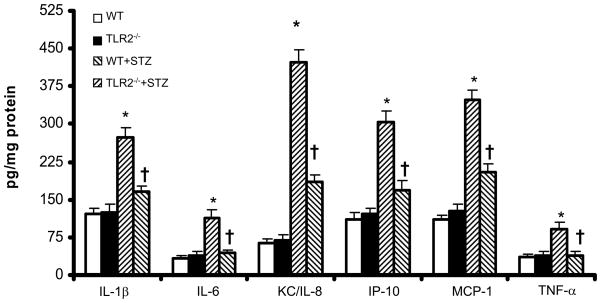
NF-kB activation leads to increased inflammatory gene expression. To study the functional significance of reduced NF-kB activation in diabetic TLR2−/−mice, we measured levels of pro-inflammatory chemokines and cytokines known to be activated by TLR induction. Figure 2 depicts serum levels of cytokines/chemokines. WT+STZ mice exhibited significantly increased levels of IL-1β, IL-6, KC/IL-8, IP-10, MCP-1, and TNF-a compared to non-diabetic WT mice (P<0.001) and all were significantly attenuated in TLR2−/−+STZ mice (P<0.001). TNF levels, though decreased in TKLR−/−+STZ compared to WT+STZ mice, did not reach statistical significance (p=0.071). We also examined IL-10 levels, which were not significantly altered in TLR2−/−+STZ compared to WT+STZ mice. In addition, serum SAP levels were significantly increased in WT+STZ mice compared to non-diabetic WT mice and this was significantly attenuated in the diabetic TLR2−/−mice (median SAP in WT+STZ: 77 μg/ml and in TLR2−/−+ STZ mice: 28 μg/ml; P<0.001). Similar results were obtained for cytokine/chemokine release from peritoneal macrophages (Supplemental Figure 1). TLR2−/−+STZ mice macrophages released significantly lesser amounts of IL-1β (48% reduction, P<0.01), IL-6 (44% reduction), KC/IL-8 (64% reduction, P<0.001), IP-10 (66% reduction, P<0.001) and MCP-1 (66% reduction, P<0.001) compared to WT+STZ mice. The decrease in TNF levels were not significant.
Figure 2.

Circulating levels of pro-inflammatory cytokines and chemokines in sera of WT (n=5), TLR2−/− (n=5), WT+STZ (n=20) and TLR2−/−+STZ (n=22) mice at 6 weeks were examined by multiplex assays as described in Methods. Values are expressed as pg/ml (mean ± SD). *P<0.001 vs WT and TLR2−/−; †P<0.001 vs to WT or WT+STZ.
Since all the TLRs except TLR3 activate the MyD88 pathway (18), we used TLR2 siRNA inhibition strategy in human THP-1 cells to confirm the dominant role of TLR2 knockout in decreasing MyD88 in the diabetic milieu. As reported previously (32), compared to normoglycemic conditions (5.5mM glucose) there were significant increase in MyD88 and its downstream signaling with HG (Supplemental Figure 2). This was attenuated by siRNA to TLR2. Having shown that TLR2KO ameliorates the pro-inflammatory state of diabetes, we next focused on a microvascular complication, diabetic nephropathy.
One of the cardinal manifestations of renal involvement in early stages of DN is renal hypertrophy defined as increase in kidney to body weight ratios. As expected, the kidney to body wt ratios were significantly higher in WT+STZ mice compared to WT and lower in TLR2−/−+STZ mice compared to WT+STZ mice at both 6 weeks (Table 1) and 14 weeks (WT+STZ: 112.45 ± 12 and TLR2−/−+ STZ: 98 ± 7; P<0.05). In addition, we examined protein:DNA ratios to confirm cell hypertrophy, which were significantly higher in WT+STZ mice compared to WT and lower in TLR2−/−+STZ mice compared to WT+STZ mice (WT+STZ: 102 ± 39 and TLR2−/−+ STZ: 53 ± 23; P<0.05). The 24 hour urinary microalbumin: creatinine ratios were significantly increased in WT-STZ mice compared to WT mice (Median 86 ug/mg creatinine vs 6 ug/mg creatinine, p<0.001); furthermore, the ratios were significantly decreased in the TLR2−/−+ STZ mice (median: 26μg/mg) compared to WT+STZ mice (median: 86 μg/mg; P = 0.015). Thus, we establish early diabetic nephropathy by the accepted criteria of the AMDCC of a 10-fold increase in albuminuria in WT-STZ mice which is attenuated in TLR2−/−+STZ mice (36).
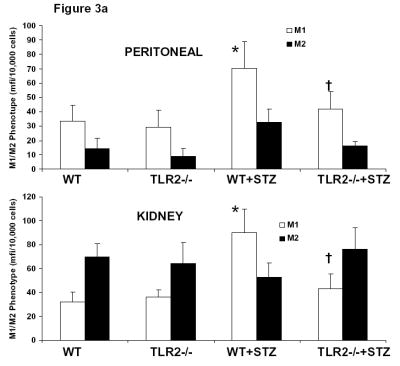
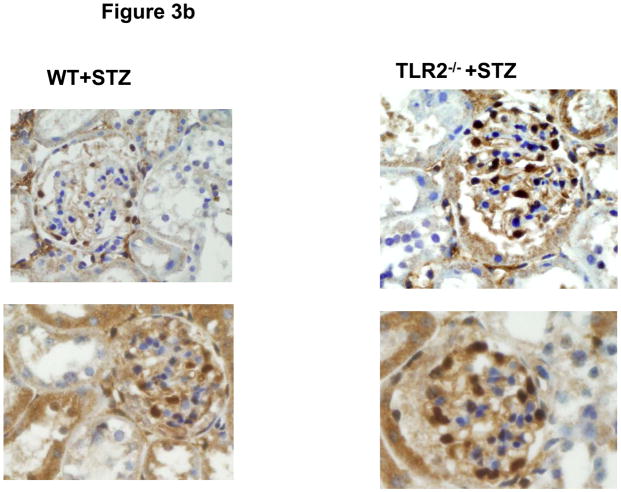
Since we recorded significantly higher levels of pro-inflammatory cytokines/chemokines, and no absolute increase in number of kidney macrophages, we examined the phenotype of macrophages in peritoneum and kidney. As shown in Figure 3a, there was a significant increase in M1 phenotype of both kidney and peritoneal macrophages in WT+STZ mice and this was attenuated in the TLR2−/−+STZ mice. Since there was decreased albuminuria in TLR2−/−+STZ compared to WT+STZ, we proceeded to examine podocyte morphology. Electron micrographs of the WT+STZ and TLR2−/−+STZ kidneys were examined using standard electron microscopy techniques. The diabetic group (WT+STZ mice) showed foot process effacement and widening of the podocyte villi at 14 weeks after diabetes. This finding was more pronounced at the tips of the capillary loops. These changes were also observed in the TLR2−/−+STZ mice kidneys, but to a lesser degree (Supplemental Figure 3). Number of cells positive for WT-1 in 5 hpf was counted and a WT-1 score was computed. There was significant reduction in WT-1 score in the WT+STZ mice, confirming podocyte loss, when compared to the WT and TLR2−/− non-diabetic mice and this was restored in the TLR2−/−+STZ mice (WT-1 score in non-DM mice: 14 ± 4 cells; in WT-STZ mice: 7 ± 4 cells and in TLR2−/−+STZ mice: 13 ± 5* cells per 5 hpf; p<0.05 compared to WT-STZ mice) and representative glomeruli are shown in Figure 3b. There was no change in glomerular volume between the groups. Thus, our EM and WT-1 staining fulfill a second criterion of the AMDCC, i.e. podocyte loss. When we examined immunochemical staining for mesangial proliferation or macrophage recruitment (using Mac-2 antibody), it was not significantly different between the WT+STZ and TLR2−/−+STZ mice.
Figure 3.
Figure 3a: Phenotype of Peritoneal (Upper Panel) and Kidney (Lower Panel) Macrophages were assessed by flow cytometry as described in Methods. M1 Phenotype was characterized by positivity for Ly6C, CCR2 and IL-6 while M2 phenotype was characterized by CD206 and CD 163.. *P<0.001 vs WT and TLR2−/−; †P<0.001 vs. WT or WT+STZ.
Figure 3b: Podocytes in glomeruli of diabetic wild type (WT) and TLR2−/− mice kidneys at 14 weeks were examined by WT-1 immunochemical staining as described in methods (n=11/group). 2 Representative photographs of WT-1 staining (brown spots in glomeruli) are shown for the 2 groups.
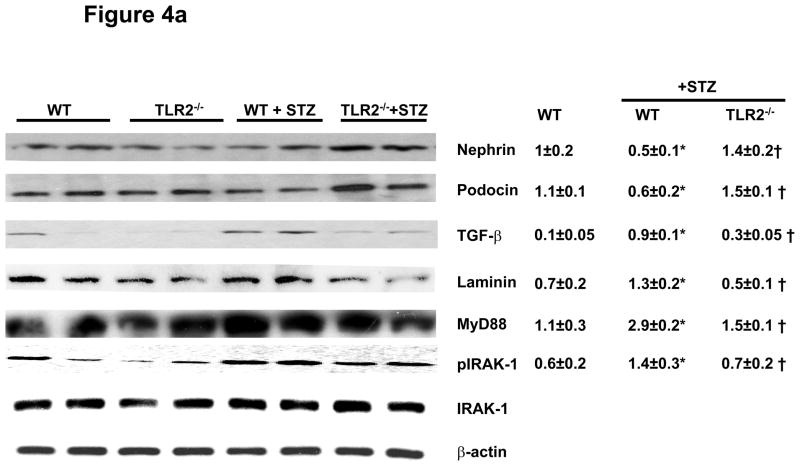
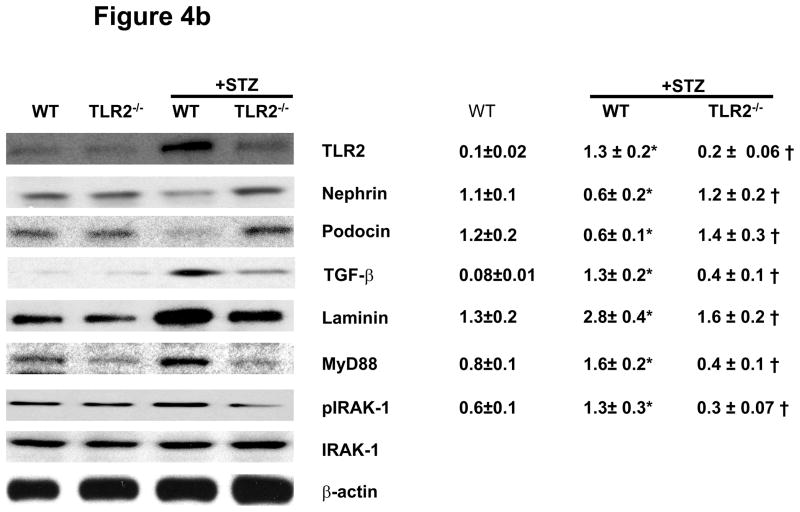
To characterize molecular and signaling changes in kidneys as evidence for early kidney damage under diabetic conditions, nephrin, podocin, laminin, and TGF-β expression were measured in all the four groups of mice using immunoblot assays after 6 and 14 weeks of persistent diabetes. WT+STZ kidneys showed significantly reduced levels of nephrin (−50%) and podocin (−50%) while laminin (↑85%.) and TGF-β (↑80%) expression were higher compared to WT mice at 6 and 14 weeks (Figures 4a and 4b). Levels of nephrin and podocin were restored in TLR2−/−+STZ mice to that of non-diabetic WT mice. TGF-β and laminin protein levels were decreased in TLR2−/−+STZ compared to WT+STZ kidneys similar to non-diabetic WT mice. It is important to note that there was a significant correlation between microalbuminuria and podocin (r= −0.56, p=0.03), podocyte width (r=0.6, p=0.03) and a trend to significance in the relationship between microalbuminuria and WT-1 score (r= −0.5, p=0.08).
Figure 4.
Figure 4a: Slit diaphragm proteins Nephrin, Podocin and Extracellular matrix (ECM) proteins TGF-β, Laminin, MyD88, and IRAK-1 phosphorylation in kidney lysates of WT (n=5), TLR2−/− (n=5), WT+STZ (n=14) and TLR2−/−+STZ (n=16) at 6 weeks after diabetes were determined using Western blot. Representative blots with densitometric ratios were shown in the figure. Total IRAK-1 and β-actin were used as internal controls. Values are expressed as protein/β-actin ratio (mean ± SD). *P<0.005 vs WT; †P<0.02 vs WT+STZ.
Figure 4b: TLR2, Nephrin, Podocin, TGF-β, Laminin, MyD88, and IRAK-1 phosphorylation in kidney lysates of WT, TLR2−/−, WT+STZ, and TLR2−/−+STZ (n=11/gr) at 14 weeks after diabetes were measured in kidney tissue lysates using Western blot assay. Representative blots with densitometric ratios were depicted in the figure. Total IRAK-1 and β-actin were used as internal controls. Values are expressed as protein/β-actin ratio (mean ± SD). *P<0.001 vs WT mice. †P<0.05 vs WT+STZ.
In addition, TLR2, MyD88 and IRAK-1 phosphorylation were increased in WT+STZ kidneys and attenuated in TLR2−/−+STZ mice (Figures 4a and 4b). There were no significant differences in the Nephrin, podocin, laminin, and MyD88 protein expression in kidneys of non-diabetic WT and TLR2−/− mice (Figures 4a and 4b). Associated with MyD88 dependent signaling, WT+STZ kidney had significantly increased nuclear NF-kB activity (7±2ng/mg protein) compared to non-diabetic WT (1.2±0.2ng/mg protein) and TLR2−/− mice (1±0.2ng/mg protein) (P<0.002). Furthermore, compared to WT+STZ mice, there was a significant decrease in STZ-induced NF-kB activity in the kidneys of TLR2−/−+STZ mice (2±0.5 ng/mg protein; 71% reduction, P<0.001). Furthermore, we measured inflammation in the kidneys using multiplex assays. IL-1β, IL-6, KC/IL-8, MCP-1, IP-10, and TNF-a concentrations were significantly increased in WT+STZ mice compared to non-diabetic WT and TLR2−/− mice. There was a significant reduction in the concentration of these inflammatory mediators in TLR2−/−+STZ mice compared to WT+STZ mice (Figure 5) at 14 weeks.
Figure 5.
Cytokine and chemokine concentrations in the kidney lysates of WT, TLR2−/−, WT+STZ and TLR2−/−+STZ mice (n=11/gr) was measured by Multiplex assay as described in Methods at 14 weeks. Values are expressed as pg/mg cell protein (mean ± SD). *P<0.001 vs WT and TLR2−/−; †P<0.01 vs WT+STZ.
Discussion
We recently showed increased TLR2 and TLR4 expression and activity in monocytes of Type 1 diabetes patients compared to matched controls (19), and that these are further accentuated in T1DM patients with microvascular (MV) complications with 66% of the T1DM-MV patients having DN (6,16). Therefore, in this study, we focused on the contribution of TLR2 to the pro-inflammatory state of diabetes and a critical MV complication viz., DN since there is a paucity of data with regards to the role of inflammation in DN. We provide novel evidence supporting these two key pathogenic processes using STZ induced T1DM in WT and TLR2−/− mice. First, showing attenuation of the increased inflammation via circulating cytokines/chemokines levels in the TLR2−/−+STZ mice compared to WT+STZ mice, despite other TLRs including TLR4 expression being intact; then using the sentinel inflammatory cell, macrophage, we demonstrate inhibition of MyD88 dependent signaling, NF-kB activity, and proinflammatory mediators in diabetic TLR2−/− mice. Second, we identified early renal changes consistent with DN through increased kidney size, increased albuminuria, decreased nephrin, podocin expression and increased TGF-β, laminin expression in WT+STZ mice, at 6 and 14 weeks of diabetes. The increased albuminuria at 14 weeks or greater than 10-fold in WT+STZ mice compared to WT mice is a validating criterion for diabetic nephropathy recommended by AMDCC (36). Also the increased podocyte foot process widening and effacement and decreased WT-1 positive cells (podocyte loss) is another accepted criterion of the AMDCC (36). Finally, we show increased MyD88 signaling in the WT+STZ kidneys coupled with increased IL-6 & MCP-1 that were significantly attenuated in the TLR2−/−+STZ mice. These molecular changes were restored in TLR2−/−+STZ mice, pointing to a critical role for TLR2 in inducing a proinflammatory phenotype in T1DM and attendant nephropathy. We showed increased renal biomarkers of inflammation (IL-1, IL-6, MCP-1) implicated in diabetic nephropathy (37,38) that were attenuated in TLR2−/−+STZ mice. Using Mac2 antibody in IHC, we failed to see increased macrophage recruitment in the kidney. We are unclear if TLR2KO will necessarily reduce macrophage recruitment in the kidney since it has not been shown previously to persist by 2 groups in the renal ischemia reperfusion model (39,40) and may be a function of the time course of DN with both TLR2 and TLR4. We clearly show decreased biomarkers of inflammation implicated in the genesis of DN. In addition, we examined the phenotype of kidney and peritoneal macrophages and showed that there was polarization to the M1 phenotype. This exciting data indicates that macrophages infiltrating the kidney in DN are predominantly of the M1 pro-inflammatory phenotype and contribute to the increased inflammation seen in DN. Also, PAS/silver methaneamine staining did not reveal mesangial proliferation, in spite of the increase in TGF-beta and laminin.
Rodent models of DN are excellent tools to gain insight into the pathogenesis of the disease and to test new therapies (36, 41,42). Renal and glomerular hypertrophy are key features of early T1DM and may occur within days of experimental diabetes (43). In non obese diabetic (NOD) mice, renal hypertrophy occurs 10 days after diabetes onset and reaches a plateau by 20 days (44). However, glomerular sizes did not differ in NOD mice from controls in the early stages of diabetes except for partial thickening of basement membrane as revealed by electron microscopy (43,44). In agreement with the above studies, we did not see major changes in microalbuminuria at 6 weeks after the onset of T1DM, but significantly increased albuminuria at 14 weeks after diabetes (P=0.015). These accord with the published literature that around 16 weeks, these C57BL6 mice get significant albuminuria and also develop glomerulosclerosis (45,46). At the same time, the kidney/body wt ratios and protein:DNA ratios were significantly higher in WT+STZ mice compared to WT and lower in TLR2−/−+STZ mice compared to WT+STZ mice (Table-1) indicating early DN. There were significant changes in TGF-β consistent with earlier studies using diabetic mice (47). Thus, enhancing ECM accumulation and/or inhibiting ECM degradation by TGF-β makes it a pivotal biomediator in mesangial expansion (48). Moreover, TGF-β has consistently been shown to be increased in renal parenchymal and infiltrating macrophages in the diabetic kidney of humans and experimental models (49). Our data is consistent with above studies and deficiency of TLR2 attenuates TGF-β expression in diabetic kidneys. Also, since TGF-β promotes mesangial expansion, we quantitated laminin as a readout. Both TGF-β and laminin were increased in WT+STZ mice compared to non-diabetic and TLR2−/−+STZ mice. Had we kept our mice for a longer duration, we anticipate increased PAS positivity would have been evident.
Foot process effacement is a result of retraction, widening, and shortening of the processes of podocytes. Shankland et al (10) postulated that podocyte effacement could be caused by (a) changes in slit diaphragm-associated proteins, (b) interference with the GBM or podocyte-GBM interaction, (c) actin cytoskeleton abnormalities, or (d) alterations in the negative apical membrane domain of podocytes. Because proteinuria is a cardinal clinical characteristic of diabetic nephropathy, many studies have focused on the changes in slit diaphragm-associated molecules in diabetic nephropathy. Bonnet et al. demonstrated a reduction in nephrin mRNA and protein expression in STZ-induced diabetic spontaneously hypertensive rats (50). In the present study, in conjunction with improvement in proteinuria, diabetic TLR2−/− mice showed significant normalization of podocyte villi width and foot process effacement compared to WT+STZ mice, concomitantly, there was normalization of the slit membrane proteins, nephrin and podocin and normalization of podocytes compared to WT+STZ mice. The significant inverse correlation in our study between the accepted clinical biomarker, microalbuminuria, and podocin protein levels and podocyte number in this diabetic model suggests that, if confirmed in future studies, they could emerge as novel biomarkers of DN.
Slit diaphragm proteins have become increasingly important in signal transduction and in mediating downstream events in kidney diseases. Recently, nephrin and podocin, two slit membrane proteins, have drawn significant attention in the pathogenesis of DN (51). Menne et al (52) showed that PKC-alpha activation may be an important regulator of nephrin expression and glomerular albumin permeability under diabetic conditions. Dasu et al (32) demonstrated that the hyperglycemia induced TLR2 expression and activation are mediated by PKC-a in human monocytes. However, question of whether TLR2 signaling is involved in mediating the effects of diabetes on the slit-membrane proteins is not known. Both nephrin and podocin serve a survival function for podocytes (10) and nephrin is a key regulator of podocyte signaling (53). The decrease in nephrin and podocin in WT+STZ kidneys could presage podocyte loss and were partially restored in TLR2−/−+STZ mice, indicating the involvement of TLR2 in regulating slit membrane protein expression pivotal in podocyte activity. However, in addition, we show podocyte loss in WT-STZ mice. Also since it has been previously shown that AGE-LDL activates TLR4 (47), this interaction with respect to TLR2 will be studied in the future.
The role of TLR2 has been examined in other disease states. Leemans et al (39) found that TLR2 deficiency resulted in reduced renal dysfunction and tubular damage following ischemia/reperfusion and this was associated with decreased macrophage numbers in the kidney, but only at day 3 and these differences were lost by day 10. Recent reports have established a protective role of TLR2 deficiency in mice during I/R injury to maintain coronary endothelial function or left ventricular function (55,56). In the present paper, our focus was on the pro-inflammatory state of T1DM and relevance to early DN. Thus, we examined inflammation and key DN biomarkers in macrophages and kidneys using TLR2−/− diabetic mice. Furthermore, while various TLRs have been implicated in the pathogenesis of T1DM (32, 55,56) the focus of this report is on the role of TLR2 in the pro-inflammatory state of T1DM and early molecular changes in DN.
TLRs activate two types of downstream signaling pathways: MyD88-dependent and MyD88-independent pathways (18). TLR2 primarily signals through the MyD88 dependent pathway to induce inflammation. Here, we provide novel evidence, using the STZ-induced diabetes model, that TLR2 knockout results in significant decrease in diabetes-induced inflammation independent of TLR4, since TLR4 levels and its non-MyD88 dependent signaling proteins (Trif, IRF-3) were unaltered. The decreased inflammation i.e. release of proinflammatory cytokines and chemokines was associated with significant reduction in NF-kB activity, MyD88, and phosphorylation of IRAK-1. Similar findings were found when TLR2 was knocked down using siRNA in cells under hyperglycemic conditions (32). It is worth mentioning that TLR2 deficiency in the diabetic milieu has a profound effect on MyD88 dependent signaling, even with increased TLR4 expression and warrants further investigation. We have confirmed our in vivo finding using siRNA to TLR2 under hyperglycemic conditions and confirm the decrease in MyD88. Thus, abrogating inflammation in diabetes using TLR2 as a target appears to be a reasonable therapeutic strategy to alleviate inflammation and the associated DN.
In summary, we document two novel findings: that genetic deficiency of TLR2 significantly abrogates the pro-inflammatory state of T1DM up to 14 weeks, despite the other TLRs including TLR4 being intact and attenuates incipient DN at the cellular level as evidenced by normalization of microalbuminuria and retention of podocyte number. In support of our data, Li et al recently documented increased TLR2 expression in both rat and human kidneys with DN (58). Also, in a previous report we showed that after a short duration of 2 weeks there was decreased biomarkers of inflammation in TLR2KO STZmice and improvement in wound healing parameters (59 ). We are now extending our findings and show the durability of the amelioration of inflammation at 14 weeks in TLR2KO-STZ mice, with a benefit on a critical microvascular complication associated with increased morbidity and mortality, diabetic nephropathy. Collectively, the published data and the present report support a pivotal role of TLR2 signaling to the proinflammatory state of T1DM and incipient nephropathy. Evidence from prospective trials has emphasized the role of inflammation in contributing to increased complications and cardiovascular events in diabetes. Therapeutic strategies targeted at decreasing TLR2 to abrogate inflammation in diabetes may eventually result in decreased complications, including nephropathy. In this context, we and others have shown that statins, PPAR-gamma agonists (32) and angiotensin receptor blockers (60) decrease both TLR2 and TLR4 expression and signaling.
Supplementary Material
Acknowledgments
JDRF-2007-585, NIH K24 AT 00596 (IJ); NIH-DK-077295, Veterans Affairs Research Service (BSK). We thank Mohan R. Dasu for help with animal handling and all the western blots and Alexander Chien for measuring podocyte villi width in a blinded fashion.
References
- 1.Libby P, Nathan DM, Abraham K, Brunzell JD, Fradkin JE, Haffner SM, Hsueh W, Rewers M, Roberts BT, Savage PJ, Skarlatos S, Wassef M, Rabadan-Diehl C. National Heart, Lung, and Blood Institute; National Institute of Diabetes and Digestive and Kidney Diseases Working Group on Cardiovascular Complications of Type 1 Diabetes Mellitus. Report of the National Heart, Lung, and Blood Institute-National Institute of Diabetes and Digestive and Kidney Diseases Working Group on Cardiovascular Complications of Type 1 Diabetes Mellitus. Circulation. 2005;111:3489–3493. doi: 10.1161/CIRCULATIONAHA.104.529651. [DOI] [PubMed] [Google Scholar]
- 2.Devaraj S, Glaser N, Griffen S, Wang-Polagruto J, Miguelino E, Jialal I. Increased monocytic activity and biomarkers of inflammation in patients with type 1 diabetes. Diabetes. 2006;55:774–779. doi: 10.2337/diabetes.55.03.06.db05-1417. [DOI] [PubMed] [Google Scholar]
- 3.Devaraj S, Dasu MR, Jialal I. Diabetes is a proinflammatory state: a translational perspective. Expert Rev Endocrinol Metab. 2010;5(1):19–28. doi: 10.1586/eem.09.44. [DOI] [PMC free article] [PubMed] [Google Scholar]
- 4.Schram MT, Chaturvedi N, Schalkwijk CG, Fuller JH, Stehouwer CD EURODIAB Prospective Complications Study Group. Markers of inflammation are cross-sectionally associated with microvascular complications and cardiovascular disease in type 1 diabetes--the EURODIAB Prospective Complications Study. Diabetologia. 2005;48:370–378. doi: 10.1007/s00125-004-1628-8. [DOI] [PubMed] [Google Scholar]
- 5.Schalkwijk CG, Poland DC, van Dijk W, Kok A, Emeis JJ, Dräger AM, Doni A, van Hinsbergh VW, Stehouwer CD. Plasma concentration of C-reactive protein is increased in type I diabetic patients without clinical macroangiopathy and correlates with markers of endothelial dysfunction: evidence for chronic inflammation. Diabetologia. 1999;42:351–357. doi: 10.1007/s001250051162. [DOI] [PubMed] [Google Scholar]
- 6.Devaraj S, Cheung AT, Jialal I, Griffen SC, Nguyen D, Glaser N, Aoki T. Evidence of increased inflammation and microcirculatory abnormalities in patients with type 1 diabetes and their role in microvascular complications. Diabetes. 2007;56:2790–2796. doi: 10.2337/db07-0784. [DOI] [PMC free article] [PubMed] [Google Scholar]
- 7.Andersen A, Christiansen J, Andersen J, Kreiner S, Deckert T. Diabetic nephropathy in type I (insulin-dependent) diabetes: an epidemiological study. Diabetologia. 1983;25:496–501. doi: 10.1007/BF00284458. [DOI] [PubMed] [Google Scholar]
- 8.Krolewski M, Eggers P, Warram J. Magnitude of end-stage renal disease in IDDM: a 35 year follow-up study. Kidney Int. 1996;50:2041–2046. doi: 10.1038/ki.1996.527. [DOI] [PubMed] [Google Scholar]
- 9.Atlas of Chronic Kidney Disease and End-Stage Renal Disease in the United States. National Institutes of Health, National Institute of Diabetes and Digestive and Kidney Diseases; Bethesda, MD: 2007. U.S. Renal Data System, USRDS Annual Data Report. [Google Scholar]
- 10.Jefferson JA, Shankland SJ, Pichler RH. Proteinuria in diabetic kidney disease: a mechanistic viewpoint. Kidney Int. 2008;74(1):22–36. doi: 10.1038/ki.2008.128. [DOI] [PubMed] [Google Scholar]
- 11.Furuta T, Saito T, Ootaka T, Soma J, Obara K, Abe K, Yoshinaga K. The role of macrophages in diabetic glomerulosclerosis. Am J Kidney Dis. 1993;21:480–485. doi: 10.1016/s0272-6386(12)80393-3. [DOI] [PubMed] [Google Scholar]
- 12.Sassy-Prigent C, Heudes D, Mandet C, Belair MF, Michel O, Perdereau B, Bariety J, Bruneval P. Early glomerular macrophage recruitment in streptozotocin-induced diabetic rats. Diabetes. 2000;49:466–475. doi: 10.2337/diabetes.49.3.466. [DOI] [PubMed] [Google Scholar]
- 13.Mora C, Navarro JF. The role of inflammation as a pathogenic factor in the development of renal disease in diabetes. Curr Diab Rep. 2005;5(6):399–401. doi: 10.1007/s11892-005-0044-x. [DOI] [PubMed] [Google Scholar]
- 14.Grieco FA, Vendrame F, Spagnuolo I, Dotta F. Innate immunity and the pathogenesis of type 1 diabetes. Semin Immunopathol. 2011;33:57–66. doi: 10.1007/s00281-010-0206-z. [DOI] [PubMed] [Google Scholar]
- 15.Pino SC, Kruger AJ, Bortell R. The role of innate immune pathways in type 1 diabetes pathogenesis. Curr Opin Endocrinol Diabetes Obes. 2010;17(2):126–130. doi: 10.1097/MED.0b013e3283372819. [DOI] [PMC free article] [PubMed] [Google Scholar]
- 16.Devaraj S, Jialal I, Yun JM, Bremer A. Demonstration of increased toll-like receptor 2 and toll-like receptor 4 expression in monocytes of type 1 diabetes mellitus patients with microvascular complications. Metabolism. 2011;60:256–259. doi: 10.1016/j.metabol.2010.01.005. [DOI] [PMC free article] [PubMed] [Google Scholar]
- 17.Zipris D. Toll-like receptors and type 1 diabetes. Adv Exp Med Biol. 2010;654:585–610. doi: 10.1007/978-90-481-3271-3_25. [DOI] [PubMed] [Google Scholar]
- 18.Medzhitov R. Toll-like receptors and innate immunity. Nat Rev Immunol. 2001;1(2):135–145. doi: 10.1038/35100529. [DOI] [PubMed] [Google Scholar]
- 19.Devaraj S, Dasu MR, Rockwood J, Winter W, Griffen SC, Jialal I. Increased toll-like receptor (TLR) 2 and TLR4 expression in monocytes from patients with type 1 diabetes: further evidence of a proinflammatory state. J Clin Endocrinol Metab. 2008;93:578–583. doi: 10.1210/jc.2007-2185. [DOI] [PMC free article] [PubMed] [Google Scholar]
- 20.Devaraj S, Dasu MR, Park SH, Jialal I. Increased levels of ligands of Toll-like receptors 2 and 4 in type 1 diabetes. Diabetologia. 2009;52(8):1665–1668. doi: 10.1007/s00125-009-1394-8. [DOI] [PMC free article] [PubMed] [Google Scholar]
- 21.Gluba A, Banach M, Hannam S, Mikhailidis DP, Sakowicz A, Rysz J. The role of Toll-like receptors in renal diseases. Nat Rev Nephrol. 2010;6(4):224–235. doi: 10.1038/nrneph.2010.16. [DOI] [PubMed] [Google Scholar]
- 22.Brown HJ, Sacks SH, Robson MG. Toll-like receptor 2 agonists exacerbate accelerated nephrotoxic nephritis. J Am Soc Nephrol. 2006;17(7):1931–1939. doi: 10.1681/ASN.2005111167. [DOI] [PubMed] [Google Scholar]
- 23.Sataranatarajan K, Mariappan MM, Lee MJ, Feliers D, Choudhury GG, Barnes JL, Kasinath BS. Regulation of elongation phase of mRNA translation in diabetic nephropathy: amelioration by rapamycin. Am J Pathol. 2007;171(6):1733–1742. doi: 10.2353/ajpath.2007.070412. [DOI] [PMC free article] [PubMed] [Google Scholar]
- 24.Doublier S, Salvidio G, Lupia E, Ruotsalainen V, Verzola D, Deferrari G, Camussi G. Nephrin expression is reduced in human diabetic nephropathy: evidence for a distinct role for glycated albumin and angiotensin II. Diabetes. 2003;52(4):1023–1030. doi: 10.2337/diabetes.52.4.1023. [DOI] [PubMed] [Google Scholar]
- 25.Tryggvason K, Patrakka J, Wartiovaara J. Hereditary proteinuria syndromes and mechanisms of proteinuria. N Engl J Med. 2006;354(13):1387–1401. doi: 10.1056/NEJMra052131. [DOI] [PubMed] [Google Scholar]
- 26.Foster RR, Saleem MA, Mathieson PW, Bates DO, Harper SJ. Vascular endothelial growth factor and nephrin interact and reduce apoptosis in human podocytes. Am J Physiol Renal Physiol. 2005;288(1):F48–F57. doi: 10.1152/ajprenal.00146.2004. [DOI] [PubMed] [Google Scholar]
- 27.Ziyadeh FN, Sharma K, Ericksen M, Wolf G. Stimulation of collagen gene expression and protein synthesis in murine mesangial cells by high glucose is mediated by autocrine activation of transforming growth factor-beta. J Clin Invest. 1994;93:536–542. doi: 10.1172/JCI117004. [DOI] [PMC free article] [PubMed] [Google Scholar]
- 28.Ziyadeh FN. Mediators of diabetic renal disease: the case for TGF-β as the major mediator. J Am Soc Nephrol. 2004;15(1):S55–S57. doi: 10.1097/01.asn.0000093460.24823.5b. [DOI] [PubMed] [Google Scholar]
- 29.Kolb H. Mouse models of insulin dependent diabetes: Low-dose streptozocin-induced diabetes and non obese diabetic (NOD) mice. Diabetes Metab Rev. 1987;3:751 –778. doi: 10.1002/dmr.5610030308. [DOI] [PubMed] [Google Scholar]
- 30.Martinez FO, Sica A, Mantovani A, Locati M. Macrophage activation and polarization. Front Biosci. 2008;13:453–461. doi: 10.2741/2692. [DOI] [PubMed] [Google Scholar]
- 31.Devaraj S, Jialal I. C-Reactive Protein Polarizes Human Macrophages to an M1 Phenotype and Inhibits Transformation to the M2 Phenotype. Arterioscler Thromb Vasc Biol. 2011 doi: 10.1161/ATVBAHA.111.225508. [Epub ahead of print] PubMed PMID: 21415385. [DOI] [PMC free article] [PubMed] [Google Scholar]
- 32.Dasu MR, Devaraj S, Zhao L, Hwang DH, Jialal I. High glucose induces toll-like receptor expression in human monocytes: mechanism of activation. Diabetes. 2008;57:3090–3098. doi: 10.2337/db08-0564. [DOI] [PMC free article] [PubMed] [Google Scholar]
- 33.Hayat MA. Principles and Techniques of Electron Microscopy Biological Applications. CRC Press, Inc; Boca Raton, Florida: 1989. [Google Scholar]
- 34.Karnovsky MJ. A formaldehyde-glutaraldehyde fixative of high osmolality for use in electron microscopy. J Cell Biol. 1965;27:137A–40A. [Google Scholar]
- 35.Chow F, Ozols E, Nikolic-Paterson DJ, Atkins RC, Tesch GH. Macrophages in mouse type 2 diabetic nephropathy: Correlation with diabetic state and progressive renal injury. Kidney Int. 2004;65:116 –128. doi: 10.1111/j.1523-1755.2004.00367.x. [DOI] [PubMed] [Google Scholar]
- 36.Brosius FC, 3rd, Alpers CE, Bottinger EP, Breyer MD, Coffman TM, Gurley SB, Harris RC, Kakuki M, Kretzler M, Leiter EH, Levi M, McIndoe RA, Sharma K, Smithies O, Susztak K, Takahashi N, Takahashi T. Animal models of diabetic complications consortium Mouse models of diabetic nephropathy. J Am Soc Nephrol. 2009;20:2503–2512. doi: 10.1681/ASN.2009070721. [DOI] [PMC free article] [PubMed] [Google Scholar]
- 37.Navarro-González JF, Mora-Fernández C. The role of inflammatory cytokines in diabetic nephropathy. J Am Soc Nephrol. 2008;19:433–442. doi: 10.1681/ASN.2007091048. [DOI] [PubMed] [Google Scholar]
- 38.Fornoni A, Ijaz A, Tejada T, Lenz O. Role of inflammation in diabetic nephropathy. Curr Diabetes Rev. 2008;4:10–17. doi: 10.2174/157339908783502361. [DOI] [PubMed] [Google Scholar]
- 39.Leemans JC, Stokman G, Claessen N, Rouschop KM, Teske GJ, Kirschning CJ, Akira S, van der Poll T, Weening JJ, Florquin S. Renal-associated TLR2 mediates ischemia/reperfusion injury in the kidney. J Clin Invest. 2005;115:2894–2903. doi: 10.1172/JCI22832. [DOI] [PMC free article] [PubMed] [Google Scholar]
- 40.Pulskens WP, Teske GJ, Butter LM, Roelofs JJ, van der Poll T, Florquin S, Leemans JC. Toll-like receptor-4 coordinates the innate immune response of the kidney to renal ischemia/reperfusion injury. PLoS One. 2008;3:e3596. doi: 10.1371/journal.pone.0003596. [DOI] [PMC free article] [PubMed] [Google Scholar]
- 41.Allen TJ, Cooper ME, Lan HY. Use of genetic mouse models in the study of diabetic nephropathy. Curr Diab Rep. 2004;4:435–440. doi: 10.1007/s11892-004-0053-1. [DOI] [PubMed] [Google Scholar]
- 42.Breyer MD, Bottinger E, Brosius FC, 3rd, Coffman TM, Harris RC, Heilig CW, Sharma K. Mouse models of diabetic nephropathy. J Am Soc Nephrol. 2005;16:27–45. doi: 10.1681/ASN.2004080648. [DOI] [PubMed] [Google Scholar]
- 43.Bilous R. Diabetic Nephropathy, edited by Hasslacher C Chichester. West Sussex, UK: John Wiley & Sons; 2001. Renal structural damage in IDDM and NIDDM functional relationships; pp. 71–89. [Google Scholar]
- 44.Maeda M, Yabuki A, Suzuki S, Matsumoto M, Taniguchi K, Nishinakagawa H. Renal lesions in spontaneous insulin-dependent diabetes mellitus in the non obese diabetic mouse: acute phase of diabetes. Vet Pathol. 2003;40:187–195. doi: 10.1354/vp.40-2-187. [DOI] [PubMed] [Google Scholar]
- 45.Li J, Qu X, Yao J, Caruana G, Ricardo SD, Yamamoto Y, Yamamoto H, Bertram JF. Blockade of endothelial-mesenchymal transition by a Smad3 inhibitor delays the early development of streptozotocin-induced diabetic nephropathy. Diabetes. 2010;59:2612–2624. doi: 10.2337/db09-1631. [DOI] [PMC free article] [PubMed] [Google Scholar]
- 46.Jiang T, Huang Z, Lin Y, Zhang Z, Fang D, Zhang DD. The protective role of Nrf2 in streptozotocin-induced diabetic nephropathy. Diabetes. 2010;59:850–860. doi: 10.2337/db09-1342. [DOI] [PMC free article] [PubMed] [Google Scholar]
- 47.Mason RM, Wahab NA. Extracellular matrix metabolism in diabetic nephropathy. J Am Soc Nephrol. 2003;14:1358–1373. doi: 10.1097/01.asn.0000065640.77499.d7. [DOI] [PubMed] [Google Scholar]
- 48.Chen S, Hong S, Iglesias-de lCM, Isono M, Casaretto A, Ziyadeh F. The key role of the transforming growth factor-beta system in the pathogenesis of diabetic nephropathy. Ren Fail. 2001;23:471–481. doi: 10.1081/jdi-100104730. [DOI] [PubMed] [Google Scholar]
- 49.Benigni A, Zoja C, Campana M, Corna D, Sangalli F, Rottoli D, Gagliardini E, Conti S, Ledbetter S, Remuzzi G. Beneficial effect of TGF-β antagonism in treating diabetic nephropathy depends on when treatment is started. Nephron Exp Nephrol. 206(104):158–168. doi: 10.1159/000094967. [DOI] [PubMed] [Google Scholar]
- 50.Bonnet F, Tikellis C, Kawachi H, Burns WC, Wookey PJ, Cao Z, Cooper ME. Nephrin expression in the post-natal developing kidney in normotensive and hypertensive rats. Clin Exp Hypertens. 2002;4(5):371–81. doi: 10.1081/ceh-120004798. [DOI] [PubMed] [Google Scholar]
- 51.Cooper ME, Mundel P, Boner G. Role of nephrin in renal disease including diabetic nephropathy. Semin Nephrol. 2002;22:393–398. doi: 10.1053/snep.2002.34724. [DOI] [PubMed] [Google Scholar]
- 52.Menne J, Meier M, Park JK, Boehne M, Kirsch T, Lindschau C, Ociepka R, Leitges M, Rinta-Valkama J, Holthofer H, Haller H. Nephrin loss in experimental diabetic nephropathy is prevented by deletion of protein kinase C alpha signaling in-vivo. Kidney Int. 2006;70(8):1456–1462. doi: 10.1038/sj.ki.5001830. [DOI] [PubMed] [Google Scholar]
- 53.Welsh GI, Saleem MA. Nephrin-signature molecule of the glomerular podocyte? J Pathol. 2010;220(3):328–337. doi: 10.1002/path.2661. [DOI] [PubMed] [Google Scholar]
- 54.Hodgkinson CP, Laxton RC, Patel K, Ye S. Advanced glycation end-product of low density lipoprotein activates the toll-like 4 receptor pathway implications for diabetic atherosclerosis. Arterioscler Thromb Vasc Biol. 2008;28(12):2275–2281. doi: 10.1161/ATVBAHA.108.175992. [DOI] [PubMed] [Google Scholar]
- 55.Favre J, Musette P, Douin-Echinard V, Laude K, Henry JP, Arnal JF, Thuillez C, Richard V. Toll-like receptors 2-deficient mice are protected against postischemic coronary endothelial dysfunction. Arterioscler Thromb Vasc Biol. 2007;27:1064–1071. doi: 10.1161/ATVBAHA.107.140723. [DOI] [PubMed] [Google Scholar]
- 56.Sakata Y, Dong JW, Vallejo JG, Huang CH, Baker JS, Tracey KJ, Tacheuchi O, Akira S, Mann DL. Toll-like receptor 2 modulates left ventricular function following ischemia-reperfusion injury. Am J Physiol Heart Circ Physiol. 2007;292:H503–H509. doi: 10.1152/ajpheart.00642.2006. [DOI] [PubMed] [Google Scholar]
- 57.Mohammad MK, Morran M, Slotterbeck B, Leaman DW, Sun Y, Grafenstein H, Hong SC, McInerney MF. Dysregulated Toll-like receptor expression and signaling in bone marrow-derived macrophages at the onset of diabetes in the non-obese diabetic mouse. Int Immunol. 2006;18:1101–1113. doi: 10.1093/intimm/dxl045. [DOI] [PubMed] [Google Scholar]
- 58.Li F, Yang N, Zhang L, Tan H, Huang B, Liang Y, Chen M, Yu X. Increased expression of toll-like receptor 2 in rat diabetic nephropathy. Am J Nephrol. 2010;32(2):179–186. doi: 10.1159/000317023. [DOI] [PubMed] [Google Scholar]
- 59.Dasu MR, Thangappan RK, Bourgette A, DiPietro LA, Isseroff R, Jialal I. TLR2 expression and signaling-dependent inflammation impair wound healing in diabetic mice. Lab Invest. 2010;90:1628–1636. doi: 10.1038/labinvest.2010.158. [DOI] [PubMed] [Google Scholar]
- 60.Dasu MR, Riosvelasco A, Jialal I. Candesartan Inhibits Toll like Receptor Expression and Activity both in vitro and in vivo. Atherosclerosis. 2009;202:76–83. doi: 10.1016/j.atherosclerosis.2008.04.010. [DOI] [PMC free article] [PubMed] [Google Scholar]
Associated Data
This section collects any data citations, data availability statements, or supplementary materials included in this article.


