Abstract
The stability of polymeric nanoparticles in serum is critical to their use in drug delivery where dilution after intravenous injection often results in nanoparticle disassembly and drug unloading; however, few investigate this in biologically relevant media. To gain greater insight into nanoparticle stability in blood, the stability of self-assembled polymeric micelles of poly(d,l-lactide-co-2-methyl-2-carboxytrimethylene carbonate)-g-poly(ethylene glycol), P(LA-co-TMCC)-g-PEG, were tested in both serum and individual serum protein solutions. By encapsulating Förster resonance energy transfer pairs and following their release by fluorescence, these micelles demonstrated excellent thermodynamic and kinetic stability in the presence of serum. Further analyses by fast protein liquid chromatography and dynamic light scattering confirmed these data. Moreover, these micelles are compatible with red blood cells, as shown by a hemolysis assay. The stability and compatibility demonstrated in blood suggest that these micelles may be stable in vivo, which is critical for intravenous drug delivery applications. This comprehensive approach to understanding micelle stability and compatibility is broadly applicable.
Introduction
Polymeric nanoparticles have gained popularity as vehicles for drug delivery.1−7 Such drug delivery systems overcome the problem of limited aqueous solubility of many hydrophobic drug molecules, and also have the potential to improve their pharmacologic properties by increasing their in vivo half-life. In order for these nanoparticles to be effective drug delivery carriers, they must remain intact and circulate in the blood for a sufficiently long period of time after intravenous injection to accumulate at the target site.
The circulation time of nanoparticles in vivo is influenced by many factors, including size, size distribution, and surface charge,(8) which in turn influence the degree of interaction with serum proteins. Protein adsorption is a key factor in nanoparticle fate, leading to opsonization and subsequent phagocytosis by macrophages of the reticuloendothelial system (RES) in circulation or in tissues such as the liver and spleen.9,10 Moreover, serum protein adsorption may induce premature release of drugs from nanoparticles due to a partitioning effect before they reach their target sites.(3)
Despite numerous publications on polymeric nanoparticle syntheses for drug delivery, few publications address their stability in serum or in the presence of serum proteins, which is critical to their performance in vivo. Lo et al.(11) and Li et al.(12) found that their micelles were stable in size when immersed in solutions containing albumin. However, albumin does not represent the full complement of proteins in blood, and these results do not adequately represent the stability in circulation. Savic et al.(13) assessed the stability of their polymeric micelles by covalently attaching a fluorogenic dye to the core-forming part of the block copolymer and then using fluorescence detection as a measure of micelle instability. The percentage of disrupted micelles was calculated from the ratio of the fluorescence measured at the end of each time point to the maximum detectable fluorescence (achieved by incubation with NaOH). This innovative method to study the integrity of micelles demonstrated that these poly(caprolactone-b-ethylene oxide) micelles were unstable in serum and required that the core-forming polymer block be covalently modified with a fluorogenic dye, which inevitably impacted micelle stability.
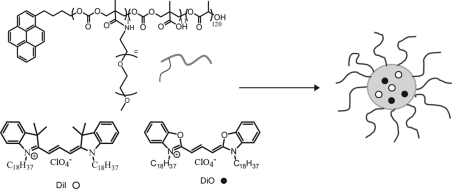
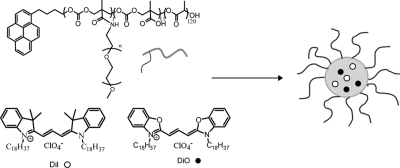
Recently, two groups14−16 used Förster resonance energy transfer (FRET) based methods to study the stability of their polymeric micelles. A FRET pair, utilizing 3,3′-dioctadecyloxacarbocyanine perchlorate (DiO) as the donor and 1,1′-dioctadecyl-3,3,3′,3′-tetramethylindocarbocyanine perchlorate (DiI) as the acceptor, was used to assess the stability of micelles in the presence of serum proteins. When both FRET molecules were encapsulated inside one micelle, and excited at the appropriate wavelength, energy transfer occurred due to the close proximity between the dyes: excitation at 484 nm (donor excitation) resulted in a very strong emission at 565 nm (acceptor emission). When micelles disassembled, the FRET molecules were released and diffused apart, eliminating the energy transfer. As such, a shift of emission peak from 565 to 501 nm was observed. FRET experiments also allowed the kinetic stability of micelles to be studied by monitoring the dynamics of encapsulated molecule exchange between two micelle populations. Thermodynamic stability refers to the potential of micelles to disassemble, while kinetic stability refers to the rate at which the micelles disassemble once the copolymer concentration falls below the critical micelle concentration.(17) The rate of disassembly is influenced by many of the same factors which affect the rate of unimer exchange between micelles.(18) The kinetic stability reveals whether encapsulated molecules will “leak out” from the micelles over time in biological systems.
In this study, we investigated the thermodynamic and kinetic stability of micelles self-assembled from the amphiphilic copolymer poly(d,l-lactide-co-2-methyl-2-carboxytrimethylene carbonate)-g-poly(ethylene glycol), P(LA-co-TMCC)-g-PEG(19) (Scheme 1), combining, for the first time, Förster resonance energy transfer (FRET), fast protein liquid chromatography (FPLC), and dynamic light scattering (DLS) methods. We focused on the stability of these micelles in the presence of complete serum, as well as individual serum proteins, to gain greater insight into the destabilizing effect of serum proteins.
Scheme 1. FRET Molecules (○) DiI and (●) DiO Encapsulated Inside Self-Assembled Polymeric Micelles of P(LA-co-TMCC)-g-PEG.
Experimental Section
Materials and Instruments
α- and β-predominant globulins, γ-globulins, bovine serum albumin (BSA), and dibasic sodium phosphate were purchased from Sigma-Aldrich (St. Louis, MO). 1,1′-Dioctadecyl-3,3,3′,3′-tetramethylindocarbocyanine perchlorate (DiI), 3,3′-dioctadecyloxacarbocyanine perchlorate (DiO), and fetal bovine serum (FBS, no. 12483–020) were purchased from Invitrogen (Carlsbad, CA). Monobasic sodium phosphate was purchased from Bioshop (Burlington, ON). Phosphate buffer (PB, 100 mM, pH 7.4) was prepared by dissolving monobasic sodium phosphate (NaH2PO4, 5.3 g) and dibasic sodium phosphate (Na2HPO4.7H2O, 43.5 g) in 2 L of ddH2O. Phosphate buffer saline (PBS, 1×, pH 7.4) was prepared directly from PBS tablets (Sigma, St. Louis, MO). All the proteins were dissolved in PBS before mixing with micelles. Red blood cells (RBCs) were obtained from a human donor. The amphiphilic copolymer, poly(d,l-lactide-co-2-methyl-2-carboxytrimethylene carbonate)-g-poly(ethylene glycol), P(LA-co-TMCC)-g-PEG, was synthesized as previously described to have P(LA-co-TMCC) with a Mn of 12 kg/mol and a PDI = 1.34 and PEG with a Mn of 10 kg/mol and PDI = 1.03.(19)
Fluorescence Spectroscopy
The time-resolved fluorescence spectra of FRET pairs were measured on a Fluoromax 3 spectrofluorometer (Jobin–Yvon, Edison, NJ) at an excitation wavelength of 484 nm, with slit widths of 2 nm, integration time of 0.1 s and increment of 0.5 nm. Emission spectra were collected from 490 to 700 nm.
Fast Protein Liquid Chromatography (FPLC)
Micelles and BSA were run through a Superdex 200 gel filtration column with a flow rate of 1 mL/min and using 1× PBS (pH 7.4) as the mobile phase. The elution peak areas were obtained using software UNICORN version 4.12.
Dynamic Light Scattering (DLS)
Micelle size was measured on a Malvern Zetasizer Nano ZS, which is equipped with a 4 mW, 633 nm laser. During the measurement, samples were held in polystyrene cuvettes (Küvetten, Germany). The autocorrelation functions of the scattered intensity were analyzed by means of cumulant method to yield the effective diffusion coefficient as a function of the scattering angle.20,21 All samples had a concentration of ∼1 mg/mL and were filtered through NY-0.45 μm filter (Progene, QC, Canada) before measurement, except the ones collected from FPLC.
Methods
FRET Molecules Encapsulation
P(LA-co-TMCC)-g-PEG (12k, 10k, 10% TMCC) (4 mg), DiI (40 μg), and DiO (40 μg) were dissolved in 1 mL of dimethylformamide (DMF). Borate buffer (50 μL, 500 mM, pH 9) and distilled water (0.5 mL) were added to the polymer solution. The solution mixture was dialyzed (MWCO 2 KDa) against distilled water for 24 h. Water was changed every 2 h for the first 8 h. The micelle solution was filtered through a microfilter (0.45 μm) before size measurement.
DiO or DiI Encapsulation for Kinetic Study
P(LA-co-TMCC)-g-PEG (12k, 10k, 10% TMCC) (4 mg), DiI (80 μg) or DiO (80 μg) were dissolved in 1 mL of DMF. Borate buffer (50 μL, 500 mM, pH 9) and distilled water (0.5 mL) were added to the polymer solution. The solution mixture was dialyzed (MWCO 2KDa) against distilled water for 24 h. Water was changed every 2 h for the first 8 h. The micelle solution was filtered through a microfilter (0.45 μm) before the kinetic study experiment.
Incubating FRET-Micelles with FBS
FRET-micelles with a final concentration of 100 μg/mL were incubated with FBS at 37 °C with gentle agitation. The volume ratio of micelle solution to 100% FBS was 1:9. Time-resolved spectra were measured over 48 h with an excitation wavelength at 484 nm.
Estimation of the Half-Life of Micelles in Serum from a Standard Curve
Freshly prepared FRET-micelles were incubated with 100% FBS at 37 °C for 48 h with gentle agitation, assuming that all the micelles were disassembled. These disassembled micelles were mixed with freshly prepared, intact FRET micelles at various concentration ratios. The emission spectra were measured immediately and FRET ratios were calculated.
Kinetic Study of Dye-Encapsulated Micelles
Micelle solutions containing either 2 wt % DiO or 2 wt % of DiI were prepared separately, each having a final micelle concentration of 100 μg/mL. The two micelle solutions were mixed together in PBS with a volume ratio of DiO-micelle to DiI-micelle to PBS of 1:1:8 and incubated at 37 °C with gentle agitation for 48 h, during which emission spectra are measured.
Determination of the Final Polymer Concentration after Dialysis
The initial amount of polymer prior to dialysis was known. Given that the dialysis membrane has a molecular weight cutoff of 2 kDa, the polymer molar mass is 22 kDa, and the micelles are even larger, we assumed 100% polymer micelle recovery after dialysis. The recovered, empty micelles were diluted to a series of concentrations to create a calibration curve of concentration versus polymer absorbance (at 235 nm). Approximately 20% of empty micelles were lost after filtration through a 0.45 μm filter based on the standard curve, and this was taken into account when determining concentration. All subsequent test sample concentrations were fit within the calibration curve.
Hemolysis Assay
The protocol was adopted from Hoffman’s standard procedure for hemolysis assay.(22) Blood samples were collected from a human donor in 4 mL vacutainers coated with EDTA. Serum (the top layer) was removed by centrifugation at 1500 rpm for 10 min. The whole blood was washed with 150 mM NaCl, again centrifuged and the top layer removed (repeated three times). After removing NaCl, the volume was increased to the original sample volume with 100 mM phosphate buffer (PB) at pH 7.4. The red blood cell (RBC) solution was diluted 1 to 10 with PB at pH 7.4 to give a RBC suspension of ∼5 x10⁸ RBC/mL and used immediately for the hemolysis assay.
Micelles were self-assembled from P(LA-co-TMCC)-g-PEG as described above, and then dialyzed against PB (100 mM, pH 7.4). The final micelle solution had a polymer concentration of 1.3 mg/mL. The micelle solution was diluted with PB to a total volume of 800 μL and mixed with 200 μL RBC solution to achieve final polymer concentrations of 1000, 800, 500, 250, 130, 65, and 33 ug/mL. Each mixture was incubated at 37 °C for 1 h and mixed by inversion after 30 min. After incubation, the solution mixture was centrifuged at 5000 rpm for 5 min. The supernatant was collected and absorbance of lysed, oxygen saturated hemoglobin was measured at 541 nm. The controls included incubating RBCs with 800 μL of PB only or with 800 μL of 0.5 mg/mL dextran (60 kDa) to ensure that the presence of a polymeric material did not affect the integrity of the RBC membranes. The positive controls included incubating RBCs with deionized water (800 μL) or Triton X-100 1% (w/v) (800 μL) which is known to rupture RBC membranes. The hemolytic percentage was calculated according to the equation below:
Results and Discussion
Stability Study of Micelles in Complete Serum and Individual Serum Proteins
FRET molecules DiO and DiI, 1 wt % each, were encapsulated in micelles during their self-assembly by a dialysis method (described above). When the DiO/DiI encapsulated micelle (FRET-micelle) solution was diluted with an excess volume of water, the FRET fluorescence peak was unchanged (Figure S1a, Supporting Information); however, when the identical FRET-micelle solution was diluted with an excess of acetone, a dramatic peak shift was observed from 565 to 501 nm, suggesting the escape of FRET molecules (Figure S1b, Supporting Information). The size of FRET-micelles, measured by DLS, had an average hydrodynamic diameter of 80 nm (Figure S2, Supporting Information).
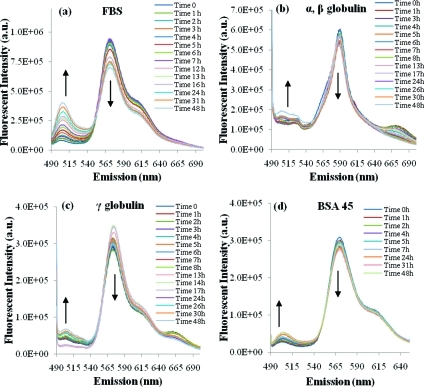
The stability of FRET-micelles was first investigated in the presence of fetal bovine serum (FBS). An increase in the fluorescence intensity at 501 nm and a decrease at 565 nm was observed over time (Figure 1a), which suggested that FRET molecules were slowly released from the micelles when incubated with serum. The major proteins present in serum are α-, β-, and γ-globulins and albumin. Globulins account for approximately 18% of the total proteins in serum while albumin accounts for approximately 60%.(23) A previous study by Chen et al.(14) found that α-, β-globulins were the prime factors responsible for the release of hydrophobic molecules from poly(ethylene glycol)-block-poly(d,l-lactide) polymeric micelles, while other blood components, such as γ-globulins, albumin, and red blood cells played minor roles. Therefore, globulins (α-, β-, γ-) and albumin were studied here due to their abundant presence in plasma and their potential to destabilize micelles.
Figure 1.
Fluorescence measurement of FRET pairs (DiI and DiO) encapsulated in P(LA-co-TMCC)-g-PEG micelles: (a) time-resolved spectra of FRET micelles in 100% fetal bovine serum; (b) α-, β-globulins solution (15 mg/mL); (c) γ-globulins solution (15 mg/mL); (d) BSA solution (45 mg/mL).
A solution of α-, β-, or γ-globulin (15 mg/mL), which was similar to the concentration found in plasma,(23) was prepared fresh and mixed with FRET-micelles to give a final micelle polymer concentration of 100 μg/mL. The role of albumin was investigated similarly where BSA, at a concentration of 45 mg/mL, was incubated with FRET-micelles. The time-resolved emission spectra were measured as shown in Figure 1b–d (see Supporting Information, Figure S3, for background controls). In contrast to whole serum, only a slight peak shift from 565 to 501 nm was observed when micelles were incubated with the individual major serum proteins. Thus, the destabilization observed in whole serum may have arisen from the cumulative effect of all of the major serum proteins, as well as minor serum proteins that were not tested individually.
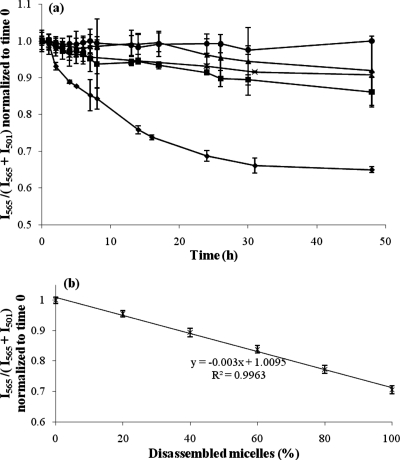
The FRET ratio, I565/(I565 + I501), was calculated to monitor the relative peak shift between I501 (the emission of DiO at 501 nm) and I565 (the emission of DiI at 565 nm). For micelles in serum, a decrease in the FRET ratio from 1 to 0.65 was observed over 48 h (Figure 2a). After 31 h, the FRET ratio reached a plateau. The half-life of micelles in serum was estimated using a standard curve that correlates the FRET ratio to the percentage of disassembled micelles (Figure 2b). After incubating FRET micelles with 100% serum for 48 h, we assumed that all of the micelles disassembled because the FRET ratio reached a plateau. To substantiate this assumption, an equal concentration of each of the DiI and DiO FRET pair were dissolved directly in FBS, without micelles. The calculated FRET ratio was approximately 0.55 regardless of the dye concentration (Figure S5, Supporting Information), which is similar to the ratio of FRET-micelles in FBS at 48 h (which was then normalized to 0.65) and assumed to represent completely disassembled micelles. When half of the micelles were disassembled, the estimated FRET ratio was 0.86, which corresponded to ∼8 h in Figure 2a. First-order kinetics can be assumed when the reaction rate depends on the concentration of only one reactor. For example, if the micelle concentration is held constant, the disassembly of micelles only depends on the serum protein concentration. A nonlinear fit (eq 1) of the FRET ratio was generated by the method of least-squares and the rate constant (K) obtained was 0.079 h–1 (eq 2). The corresponding half-life of micelles in complete serum from this fit was estimated to be 8.8 h.
Figure 2.
(a) Stability of FRET-micelles in the presence of FBS is compared to PBS (control) and each of the major serum proteins. Time traces of the FRET ratio, I565/(I565 + I501), normalized to time 0, in solutions of (●) PBS at pH 7.4, (◼) α-, β-globulins at 15 mg/mL, (▲) γ-globulins at 15 mg/mL, (×) BSA at 45 mg/mL, and (⧫) 100% FBS (n = 3 independent experiments, mean ± standard deviation plotted). (b) Standard curve correlates FRET ratio to percentage of disassembled micelles. It is assumed that all FRET-micelles are completely disassembled after incubating with 100% FBS for 48 h (n = 3 independent experiments, mean ± standard deviation plotted).
When micelles were incubated with each protein, a small decrease in the FRET ratio was also observed, but not as significant as whole serum. For example, the FRET ratio decreased to 0.86 for α-, β-globulin, 0.92 for γ-globulin, and 0.91 for BSA at the 48 h time point (Figure 2a). The above results imply that few FRET molecules leak out of the micelles while incubated with individual globulins or albumin over 48 h. Each major protein contributed similarly to micelle destabilization at the 48 h time point: there was no significant difference in the FRET ratios of each protein (one-way ANOVA, p > 0.05). However, the FRET data of each individual protein solution were significantly different at 48 h from that of both the PBS control (p < 0.05) and the serum sample (p < 0.001), likely due to the combined effect of all serum proteins.
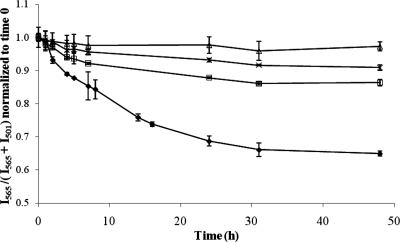
The impact of protein concentration on micelle stability was investigated with a series of BSA concentrations where FRET-micelles with a final concentration of 100 μg/mL were incubated with BSA at various concentrations at 37 °C over 48 h. The FRET ratio was calculated at each time point and compared to serum as shown in Figures 3 and S6 (Supporting Information). The FRET ratio at 48 h decreased from 0.97 to 0.91 to 0.86 as the BSA concentration increased from 15 to 45 to 90 mg/mL, indicating that the release rate of FRET molecules increased significantly with protein concentration (p < 0.01).
Figure 3.
The stability of FRET-micelle is compared to bovine serum albumin at various protein concentrations. Time traces of the FRET ratio normalized to time 0 in solutions of (Δ) 15 mg/mL BSA, (×) 45 mg/mL BSA, (◻) 90 mg/mL BSA, and (⧫) 100% FBS (n = 3 independent experiments, mean ± standard deviation are plotted).
To study the integrity of micelles in the presence of proteins, micelles were incubated with BSA solution at a 1:1 volume ratio at 37 °C for 0, 6, 24, and 48 h. The final micelle concentration in the solution mixture was 1 mg/mL and the final concentration of BSA was 45 mg/mL. Here higher micelle concentration was used compare to previous experiments. This is because that at the end of each incubation time, micelles were separated from BSA by FPLC, which inherently resulted in significant sample dilution. If the starting micelle concentration was too low, then it would fall below the detection limit of the UV/vis detector. The micelle and BSA peaks were completely resolved, as shown in Figure S7 (Supporting Information). The peak area ratio between micelle and BSA was calculated and normalized to time 0 (Figure 4a and supplemental Table 1 in the Supporting Information). After 48 h, approximately 80% of the micelles were recovered from the column, suggesting that approximately 20% of the micelles lost their integrity while incubating with BSA. Only this major serum protein was investigated because micelles could not be separated efficiently from all of the serum proteins using this methodology. The FPLC data showing 80% recovery of micelles after 48 h of incubation in BSA was consistent with the FRET data where the decrease in FRET ratio to 0.91 corresponded to approximately 75% of intact micelles (Figure 2b). Notwithstanding that more micelles will disassemble in the presence of complete serum, the recovery of a large majority of the micelles after incubation in albumin demonstrated the stability of these micelles and their potential to be used for intravenous administration as drug delivery vehicles.
Figure 4.
(a) Micelles were incubated with BSA at 45 mg/mL for 0, 6, 24, and 48 h, and then separated by FPLC on a Superdex 200 column. The elution peak at 42 mL is from micelles, while the elution peaks at 61 and 71 mL are from BSA. (b) Size of micelles recovered from FPLC after 0, 6, 24, and 48 h of incubation in BSA was determined by DLS measurements and compared to the original micelle size prior to incubation. Both size and size distribution were unchanged before and after protein incubation (see supplemental Table 2, Supporting Information).
The hydrodynamic diameters of the micelles recovered from the FPLC were measured by DLS and compared to those prior to incubation in BSA (Figure 4b and supplemental Table 2 in the Supporting Information). To provide some perspective to the DLS measurements, micelles were purposefully destroyed in the presence Triton X-100 where the DLS distribution is markedly different than that observed for intact micelles (Figure S4, Supporting Information). There was only minimal change in both micelle diameter and distribution (PDI) before and after the BSA incubation, suggesting that albumin adsorption is minimal. The isoelectric point (pI) is 4.8 for BSA,(24) 5.3 for β-globulin,(25) and 6.5 for γ-globulin,(25) indicating that these proteins are all negatively charged at physiological pH. Since the self-assembled micelles had a slightly negative zeta potential (−15 mV)(19) at pH 7.4, protein adsorption to the micelle surface may be limited by charge repulsion. By minimizing protein adsorption, these micelles may be well-suited for intravenous administration and targeted delivery strategies. Since opsonization and uptake by macrophages of the reticuloendothelial system result in reduced circulation time in blood, reduced protein adsorption to our micelles may result in increased circulation. However, we acknowledge that the opsonization of negatively charged species and their clearance by immune cells are also common and thus a full in vivo circulation time will be required in the future.
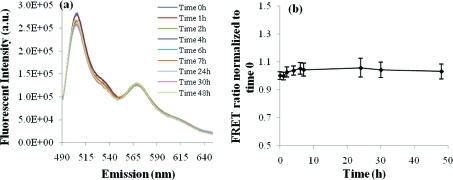
The kinetic stability of the micelles was studied to evaluate the potential release of encapsulated drug molecules upon interaction with blood proteins. The hypothesis was that if micelles have poor kinetic stability, the FRET molecules would exchange between the two micelle populations. As the FRET molecules mixed inside a single micelle, the fluorescence transfer could occur and the corresponding change in fluorescence spectra would be detected. This experiment was performed in PBS instead of serum to prevent the released dyes from partitioning into the serum proteins instead of another micelle.
Interestingly, no significant peak shift was observed, suggesting the dye exchange rate was extremely slow between micelles containing either DiO or DiI (Figure 5). The FRET ratio only increased by 6%, from 1.00 to 1.06 over 48 h, which is similar to a change obtained from a highly cross-linked nanogels,(16) suggesting kinetically stable micelles. Given the low exchange between P(LA-co-TMCC)-g-PEG micelles and their low critical micelle concentration of 12 mg/L,(19) cross-linking is likely unnecessary for further stabilization.
Figure 5.
Kinetic stability study of a mixed solution of micelles encapsulating one of DiO and DiI in PBS at pH 7.4. (a) Emission spectra over 48 h with the excitation wavelength at 484 nm; and (b) the FRET ratio, I565/(I565 + I501), normalized to time 0 changes only minimally as a function of time (n = 3, mean ± standard deviation plotted).
Hemolytic Properties of the P(LA-co-TMCC)-g-PEG Micelles
The P(LA-co-TMCC)-g-PEG micelles were incubated with human red blood cells (RBCs) to evaluate hemolysis. Cytotoxic materials result in lysis of RBCs and the release of heme into solution, which is detected by absorbance at 541 nm. The percentage of hemolysis (relative to pure water, which showed 100% hemolysis) was approximately 0% when RBCs were incubated with micelle solutions having polymer concentrations between 0 and 1 mg/mL (Figure S8, Supporting Information), concentrations that significantly exceeded what we would expect in vivo. These data demonstrated that these polymers were cytocompatible and not hemolytic.
Conclusions
Using a series of complementary techniques, we gained a thorough understanding of the thermodynamic stability of self-assembled polymeric micelles in biologically relevant solutions of both complete serum and the major serum proteins. They also demonstrated kinetic stability when incubated with PBS. The micelles of P(LA-co-TMCC)-g-PEG had an approximate half-life of 9 h in serum, suggesting their utility for drug delivery studies by intravenous infusion. There was no strong link between the stability of micelles and the adsorption of any one of the major serum proteins; however, increased protein concentration resulted in decreased stability. The micelle diameter and population distribution were unchanged after incubation in BSA, suggesting minimal BSA adsorption. Moreover, no hemolysis was observed from the polymeric micellar concentrations tested. These battery of studies form a framework for anaylsis of other micelles and together demonstrate that the P(LA-co-TMCC)-g-PEG micelles have properties desirable for in vivo use as drug delivery vehicles.
Acknowledgments
We thank Professor Mitchell Winnik for his thoughtful advice on this project. We are grateful for funding from Ontario Centers of Excellence, Center for Materials and Manufacturing through the Champions of Research program (M.S.S.), the Canadian Institute of Health Research (M.S.S.) and the Ontario Graduate Scholarship (J.L.).
Supporting Information Available
Experimental details and fluorescence data. This material is available free of charge via the Internet at http://pubs.acs.org.
Supplementary Material
References
- Shi M.; Ho K.; Keating A.; Shoichet M. S. Adv Funct Mater 2009, 19 (11), 1689–1696. [Google Scholar]
- Lu J.; Shi M.; Shoichet M. S. Bioconjugate Chem 2009, 20 (1), 87–94. [DOI] [PubMed] [Google Scholar]
- Liu J. B.; Zeng F. Q.; Allen C. J. Controlled Release 2005, 103 (2), 481–497. [DOI] [PubMed] [Google Scholar]
- Allen C.; Han J. N.; Yu Y. S.; Maysinger D.; Eisenberg A. J. Controlled Release 2000, 63 (3), 275–286. [DOI] [PubMed] [Google Scholar]
- Aliabadi H. M.; Lavasanifar A. Expert Opin. Drug Deliv. 2006, 3 (1), 139–62. [DOI] [PubMed] [Google Scholar]
- Yu B. G.; Okano T.; Kataoka K.; Kwon G. J. Controlled Release 1998, 53 (1–3), 131–6. [DOI] [PubMed] [Google Scholar]
- Torchilin V. P. Cell. Mol. Life Sci. 2004, 61 (19–20), 2549–2559. [DOI] [PMC free article] [PubMed] [Google Scholar]
- Yamamoto Y.; Nagasaki Y.; Kato Y.; Sugiyama Y.; Kataoka K. J. Controlled Release 2001, 77 (1–2), 27–38. [DOI] [PubMed] [Google Scholar]
- Moghimi S. M.; Patel H. M. Adv. Drug Deliv. Rev. 1998, 32 (1–2), 45–60. [DOI] [PubMed] [Google Scholar]
- Devine D. V.; Marjan J. M. J. Crit. Rev. Ther. Drug 1997, 14 (2), 105–131. [PubMed] [Google Scholar]
- Lo C. L.; Huang C. K.; Lin K. M.; Hsiue G. H. Biomaterials 2007, 28 (6), 1225–1235. [DOI] [PubMed] [Google Scholar]
- Li Y. P.; Pan S. R.; Zhang W.; Du Z. Nanotechnology 2009, 20 (6), 1–11. [DOI] [PubMed] [Google Scholar]
- Savic R.; Azzam T.; Eisenberg A.; Maysinger D. Langmuir 2006, 22 (8), 3570–3578. [DOI] [PubMed] [Google Scholar]
- Chen H.; Kim S.; He W.; Wang H.; Low P. S.; Park K.; Cheng J. X. Langmuir 2008, 24 (10), 5213–5217. [DOI] [PubMed] [Google Scholar]
- Chen H.; Kim S.; Li L.; Wang S.; Park K.; Cheng J. X. Proc. Natl. Acad. Sci. U.S.A. 2008, 105 (18), 6596–601. [DOI] [PMC free article] [PubMed] [Google Scholar]
- Jiwpanich S.; Ryu J. H.; Bickerton S.; Thayumanavan S. J. Am. Chem. Soc. 2010, 132 (31), 10683–5. [DOI] [PMC free article] [PubMed] [Google Scholar]
- Kwon G. S.; Okano T. Adv. Drug Deliv. Rev. 1996, 21 (2), 107–116. [Google Scholar]
- Allen C.; Maysinger D.; Eisenberg A. Colloids Surf., B 1999, 16 (1–4), 3–27. [Google Scholar]
- Lu J.; Shoichet M. S. Macromolecules 2010, 43 (11), 4943–4953. [Google Scholar]
- Verdonck B.; Gohy J. F.; Khousakoun E.; Jerome R.; Du Prez F. Polymer 2005, 46 (23), 9899–9907. [Google Scholar]
- Putaux J. L.; Minatti E.; Lefebvre C.; Borsali R.; Schappacher M.; Deffieux A. Faraday Discuss. 2005, 128, 163–178. [DOI] [PubMed] [Google Scholar]
- Flanary S.; Hoffman A. S.; Stayton P. S. Bioconjugate Chem 2009, 20 (2), 241–248. [DOI] [PMC free article] [PubMed] [Google Scholar]
- Beck W. S., Hematology; MIT Press: Cambridge, MA, 1991. [Google Scholar]
- Kunkel H. G.; Tiselius A. J. Gen. Physiol. 1951, 35 (1), 89–118. [DOI] [PMC free article] [PubMed] [Google Scholar]
- Abramson H. A.; Moyer L. S.; Gorin M. H.. Electrophoresis of Proteins and the Chemistry of Cell Surfaces; Reinhold: New York, 1942. [Google Scholar]
Associated Data
This section collects any data citations, data availability statements, or supplementary materials included in this article.


