

SUMMARY
1. Vascular inflammation plays a critical role in atherogenesis. Previously, we showed that baboon arterial endothelial cells (BAEC) were hyporesponsive to lipopolysaccharide (LPS) compared with human arterial endothelial cells (HAEC).
2. In the present study, we investigated mechanisms underlying differential responses between HAEC and BAEC to tumour necrosis factor (TNF)-α and LPS.
3. Both HAEC and BAEC responded similarly to TNF-α. However, BAEC showed retarded responses to LPS in expression of E-selectin, intercellular adhesion molecule-1 (ICAM-1), monocyte chemotactic protein-1 (MCP-1) and interleukin-8 (P < 0.05). These changes were confirmed at the mRNA level. Tumour necrosis factor-α activated nuclear factor-κB members such as p50, p52, p65, c-rel and RelB in both HAEC and BAEC. In contrast, LPS activated p50 and p65 only in HAEC. Using microarray assays, we found that TNF receptor-associated factor 2 (TRAF-2), TNF receptor superfamily member 1A -associated via death domain (TRADD) and nuclear factors such as nuclear factor of kappa in B-cells inhibitor, α (NFKBIA) and nuclear factor of kappa in B-cells inhibitor, β (NFKBIB) were upregulated by LPS only in HAEC. Although the baseline expression of Toll-like receptor (TLR) 4 was low in both HAEC and BAEC, TNF-α activated TLR4 expression in both cell types. Although LPS increased TLR4 expression only in HAEC, human and baboon peripheral blood mononuclear cells exhibited similar TLR4 expression and response to LPS. Transfecting BAEC with TLR4/myeloid differentiation protein-2 (MD-2) overexpression vector conferred BAEC responsiveness to LPS.
4. The findings of the present study indicate that an altered TLR4 system may be responsible for the resistance of baboon endothelial cells to LPS. Given the importance of TLR4 in human immune responses and vascular diseases, the natural resistance of baboons to LPS/TLR4-initiated inflammation could make the baboon a valuable animal model in which to study how inflammation affects atherogenesis.
Keywords: baboons, endothelial cells, inflammatory reactions, lipopolysaccharide, Toll-like receptor
INTRODUCTION
In previous studies, we reported diverse endothelial responses to different pro-inflammatory stimuli in baboons.1,2 Although endothelial cells from humans and baboons respond similarly to tumour necrosis factor (TNF)-α, baboon endothelial cells appear to be resistant to the lipopolysaccharide (LPS)-induced endothelial activation observed in humans. These findings are consistent with earlier studies conducted in baboons showing that injection of a high dose of LPS into the baboon bloodstream does not elicit vessel wall inflammation, whereas humans and chimpanzees exhibit strong inflammatory responses.3
Chronic inflammation, induced by pathogenic bacterial/viral infection or non-pathogenic factors, such as oxidized low-density lipoprotein, is thought to play a major role in the development of atherosclerosis. Lipopolysaccharide is a unique glycolipid contained in the outer leaflet of the outer wall of Gram-negative bacteria 4 that colonize human gastrointestinal, genitourinary and respiratory tracts and generate LPS, which causes endothelial dysfunction and is associated with atherosclerosis.5-7 When human cells are exposed to LPS, they bind to toll-like receptor (TLR) 4 assisted by other proteins, including LPS-binding protein, CD14 and MD-2.4,8,9 The TLR4 protein complex then initiates recruitment of Toll/IL-1 receptor domain-containing adaptor molecules, myeloid differentiation factor 88, TNF receptor-associated factor-6, interleukin (IL)-1 receptor-associated kinase and a few other proteins.10,11 These events lead to the activation of the nuclear factor (NF)-κB cascade for the inflammatory response. It is therefore important to understand the molecular mechanisms responsible for the natural resistance to LPS in baboons, which could be developed as a valuable animal model for vascular disease research. The comparative investigation between humans and baboons will shed light on mechanisms that are responsible for inflammation-initiated atherogenesis.
In the present study, we investigated the cellular and molecular events mediating these differential responses to pro-inflammatory stimuli in human and baboon arterial endothelial cells (HAEC and BAEC, resepctively). We compared the effects of LPS with those of TNF-α, a cytokine known to activate both HAEC and BAEC. Our findings indicate that the TLR4 pathway may be responsible for the differential responses.
METHODS
This study was approved by the Institutional Animal Care and Use Committee (IACUC) of the Southwest Foundation for Biomedical Research, which is in compliance with animal care regulations and applicable national laws of the US.
Endothelial cell culture and treatment
The BAEC were isolated in our laboratory as reported previously.1,2 Surgery was performed by experienced veterinarians and procedures were approved by the IACUC of the Southwest Foundation for Biomedical Research. The HAEC were purchased from Clonetics (Rockland, CA, USA). Both BAEC and HAEC were cultured in F-12K medium supplemented with 20% fetal calf serum (FCS), 75 μg/mL endothelial-derived growth factor (Sigma, St. Louis, MI, USA), 50 μg/mL heparin, 10 mmol/L HEPES, 2 mmol/L glutamine and antibiotics. Confluent cells were dislodged with a 0.05% trypsin and Versene solution and subcultured at a ratio of 1 : 3. All cell culture media or supplements were purchased from Invitrogen (San Diego, CA, USA) unless stated otherwise. Cells were allowed to grow to 70–90% confluence before treatment. Cells were treated for either 4 or 24 h with 10.0 ng/mL TNF-α (Sigma) or 1.0 μg/mL LPS (Sigma). Control cells were treated with the same volume of saline.
Peripheral blood mononuclear cells and treatment
In order to understand whether there are cell type-specific responses to LPS stimulation, we also harvested baboon peripheral blood mononuclear cells (PBMC) and subjected these cells to LPS treatment. Human and baboon whole-blood samples collected in heparin tubes (5 U/mL) were placed in 50 mL conical centrifuge tubes. Using a sterile pipette, an equal volume of phosphate-buffered saline (PBS) was added. The blood/PBS mixture was then slowly layered on the Ficoll-Hypaque solution. The mixtures were centrifuged in a GH-3.7 rotor (Beckman, Fullerton, CA) at 900 g for 30 min at 18–20°C. After removing the upper layer containing the plasma and most of the platelets, the mononuclear cell layer was transferred to another centrifuge tube and washed three times with PBS. The isolated PBMC were then resuspended in a complete F-12K medium. Two million isolated cells were treated with either 0, 0.1, 1.0 and 10.0 ng/mL TNF-α or 0, 0.1, 1.0 and 10.0 ng/mL LPS in 2 mL of 10% FCS F-12K medium. After 4 h, supernatants from the cultures were collected by centrifugation at 1750 g. for 10 min. Interleukin-8 levels in culture supernatants were determined by ELISA (R&D Systems, Minneapolis, MN, USA). The results reported are representative of three independent experiments.
Quantification of cell adhesion molecules on the endothelial cell surface
Cells, at the passage indicated, were seeded in 100 μL culture medium at a density of 50 000 /mL in 96-well plates. After 24 h culture, cells were treated and fixed with 3.7% paraformaldehyde in PBS. Cells were blocked with 2% bovine servum albumin (BSA) and incubated at 4°C overnight with goat polyclonal antibodies against human E-selectin or intercellular adhesion molecule (ICAM)-1 (R&D Systems) at a dilution of 1 : 500. After incubation with secondary antibody conjugated with peroxidase (Sigma) at a dilution of 1 : 5000 at 37°C for 1 h, o-phenylenediamine dihydrochloride (Sigma) was used to develop colour. Optical densities (OD) were read at 492 nm. All experiments had blank controls without treatment and negative controls with equal volumes of medium. Results are expressed as the percentage of treated to untreated samples. Experiments were repeated at least three times.
Western blot
Five million 3rd-passage endothelial cells were grown in 100 mm Petri dishes and treated with either 10.0 ng/mL TNF-α or 1.0 μg/mL LPS for 4 or 24 h. Cells were lysed in 1.0 mL lysis buffer (Sigma). Cell debris were removed by centrifugation at 10 000 g for 10 min and the supernatants were boiled in Laemmli sample buffer (Bio-Rad, Hercules, CA, USA) for 5 min. Equal amounts of protein were subjected to size fractionation using a 12% sodium dodecyl sulphate–polyacrylamide gel electrophoresis (SDS-PAGE) precast gel (Bio-Rad) at 100 V for 2 h at room temperature. Proteins were blotted onto a polyvinylidene difluoride membrane (Bio-Rad) and transferred electrically at 30 V for 4 h at 4°C. Membranes were blocked with 5% non-fat milk in Tris-HCl buffered saline (TBS) with 0.05% Tween-20, pH 7.4, overnight at 4°C and probed with goat polyclonal antibodies against human E-selectin and ICAM-1 at a dilution of 1 : 500. After incubation with secondary antigoat antibody conjugated peroxidase (Sigma) at a dilution of 1 : 5000 in a 37°C water bath for 1 h, antibody–antigen complexes were detected using the chemiluminescent detection system ECL Plus (GE Healthcare Life Science, Piscataway, NJ, USA) according to the manufacturer’s instructions. Bands were scanned using a Storm scanner (GE Healthcare, Piscataway, NJ, USA). Membranes were stripped using stripping solution (Thermo Fisher Scientific, Pittsburg, MA, USA) and re-probed with anti-β-actin (Sigma) diluted 1 : 1000.
Cytokine production after endothelial cell activation
For quantification of cytokine production, we inoculated cells with culture medium at the 3rd or 4th passage at a density of 5 × 10⁴ /well in a six-well plate. After cells had reached 70–90% confluence, they were treated and the supernatant collected. Samples were stored at −70°C until assayed. Commercial ELISA kits were used for the measurement of MCP-1 (DCP00; R&D Systems) and IL-8 (D800C; R&D Systems). The limit of detection of the assays was 10 pg/mL IL-8 and 3 pg/mL MCP-1.
Quantitative ELISA for transcription factor activation
Using a nuclear extract kit (ActiveMotif, Austin, CA, USA), nuclear extracts were prepared from HAEC and BAEC after they had been treated with TNF-α or LPS as described earlier. Nuclear extracts were assayed at 10 μg/well for p65, p50, c-Rel, p52 and RelB activity using the TransAM NFκB Family Kit (ActiveMotif), according to the protocol provided by the manufacturer. This kit has immobilized oligonucleotide containing the NF-κB consensus site (5′-GGGACTTTCC-3′) to which only active NF-κB form will bind. The specificity of the assay was monitored using wild-type and mutated consensus oligonucleotides. Assays were conducted in duplicate wells in three independent experiments.
Flow cytometry analysis
Endothelial cells and PBMC were washed twice with PBS and suspended in staining buffer (PBS containing 1% BSA and 0.1% NaN3, pH 7.2) and then 0.5 million cells were blocked with 2% human AB serum in PBS containing 0.1% NaN3 before being incubated at 4°C for 20 min with anti-human TLR4 conjugated with phycoerythrin PE (clone: HAT125) and isotype-matched control (clone: eBM2a; both from eBioscience, San Diego, CA, USA). The TLR4/MD-2-positive cell line HEK293 (#293-htlr4-md2-cd14; Invitrogen, San Diego, CA, USA) was used initially to optimize flow cytometry analysis. Unstained and isotype controls were used to determine the background staining. Flow cytometry analysis was performed using flow cytometry Calibur flow cytometry (BD Immunocytometry Systems, San Jose, CA, USA). Mean fluorescent intensity (MFI) values at respective gates were used to represent antigen expressions. Fold changes compared with untreated controls were calculated and used to determine cellular response levels.
cDNA array analyses
Total RNA was isolated using TRIzol Reagent (Invitrogen). The cRNA probes for array interrogation were generated by first synthesizing cDNA. For first-strand cDNA synthesis, primers were annealed to mRNA templates by incubating 1 μL total RNA (1 μg) with 1 μL of 5 μmol/L T7-Oligo(dT) (Ambion, Austin, TX, USA) for 6 min at 70°C and then cooled to 4°C for 2 min The mRNA was then reverse transcribed by the addition of 1 μL of 5× first-strand buffer (Invitrogen), 0.5 μL of 100 mmol/L dithiothreitol (DTT), 0.375 μL of 10 mmol/L dNTP mix, 0.25 μL RNase inhibitor (40 U/μL; Invitrogen), 0.5 μL SuperScript II (200 U/μL; Invitrogen) and 0.375 μL diethyl pyrocarbonate (DEPC)-treated water to the RNA-primer mixture. The reaction was incubated for 1 h at 42°C and the SuperScript II heat-inactivated for 10 min at 70°C. The cDNA second strand was synthesized by the addition of 7.5 μL of 5× second-strand buffer (Invitrogen), 0.75 μL of 10 mmol/L dNTP mix, 0.25 μL DNA Ligase I (10 U/μL; Invitrogen), 1 μL DNA polymerase I (10 U/μL; Invitrogen) and 0.25 μL RNase H (2 U/μL; Invitrogen) to the first-strand reaction and incubated for 2 h at 16°C. Then, 1 μL T4 DNA polymerase (5 U/μL; Invitrogen) was added to the reaction and the mixture incubated for 10 min at 16°C. The cDNA was precipitated by first adding 2 μL glycogen (5 mg/mL) as a carrier and then 80 μL DEPC-treated water, followed by 0.6 volumes of 5 mol/L ammonium acetate and 2.5 volumes of cold absolute ethanol. After the cDNA had been precipitated overnight at −20°C, samples were centrifuged at 17 000 g for 30 min at 4°C. The DNA pellets were washed in 70% ethanol (with DEPC-treated distilled H2O) and air dried.
Complementary RNA synthesis by in vitro transcription was performed using the MAXIscript Kit (Ambion) by adding 7 μL nuclease free water to the cDNA pellet and then adding 2 μL of 10× Transcription Buffer, 1 μL 10 mmol/L ATP, 1 μL of 10 mmol/L GTP, 1 μL of 10 mmol/L CTP, 1 μL of 250 μmol/L UTP (12.5 μmol/L), 5 μL [a-32P]-UTP (1.1e+14 Bq)/mM and T7 enzyme mix. The reaction was incubated for 1 h at 37°C and the cDNA template removed by the addition of 1 μL DNase I, incubating the mixture for 15 min at 37°C and inactivation with 1 μL of 0.5 mol/L EDTA. The cRNA was cleaned using a Sephadex G-50 column (Roche, Indianapois, IN, USA) according to the manufacturer’s instructions. An aliquot 1 μL of cRNA was counted in a scintillation counter to determine synthesis efficiency. Purified cRNA was then fragmented using fragmentation buffer (Ambion) according to the manufacturer’s instructions.
Two cDNA gene arrays were used, an NF-κB pathway array (#HS-016.2; SuperArray, Bethesda, MD, USA) and an EC biology array (#HS-036.2; SuperArray). For hybridization of cRNA probes with the cDNA gene arrays, arrays were first prehybridized for 2 h at 42°C with Ultrahyb Buffer (Ambion). A denatured cRNA probe was added to the membrane in prehybridization buffer and hybridized for 42 h at 42°C. Arrays were washed once in 2× standard saline citrate (SSC)/0.1% sodium dodecyl sulfate (SDS) for 5 min, twice in 2× SSC/0.1% SDS at 35°C for 5 min and twice in 0.2× SSC/0.1% SDS at 35°C for 10 min. After washing, nylon membrane arrays were air dried and placed in Phosphorimager cassettes (GE Healthcare, Piscataway, NJ, USA) for image capture.
Each gene array image was acquired by exposing nylon filters to Phosphorimager cassettes and capturing the image with a Phosphorimager (Storm 840; GE Healthcare) using ImageQuantTL Image Analysis Software (GE Healthcare). Each image was loaded into ImaGene 5.6 Microarray Image Analysis software (Biodiscovery, El Segundo, CA, USA) and the template containing the annotated grid applied to the image. Intensities and quality values were averaged for replicate spots.
Reverse transcription–polymerase chain reaction for mRNA quantification
Briefly, endothelial cells were exposed to either 10.0 ng/mL TNF-α (T0157; Sigma) or 1.0 μg/mL LPS (L8274; Sigma) in 20% FCS endothelial cell growth medium. After 20 h, RNA was extracted using TRIzol Reagent (Invitrogen). Reverse transcription (RT) of single-stranded mRNA was performed with the High Capacity Transcription Kit (Invitrogen) using 1 μg total RNA. Primers were designed according to the available human and primate sequences for TLR4 using Primer 3.0 software (http://frodo.wi.mit.edu/cgibin/primer3/primer3_www.cgi). Primer sequences for baboon TLR4 were 5′-agctcttggtggaagctgaa-3′ (forward) and 5′-ctgagcagggtcttctccac-3′ (reverse), whereas for human TLR4 they were 5′-cctgtgcaatttgaccattg-3′ (forward) and 5′-tgccattgaaagcaactctg-3′ (reverse). All polymerase chain reactions (PCR) were performed with 3 μL RT reaction under the following conditions: 94°C for 5 min, followed by 40 cycles of 94°C for 45 s, 55°C for 45 s and elongation at 72°C for 45 s. The PCR products were analysed on a 2% agarose gel stained with ethidium bromide. Levels of the 18S ribosomal subfraction were measured using the 18S Universal kit (Ambion) as an internal control.
Plasmid transfection
Primary baboon endothelial cells (0.5 million cells grown in six-well plates) were transfected with plasmid DNA (pDUO-hMD-2/hTLR4) and vehicle plasmid (pDUO-mcs). Both plasmids were purchased from Invitrogen. The pDUO-hMD-2/hTLR4 plasmid contains human TLR4 and MD-2 sequences (http://www.invivogen.com). In the present study, 4 μg plasmid DNA was incubated with 12 μL TransFast (Promega, Madison, WI, USA) at a reagent : DNA ratio 2 : 1 for 15 min at room temperature in a total volume of 1 mL, based on the manufacturer’s instructions. We first removed the growth medium from the cells, added 1 mL TransFast Reagent/DNA mixture to each plate and immediately returned the cells to the incubator for 1 h. At the end of the incubation period, the cells were gently laid with 1 mL complete medium and incubated for a further 48 h. The transfected cells were cultured and selected in endothelial growth medium supplemented with 100 μg/mL blasticidin. The expression of TLR4 in stable transfected cells was determined by flow cytometry. To test whether the transfected cells were functional, they were harvested and treated with 1.0 μg/mL LPS for 4 h and the cell supernatants collected to quantify MCP-1 release using an ELISA (R&D Systems).
Statistical analysis
Data are expressed as the mean±SD. Independent Student’s t-test was used for between-group comparisons; ANOVA was used for multiple comparisons. Two-tailed P < 0.05 was regarded as significant.
RESULTS
Characteristics of TNF-α and LPS responses in HAEC and BAEC
In order to produce consistent results, we used BAEC at the 3rd or 4th passage and HAEC within 2 passages after purchase, because we have reported earlier that endothelial responses to TNF-α do not change within 4 passages.11 The seeding densities, culture media and conditions were kept constant throughout the entire experiment.
Previous data indicated that the time-course for TNF-α- and LPS-mediated cellular adhesion molecule expression was the same in HAEC and BAEC.1,2 Figure 1 shows cellular responses of E-selectin, ICAM-1, MCP-1 and IL-8 to TNF-α and LPS. As shown in Fig. 1a–d, increased expression of E-selectin and ICAM-1 did not differ between HAEC and BAEC in response to 10.0 ng/mL TNF-α; the results were confirmed by western blotting (Fig. 1e,f). Likewise, changes in cytokine MCP-1 and IL-8 release into the culture media from HAEC and BAEC (15.9- and 12.0-fold of basal levels, respectively) treated with 10.0 ng/mL TNF-α were similar (Fig. 1g,h). However, there was a significant difference between HAEC and BAEC when they were exposed to 1.0 μg/mL LPS. Lipopolysaccharide induced a 3.7-fold higher level of E-selectin expression in HAEC compared with BAEC after 4 h treatment and a 2.5-fold increase in ICAM-1 expression in HAEC after 24 h. In contrast, BAEC showed no response to LPS at either time point (Fig. 1e,f). Lipopolysaccharide treatment also induced significantly higher MCP-1 and IL-8 expression in HAEC than in BAEC (Fig. 1g,h). Taken together, these results indicate that BAEC and HAEC react similarly to TNF-α, but that BAEC are hyporesponsive to LPS.
Fig. 1.
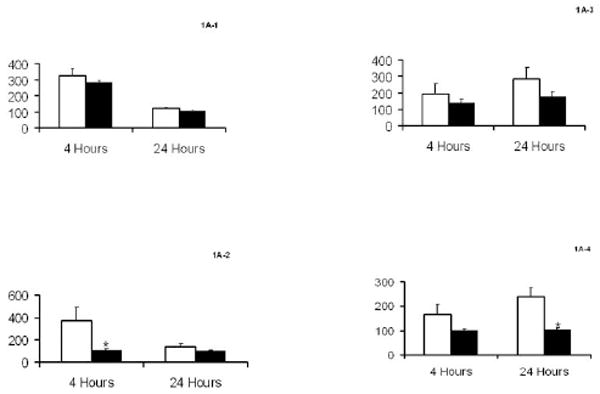
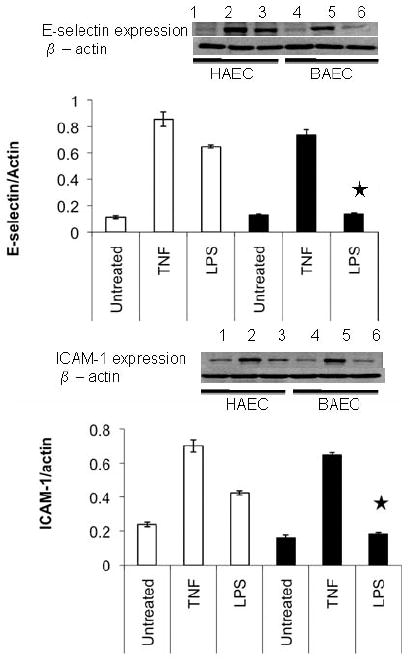
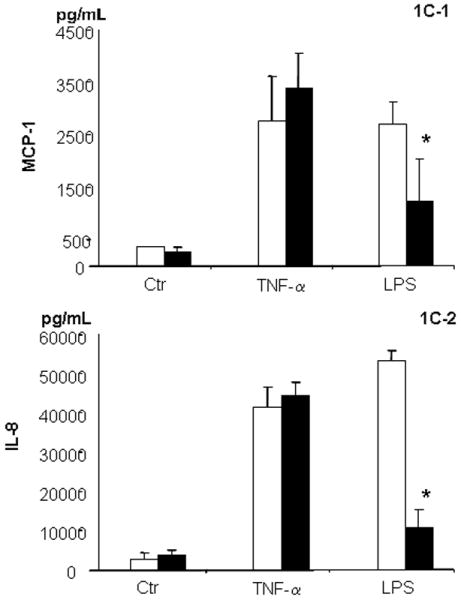
Characteristics of human and baboon endothelial cells (HAEC and BAEC, respectively) to tumour necrosis factor (TNF)-α and lipopolysaccharide (LPS) treatment. (a–d) Confluent HAEC (open bar) and BAEC (black bar) were incubated with 10.0 ng/mL TNF-α (a,c) and 1.0 μg/mL LPS (b,d) for 4 and 24 h under the same culture condition. (a,b) E-Selectin and (c,d) intercellular adhesion molecule-1 (ICAM-1) protein expression was determined by ELISA and results are expressed as ratios of the optical density of the treated group to that of the untreated group, which was taken as 100%. (e,f) Western blot of E-selectin and ICAM-1 expression in HAEC (lanes 1–3; open bar) and BAEC (lanes 4–6; black bar) after treatment with 10.0 ng/mL TNF-α (lanes 2 and 5) and 1.0 μg/mL LPS (lanes 3 and 6) for 4 and 24 h, respectively. Ratios of E-selectin/β-actin (e) and ICAM-1/β-actin (f) are also shown. (g) MCP-1 and (h) interleukin (IL)-8 releases in HAEC (open bar) and BAEC (black bar) after incubation with 10.0 ng/mL TNF-α and 1.0 μg/mL LPS for 24 h under the same culture conditions. The amount of MCP-1 and IL-8 protein in culture supernatants was determined by ELISA. Data are the mean±SD from three independent experiments in the same cells. *P < 0.05 compared with HAEC (independent Student’s t-test).
Expression profiles in HAEC and BAEC induced by LPS
We used a pathway-specific cDNA microarray to analyse gene expression profiles in response to TNF-α and LPS. Total RNA was isolated from HAEC and BAEC after 24 h treatment. After reverse transcription of mRNA and cDNA synthesis, samples were probed to a membrane that has 96 genes and four house keeping genes. Gene expression data were consistent with the ELISA expression data; that is, 10.0 ng/mL TNF-α induced expression of MCP-1 or chemokine C-C ligand 2, IL-8, vascular cell adhesion molecule-1 and ICAM-1 in both HAEC and BAEC. In contrast, LPS did not induce changes in expression in BAEC at either high (1.0 μg/mL) or low (0.01 μg/mL) concentrations.
Nuclear factor-κB signal transduction in HAEC and BAEC
Because both TNF-α- and LPS-induced endothelial response pathways are routed through activation of NF-κB signalling, we quantified protein expression of NF-κB subunits and transcription factor activation using ELISA-based TransAM assays after TNF-α and LPS treatment over 24 h compared with time-matched untreated controls (Fig. 2). In three independent experiments, no significant differences in activities of p52 and c-rel were observed between HAEC and BAEC (Fig. 2c,d). Although p65 was activated after 1 and 4 h treatment with TNF-α in both HAEC and BAEC, the time of the peak differed. Low p50 activation was consistently observed only in BAEC over the entire time-course of the study (Fig. 2a). When we compared NF-κB activation using TNF-α/LPS ratios in all groups, we found that HAEC had a nearly equal responsiveness to both agents. However, BAEC had a significantly stronger response to TNF-α than LPS. This differential response is especially evident in BAEC in terms of p50 activation after 1 and 4 h LPS treatment (Fig. 2a) and of p65 activation after 1 h LPS treatment (Fig. 2b). These results suggest that LPS may not be able to completely activate the full NF-κB signalling pathway in BAEC. However, the NF-κB signalling pathway in BAEC is intact and functional because it is fully responsive to TNF-α. Although LPS did activate certain components in the NF-κB cascade, it was not sufficient to make the pathway functional. We suggest that the resistance of the BAEC to LPS activation is likely located at the TLR4 complex, upstream of the NF-κB site.
Fig. 2.
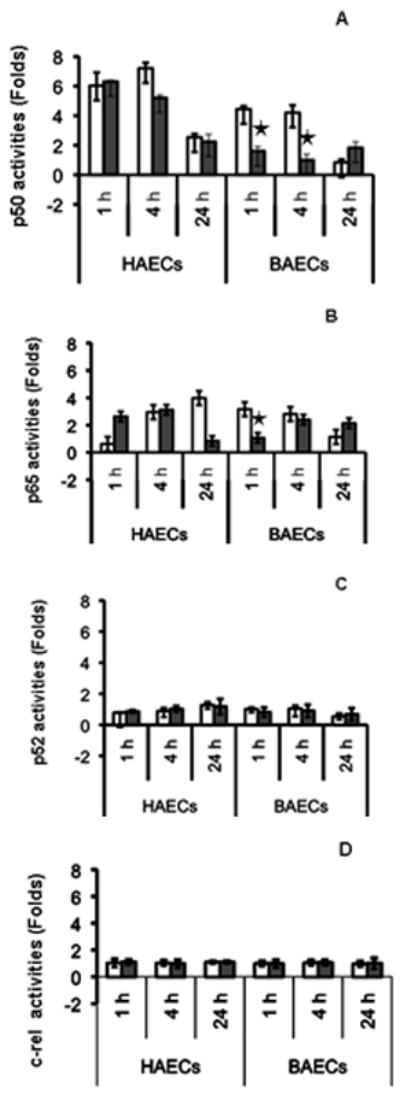
Time course of nuclear factor (NF)-κB activation in human and baboon endothelial cells (HAEC and BAEC, respectively) after tumour necrosis factor (TNF)-α (□) and lipopolysaccharide (LPS; ▪) treatment. Nuclear proteins (10 μg) from treated groups and time-matched untreated controls were subjected to transcription factor activation assays. Representative results from three independent experiments for NF-κB subunits p50 (a), p65 (b), p52 (c) and c-rel (d) are shown. Data are the mean±SD. *P < 0.05, by independent Student t-test (n = 3) of HAEC and BAEC.
Cell surface TLR4 expression on HAEC and BAEC
To determine the role of TLR4 signalling in differential responses in endothelial cells, we first characterized the basal level of expression on the cell surface of both types of cells using flow cytometry. Figure 3a shows a histogram of a positive cell line that is known to express TLR4. Expression of TLR4 was detectable, but at low levels, on the cell surface of both HAEC and BAEC at baseline. The MFI in HAEC (37.96 ± 3.84; Fig. 3b) was slightly higher than that in BAEC (28.34 ± 0.53; Fig. 3c; P = 0.06; n = 3). Next, we investigated the effects of TNF-α and LPS on TLR4 expression. Compared with untreated controls, treatment with 10 ng/mL TNF-α or 1.0 μg/mL LPS for 4 h stimulated a 1.41 ± 0.06-fold (P = 0.02; n = 3) and 1.62 ± 0.14-fold (P = 0.03; n = 3) increase, respectively, in TLR4 expression in HAEC, as measured by MFI (Fig. 3d). Although TNF-α upregulated TLR4 expression in BAEC (1.75 ± 0.34-fold increase; P = 0.01; n = 3), LPS treatment did not change TLR4 expression in BAEC (0.99 ± 0.32-fold; P = 0.96; n = 3; Fig. 3e).
Fig. 3.
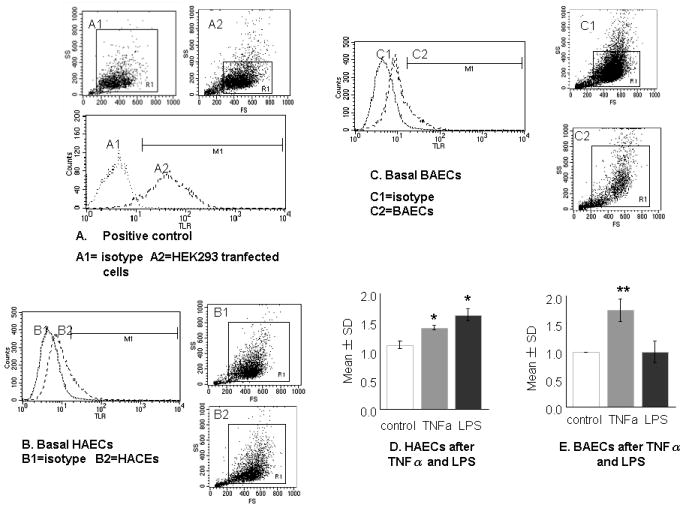
Toll-like receptor (TLR) 4 expressions in human and baboon endothelial cells (HAEC and BAEC, respectively). Cells were grown in six-well plates and detached by 0.05% trypsin. After 1 h recovery at 37°C, they were Fc blocked and stained either with isotype control (dotted line) or with anti-TLR4 (dashed line) conjugated with PE. (a) Histograms of the positive cell line HEK293 (A2) transfected with human pDUO-hMD-2/hTLR4 and expressing high levels of TLR4 and the isotype control (A1). (b) Basal expression of TLR4 in HAEC (B2) and the isotype control (B1). (c) Basal expression of TLR4 in BAEC (C2) and the isotype control (C1). (d,e) Responsiveness of HAEC and BAEC to tumour necrosis factor (TNF)-α and lipopolysaccharide (LPS) as illustrated in (a–c), using fold changes compared with corresponding controls Assays were performed in duplicate and were representative of at least three independent experiments. Data are the mean±SD. *P < 0.05, **P < 0.01 compared with control (independent Student’s t-test).
Differential expression of TLR4 on the cell surface between HAEC and BAEC was also found on a microarray hot-map. Untreated HAEC have a higher intensity of TLR4 than do BAEC. The lack of response of TLR4 expression in BAEC to LPS stimulation was further evidenced by mRNA levels measured by RT-PCR. It should be noted that baseline TLR4 expression did not differ between HAEC and BAEC.
Expression profile of the LPS-mediated signalling pathway in HAEC and BAEC
To further confirm the differential effects of LPS on HAEC and BAEC, we compared mRNA expression profiles of key components for TLR4-mediated NF-κB activation after 1.0 μg/mL LPS treatment for 24 h in HAEC and BAEC based on NF-κB microarray data. We calculated fold changes (treated group/untreated control) and compared the responses in HAEC and BAEC (Table 1). The key components of this pathway, namely TNF receptor-associated factor 2 (TRAF-2), TRADD, nuclear factor of kappa in B-cells inhibitor, α (NFKBIA) and nuclear factor of kappa in B-cells inhibitor, β (NFKBIB) were 5.6-, 1.4-, 6.7-and 1.8-fold higher, respectively, in HAEC than in BAEC. In contrast, other components, namely IL-1 receptor-associated kinase (IRAK) 2 and nuclear factor of kappa in B-cells 2 (NFKB2), were upregulated by LPS in BAEC.
Table 1.
mRNA expression profiles of key components in nuclear factor-κB signalling in endothelial cells treated with 1.0 μg/mL lipopolysaccharide for 24 h
| Fold changes compared with untreated control | Human/baboon ratios | ||
|---|---|---|---|
| Human EC | Baboon EC | ||
| IRAK1 | 0.178 | 0.780 | 0.228 |
| IRAK2 | 0.673 | 2.655 | 0.253 |
| TRAF1 | 0 | 0.047 | 0 |
| TRAF2 | 6.867 | 1.224 | 5.610 |
| TRAF6 | 0 | 0.288 | 0 |
| TRADD | 0.364 | 0.259 | 1.405 |
| NFKB2 | 0.260 | 0.891 | 0.292 |
| NFKBIA | 6.492 | 0.960 | 6.763 |
| NFKBIB | 2.676 | 1.438 | 1.861 |
| V-jun (JUN) | 0.017 | 1.085 | 0.016 |
| V-raf-1 (RAF1) | 0.017 | 0.881 | 0.019 |
| V-rel (REL) | 2.187 | 1.998 | 1.095 |
| IL6 | 2.619 | 1.855 | 1.412 |
| IL8 | 0.842 | 0.832 | 1.012 |
| ICAM1 | 3.281 | 0.003 | 1093.6 |
IRAK, interleukin-1 receptor-associated kinase; TRAF, tumour necrosis factor receptor-associated factor; TRADD, NFKB2, nuclear factor of kappa in B-cells 2; NFKBIA, NFKBIB, nuclear factor of kappa in B-cells inhibitor, α and β, respectively; ICAM-1, intercellular adhesion molecule-1; IL, interleukin; EC, endothelial cells.
Responsiveness to LPS in BAEC with overexpressed human TLR4
Having established the link between BAEC hyporesponsiveness to LPS and TLR4 expression, we next investigated whether transfecting human TLR4 to BAEC would render them responsive to LPS. Because only stably transfected cells are able to grow in medium supplemented with 100 μg/mL blasticidin, we selected positively transfected cells in the subculture and measured cell surface TLR4 expression using flow cytometry. Vehicle DNA vector (pDUO-mcs) did not change TLR4 levels in all six BAEC tested. However, BAEC transfected with pDUO-hMD-2/hTLR4 showed increased TLR4 expression. We then treated the BAEC with 1.0 μg/mL LPS for 4 h and measured MCP-1 concentrations. The BAEC with overexpressed human TLR4 responded to LPS stimulation with significantly increased MCP-1 release compared with BAEC transfected with the vehicle vectors only (391 ± 146 vs 36.8 ± 8.8 pg/mL, respectively; n = 5; P < 0.001).
Toll-like receptor 4 expression and responsiveness to LPS and TNF-α in PBMC
To assess whether the lack of response to LPS in baboons is cell type specific, we measured TLR4 expression in PBMC. The expression of TLR4, as measured by flow cytometry, was similar at baseline between human and baboon PBMC (Fig. 4c,d). The responses of human and baboon PBMC to LPS, as measured by a representative cytokine (IL-8), were also similar (Fig. 4f) and exhibited the same pattern as responses to TNF-α (Fig. 4e).
Fig. 4.
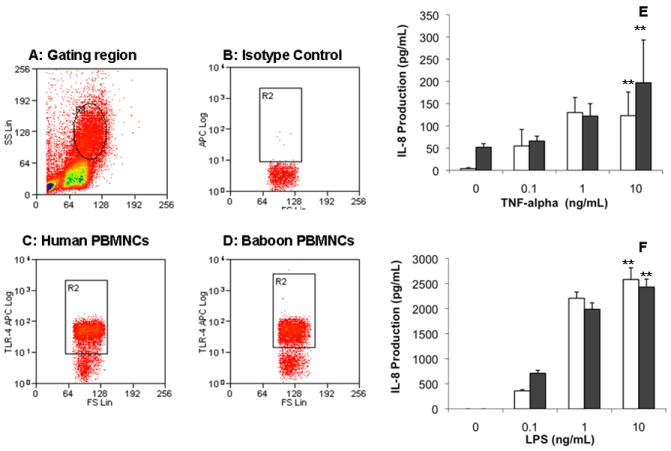
(a–d) Toll-like receptor (TLR) 4 expression in human and baboon peripheral blood mononuclear cells (PBMC) measured by flow cytometry. The PBMC were freshly isolated from human and baboon blood and further incubated with anti-TLR4 (c,d) or isotype control (b) gating at mononuclear cells (a). There was no difference in the number of cells that stained positive for TLR4 between human and baboon. (e,f) Concentration-dependent responses to TNF-α and LPS in human and baboon PBMC. Two million human PBMC (open bar) and baboon PBMC (black bar) in 2 mL medium were incubated with indicated concentrations of (e) tumour necrosis factor (TNF)-α and (f) lipopolysaccharide (LPS) for 4 h under the same culture conditions. Interleukin-8 production in culture supernatants was determined by ELISA. Responses to LPS were similar in baboon and human PBMC. The results are representatives of three independent experiments. Data are the mean±SD. **P < 0.01 for a concentration-dependent relationship in both baboon and human PBMC (one-way ANOVA).
DISCUSSION
Pro-inflammatory stimuli, such as TNF-α and LPS, evoke powerful cellular responses in a variety of mammalian cell types. These agents can activate cells through their respective receptors, activating different signal transduction cascades that eventually release NF-κB dimers to translocate to the nucleus for transcriptional activation. Although TNF-α can induce similar cellular responses in most primates, LPS-induced activation varies substantially.1,2 In vivo administration of LPS resulted in severe vascular syndrome in chimpanzees and rhesus monkeys,3 but baboons are highly resistant to LPS. In the present study, we have shown that baboon endothelial cells are less responsive to LPS, which could be responsible for the lack of a vascular response to LPS in baboons. This lack of responses appeared to be cell type specific because baboon PBMC responded similarly to human PBMC to LPS. In addition, the baseline expression of TLR4 was similar between baboon and human PBMC.
To understand the molecular mechanisms underlying this phenomenon, we investigated the differential responses of LPS signalling pathway components in both humans and baboons. Tumour necrosis factor-α and LPS are known to induce an inflammatory response via the activation of NF-κB. The p50/p65 heterodimers and p50 homodimers are the most common dimers responsible for NF-κB transcriptional activity. The results of the present study clearly show that the NF-κB machinery is intact because TNF-α induced NF-κB activation similarly in HAEC and BAEC. Although LPS activates the NF-κB pathway in human cells, it fails to do so in baboon endothelial cells. It becomes clear that molecules upstream of NF-κB may be responsible for the LPS resistance in baboon endothelial cells. Previous studies in our laboratory have shown that baboon endothelial cells are able to respond to IL-1β,12 which suggests that the intracellular signalling via the IL-1 receptor to NF-κB activation through which LPS transmits its signal is intact in BAEC.
The present experiments show that BAEC have a very low basal expression of TLR4, which is similar to basal expression in human cells. In contrast, expression of TLR4 was not upregulated in baboon endothelial cells when exposed to LPS as was observed in human endothelial cells. The present study suggests that baboon vascular endothelial cells are naturally resistant to some of the pro-inflammatory effect of LPS. This endothelial-specific resistance to LPS-induced inflammatory responses could have significant biological implications to infection-associated atherogenesis. Recent studies suggest that sequence variation between baboons and humans at the carboxy-terminal end of the TLR4 cytoplasmic domain may be responsible for the lack of downstream activation when baboon cells are exposed to LPS.13 The above observation may provide a cellular basis for the genetic variation. Further studies are needed to clarify whether these genetic variations can be used to abolish the LPS responsiveness.
In summary, the findings of the present study indicate that an altered TLR4 system may be responsible for the resistance to LPS in baboon endothelial cells. Given the importance of TLR4 in human immune responses and vascular diseases, the natural resistance of baboon endothelial cells to LPS/TLR4-initiated inflammation could make the baboon a valuable animal model in which to study how inflammation affects atherogenesis.
References
- 1.Shi Q, Vandeberg JF, Jett C, et al. Arterial endothelial dysfunction in baboons fed a high-cholesterol, high-fat diet. Am J Clin Nutr. 2005;82:751–9. doi: 10.1093/ajcn/82.4.751. [DOI] [PMC free article] [PubMed] [Google Scholar]
- 2.Shi Q, Aida K, Vandeberg JL, Wang XL. Passage-dependent changes in baboon endothelial cells: Relevance to in vitro aging. DNA Cell Biol. 2004;23:502–9. doi: 10.1089/1044549041562294. [DOI] [PMC free article] [PubMed] [Google Scholar]
- 3.Redl H, Bahrami S, Schlag G, Traber DL. Clinical detection of LPS and animal models of endotoxemia. Immunobiology. 1993;187:330–45. doi: 10.1016/S0171-2985(11)80348-7. [DOI] [PubMed] [Google Scholar]
- 4.Dauphinee SM, Karsan A. Lipopolysaccharide signaling in endothelial cells. Lab Invest. 2006;86:9–22. doi: 10.1038/labinvest.3700366. [DOI] [PubMed] [Google Scholar]
- 5.Huang B, Chen H, Fan M. Inhibition of TLR4 signaling pathway: Molecular treatment strategy of periodontitis-associated atherosclerosis. Med Hypotheses. 2008;70:614–17. doi: 10.1016/j.mehy.2007.06.015. [DOI] [PubMed] [Google Scholar]
- 6.Lin MI, Sessa WC. Vascular endothelial growth factor signaling to endothelial nitric oxide synthase: More than a FLeeTing moment. Circ Res. 2006;99:666–8. doi: 10.1161/01.RES.0000245430.24075.a4. [DOI] [PubMed] [Google Scholar]
- 7.Stoll LL, Denning GM, Weintraub NL. Potential role of endotoxin as a proinflammatory mediator of atherosclerosis. Arterioscler Thromb Vasc Biol. 2004;24:2227–36. doi: 10.1161/01.ATV.0000147534.69062.dc. [DOI] [PubMed] [Google Scholar]
- 8.Stoll LL, Denning GM, Li WG, et al. Regulation of endotoxin-induced proinflammatory activation in human coronary artery cells: Expression of functional membrane-bound CD14 by human coronary artery smooth muscle cells. J Immunol. 2004;173:1336–43. doi: 10.4049/jimmunol.173.2.1336. [DOI] [PMC free article] [PubMed] [Google Scholar]
- 9.Suliman HB, Welty-Wolf KE, Carraway MS, Schwartz DA, Hollingsworth JW, Piantadosi CA. Toll-like receptor 4 mediates mitochondrial DNA damage and biogenic responses after heat-inactivated E coli. FASEB J. 2005;19:1531–3. doi: 10.1096/fj.04-3500fje. [DOI] [PubMed] [Google Scholar]
- 10.Fitzgerald KA, Chen ZJ. Sorting out Toll signals. Cell. 2006;125:834–6. doi: 10.1016/j.cell.2006.05.014. [DOI] [PubMed] [Google Scholar]
- 11.Li H, Sun B. Toll-like receptor 4 in atherosclerosis. J Cell Mol Med. 2007;11:88–95. doi: 10.1111/j.1582-4934.2007.00011.x. [DOI] [PMC free article] [PubMed] [Google Scholar]
- 12.Shi Q, Wang J, Wang XL, VandeBerg JL. Comparative analysis of vascular endothelial cell activation by TNF-alpha and LPS in humans and baboons. Cell Biochem Biophys. 2004;40:289–304. doi: 10.1385/CBB:40:3:289. [DOI] [PubMed] [Google Scholar]
- 13.Smirnova I, Poltorak A, Chan EK, McBride C, Beutler B. Phylogenetic variation and polymorphism at the toll-like receptor 4 locus (TLR4) Genome Biol. 2000;1 doi: 10.1186/gb-2000-1-1-research002. RESEARCH002. [DOI] [PMC free article] [PubMed] [Google Scholar]