

Abstract
Intercellular glial Ca2+ waves constitute a signaling pathway between glial cells. Artificial stimuli have previously been used to evoke these waves, and their physiological significance has been questioned. We report here that Ca2+ waves occur spontaneously in rat retinal glial cells, both in the isolated retina and in vivo. These spontaneous waves are propagated by ATP release. In the isolated retina, suramin (P2 receptor antagonist) reduces the frequency of spontaneous wave generation by 53%, and apyrase (ATP-hydrolyzing enzyme) reduces frequency by 95–100%. Luciferin-luciferase chemiluminescence reveals waves of ATP matching the spontaneous Ca2+ waves, indicating that ATP release occurs as spontaneous Ca2+ waves are generated. Wave generation also depends on age. Spontaneous wave frequency rises from 0.27 to 1.0 per minute per mm2, as rats age from 20 to 120 d. The sensitivity of glia to ATP does not increase with age, but the ATP released by evoked waves is 31% greater in 120-d-old than in 20-d-old rats, suggesting that increased ATP release in older animals could account for the higher frequency of wave generation. Simultaneous imaging of glial Ca2+ and arterioles in the isolated retina demonstrates that spontaneous waves alter vessel diameter, implying that spontaneous waves may have a significant impact on retinal physiology. Spontaneous intercellular glial Ca2+ waves also occur in the retina in vivo, with frequency, speed, and diameter similar to the isolated retina. Increased spontaneous wave occurrence with age suggests that wave generation may be related to retinal pathology.
Introduction
Glial cells exhibit intracellular Ca2+ elevations in response to signals from neurons and other glia. Activation of metabotropic receptors on glia by neurotransmitters evokes release of Ca2+ from internal stores into the cytosol (Fellin and Carmignoto, 2004). This Ca2+ elevation can lead to release of glutamate, ATP and d-serine, altering synaptic efficacy (Araque et al., 1998; Kang et al., 1998; Yang et al., 2003; Pascual et al., 2005) and neuronal excitability (Parpura et al., 1994; Newman, 2003; Fellin et al., 2004). Glial Ca2+ elevations also trigger release of arachidonic acid metabolites that regulate blood vessel diameter (Zonta et al., 2003; Mulligan and MacVicar, 2004; Metea and Newman, 2006; Gordon et al., 2008).
Glia also exhibit spontaneous increases in intracellular Ca2+. Spontaneous Ca2+ transients in individual astrocytes were first reported in vitro (Cornell-Bell et al., 1990) and are also observed in situ (Aguado et al., 2002; Nett et al., 2002), where they can induce neuronal NMDAR currents (Parri et al., 2001). Spontaneous Ca2+ transients also occur in vivo and may regulate neurite growth and cause dilation of blood vessels (Takano et al., 2006; Kanemaru et al., 2007). These spontaneous transients remain confined to individual cells, although they may be spatially coordinated (Hirase et al., 2004).
When triggered by an external stimulus, calcium elevations can travel between glial cells in the form of propagated waves (Scemes and Giaume, 2006), coordinating glial activity over tens or hundreds of micrometers. These intercellular glial Ca2+ waves can be evoked by electrical, chemical, and mechanical stimuli and have been observed in astrocyte cultures (Cornell-Bell et al., 1990), the isolated retina (Newman and Zahs, 1997), brain slices (Kang et al., 1998; Schipke et al., 2002; Haas et al., 2006), and in vivo in the cortex (Tian et al., 2006; Ding et al., 2007). Depending on the preparation, evoked waves may propagate by release of ATP into the extracellular space, by diffusion of an intracellular messenger through the gap junctions between glial cells, or both (Scemes and Giaume, 2006). Evoked waves can modulate neuronal activity (Nedergaard, 1994; Newman and Zahs, 1998) and blood flow (Mulligan and MacVicar, 2004; Metea and Newman, 2006).
Recently, intercellular glial Ca2+ waves have been observed to occur spontaneously in vivo (Hoogland et al., 2009; Kuchibhotla et al., 2009), answering the important question of whether these waves occur under physiological conditions in the absence of artificial stimulation. We report here that spontaneous glial Ca2+ waves also occur in the retina, both in the isolated retina and in vivo. Like evoked waves, spontaneous waves in the retina are propagated by the release of ATP and can modulate blood vessel diameter. We also find that spontaneous waves increase in frequency as animals age. The results demonstrate that glia can independently regulate blood flow and suggest that glial Ca2+ waves may be involved in the aging process.
Materials and Methods
Animals.
Male Long–Evans rats were used in all experiments. Rats were 20–100-d-old on arrival from the supplier (Harlan Laboratories). Some were maintained for as long as an additional 9 months in the University of Minnesota Research Animal Resources facilities. Rats were killed by cutting the diaphragm following deep isoflurane anesthesia. The animals used in this study were treated in accordance with the guidelines of the Institutional Animal Care and Use Committee of the University of Minnesota.
Isolated retina preparation.
The isolated retina preparation has been described previously (Newman, 2001). Briefly, retinas were dissected from the hemisected eyeball and the vitreous removed. Retinas were cut into two pieces and laid flat in a superfusion chamber with the vitreal surface up. Isolated retinas were superfused with bicarbonate-buffered Ringer's at 2–3 ml/min at 22−23°C. All experiments except those described in Figure 7 were performed in the isolated retina.
Figure 7.
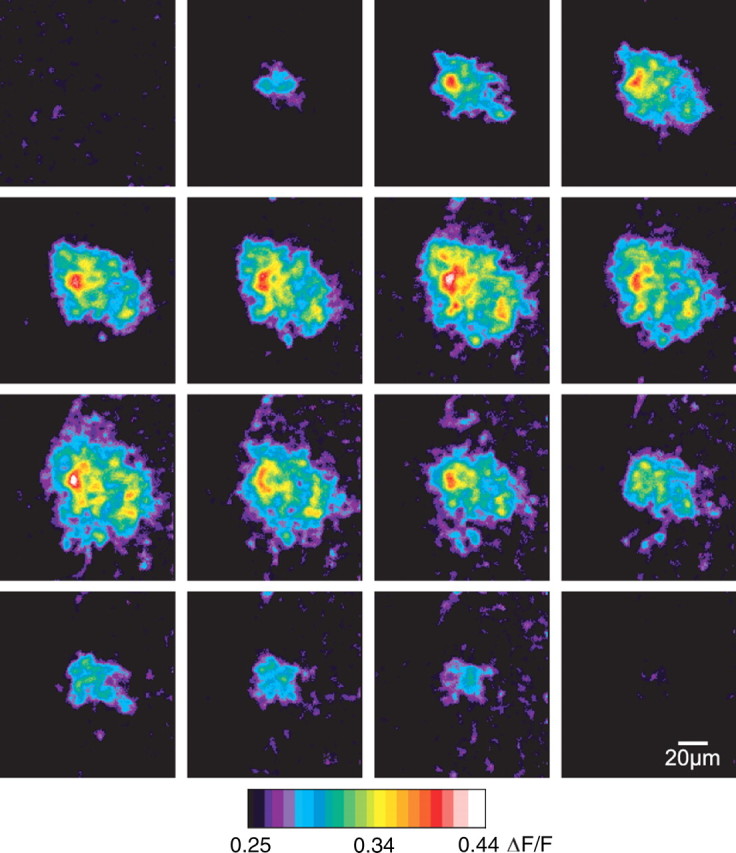
Spontaneous Ca2+ waves occur in the retina in vivo. These pseudocolor ΔF/F ratio images show a time series (left to right, top to bottom) of a single spontaneous Ca2+ wave in vivo. Each frame represents 1 s. The focal plane is a few micrometers beneath the surface of the retina, in the ganglion cell layer, where the brightest Müller cell Ca2+ signals are observed.
Calcium and ATP imaging in the isolated retina.
Our Ca2+ and ATP imaging methods have been described previously (Newman, 2001). For confocal Ca2+ imaging, retinas were incubated in the Ca2+ indicator dye Fluo-4 AM (25 μg/ml) and pluronic acid (1.75 mg/ml) for 25 min before imaging. Fluo-4 AM loaded selectively into glial cells and not neurons, consistent with previous reports (Porter and McCarthy, 1996; Stosiek et al., 2003; Hirase et al., 2004). Fluorescence images were captured with a confocal scanner (Odyssey, Noran), with images averaged for one second.
The luciferin-luciferase chemiluminescence assay was used to image ATP. Luciferase catalyzes the reaction of luciferin with ATP to emit light, allowing visualization of ATP release into the extracellular space. Superfusion was stopped and a solution of luciferin and luciferase gently pipetted into the chamber yielding final concentrations of 0.68 mg/ml luciferin and 0.61 mg/ml luciferase when imaging evoked ATP waves. Luciferase concentration was reduced by two thirds when imaging spontaneous waves because we found that luciferase itself acted as an inhibitor of spontaneous waves, presumably through its extracellular ATPase activity. The chemiluminescence was captured with a KS-1381 image intensifier (VideoScope) coupled to a CoolSnap ES camera (Photometrics) using a 1 s integration time with 2 × 2 pixel binning. To maintain pH and oxygenation during ATP imaging, a collar was fitted around the objective and superfusion chamber and 95% O2, 5% CO2 gently blown over the surface of the chamber. All image acquisition was in MetaMorph (Molecular Devices). Luciferin-luciferase chemiluminescence images were calibrated as previously described (Newman, 2001) to calculate absolute ATP concentration at the retinal surface.
Calcium wave imaging and analysis.
A 10× water-immersion objective (Olympus) was used to count waves in the isolated retina, covering an area of ∼0.5 mm2. Waves were tallied by the number of waves starting in each frame. Waves were distinguished from other time-varying fluorescence signals by their pattern of concentric expansion and mesh-like appearance (ganglion cells, which show little to no fluorescence signal, form the dark spaces in the mesh). A custom image analysis program was written to automatically detect and tally waves.
To simultaneously monitor blood vessel diameter and glial Ca2+, blood vessels were filled with dextran-conjugated fluorescein (2,000,000 MW; excites and emits at wavelengths similar to Fluo-4) by jugular vein injection before animal death to visualize the vessel lumen. In these experiments, retinas were incubated and superfused with 100 nm U-46619 (an analog of thromboxane) to increase basal vessel tone (Metea and Newman, 2006).
In apyrase experiments, superfusion was stopped and apyrase gently pipetted into the recording chamber. In control experiments for apyrase, superfusion was likewise stopped and an equal volume of Ringer's pipetted into the chamber. A gas collar was used as described for luciferase experiments.
High light exposure.
In the animal care facilities, rats were normally exposed to ∼30 lux ambient light. (Light measurements were taken in the darkest part of cages where the rats huddled.) For high light exposure experiments, rats were housed in ambient lighting of 1000 lux, beginning at 20 d of age. Rats were exposed to these high light conditions for 1–4 months. Both normal and high light exposure rats were on a 12 h light/12 h dark cycle.
Mechanical stimulus.
To artificially evoke Ca2+ waves, a glass pipette was positioned with its tip touching an astrocyte. The pipette, under control of a piezoelectric actuator (PZ-150 M, Burleigh), was advanced and retracted 3–4 μm in 100 ms. This mechanical step always triggered a large Ca2+ wave. Waves could be evoked repeatedly at a single location following a refractory period of 1–2 min, demonstrating that the mechanical stimulus did not injure the stimulated astrocyte.
Open-globe in vivo preparation.
Rats were anesthetized by IP injection of urethane (1.3 g/kg initially, plus increments of 0.2 g/kg as needed to reach deep anesthesia). Core body temperature was monitored and maintained at 37 degrees and hydration maintained by subcutaneous injection of saline. Animals were placed in a modified stereotaxic holder with a three-point head restraint. The right eye was secured to a metal ring by eight sutures passing through the connective tissue surrounding the globe. The cornea was removed by making an “X” cut with micro iris scissors and then cutting around the circumference of the cornea. The lens was removed by suction applied through a hypodermic needle after the anterior lens capsule was cut around its circumference. The posterior lens capsule was removed by tearing with forceps and cutting with iris scissors. The vitreous humor was removed by tearing with forceps and suction applied through the tip of a Pipetteman.
Glial cells were labeled with the Ca2+ indicator dye Oregon Green 488 BAPTA-1 (OGB-1). OGB-1 rather than Fluo-4 was used to label glial cells in vivo due to its greater Ca2+ affinity, which yielded images with a higher signal-to-noise ratio. The OGB-1 solution (140 μg/ml Oregon Green, 7 mg/ml pluronic acid and 8 μm eserine in saline) was pipetted into the open globe following removal of the vitreous humor. Eserine (an esterase inhibitor) enhanced OGB-1 labeling of glial cells. After a 70 min incubation period, the open globe was rinsed with saline and then filled with a viscous saline solution. The stereotaxic holder and rat were fixed to a movable stage of an upright confocal microscope (Swept Field Confocal, Prairie Technologies) with the open globe facing upward. The retina was viewed through a 20× long working distance water-immersion objective (Olympus). To count spontaneous waves, the best-labeled areas of the retina were imaged for 25–110 min. Fluorescence signals were counted as waves only if (1) their shape was approximately circular, (2) they expanded concentrically over at least two frames, and (3) their peak diameter was between 30 and 100 μm.
Solutions and drugs.
Bicarbonate-buffered Ringer's solution used for isolated retina experiments contained (in mm): 111 NaCl, 3 KCl, 2 CaCl2, 1 MgSO4, 0.5 NaH2PO4, 15 dextrose, 32 NaHCO3. The solution was bubbled with 95% O2, 5% CO2. The saline solution used for in vivo experiments contained (mm): 132.5 NaCl, 3 KCl, 2 CaCl2, 1 MgSO4, 0.5 NaH2PO4, 10 HEPES; pH 7.4. Viscous saline was made by addition of hyaluronic acid, Na salt (15 mg/ml) to the saline solution. All reagents were purchased from Sigma except U-46619 (Cayman), TTX (Alomone Labs), NMDA, and DL-AP7 (Tocris Bioscience), and Fluo-4, OGB-1 and pluronic acid (Invitrogen).
Statistics.
Numerical values are given as mean ± SEM, and error bars in graphs represent SEM. The single-tailed Student's t test was used when comparing the means of two groups. ANOVA on a linear regression model was used when comparing the slope of the linear model to zero.
Results
Two types of macroglial cells are present in the mammalian retina: astrocytes and Müller cells. Astrocyte somata lie on the vitreal surface of the retina and extend processes that contact blood vessels in the innermost vascular layer. Müller cells are radial glia whose somata lie in the inner nuclear layer. Müller cell processes span the entire thickness of the retina and make extensive contacts with blood vessels and synapses (Newman and Reichenbach, 1996). Müller cell endfeet line the vitreal surface of the retina. Astrocytes are coupled to one another and to Müller cells by gap junctions (Zahs and Newman, 1997). Mechanical, electrical, or chemical stimulation of the inner retina evokes waves of Ca2+ elevation that propagate between both types of glial cells (Newman and Zahs, 1997; Newman, 2001).
Spontaneous glial Ca2+ waves occur in the retina
Glial Ca2+ was monitored with confocal microscopy at the inner surface of the isolated retina, where Ca2+ signals were imaged in Müller cell endfeet and astrocyte somata and processes. Glia exhibited spontaneous (i.e., unstimulated) waves of Ca2+ elevation that propagated between cells (Fig. 1A; supplemental Movie S1, available at www.jneurosci.org as supplemental material). The waves followed a pattern of concentric expansion similar to evoked waves, expanding for 4–8 s from a central point of initiation and then contracting over the next 5–10 s.
Figure 1.

Spontaneous intercellular glial Ca2+ waves in the isolated retina begin in and propagate through Müller cells. A, Spontaneous waves are initiated from multiple points on the retina. This pseudocolor ratio image collapses 60 s of video by a maximum ΔF/F projection. Fifteen spontaneous waves are generated during the 60 s period. B–D, A single Ca2+ wave shown at higher magnification. Like all waves we observed, this wave was initiated in and propagated through Müller cells but not astrocytes. B, Calcium fluorescence image before the wave was initiated (average of 5 frames). Regions 1–4 are Müller cells participating in the wave. The red region is an astrocyte. C, The brightness increase (ΔF/F) in each region plotted over time. Although the wave propagates across the soma of the astrocyte, [Ca2+]i did not rise in the cell. D, A maximum ΔF/F projection of the frames during the wave (same field of view as B), revealing cells in which there is a [Ca2+]i increase.
Spontaneous Ca2+ waves propagated exclusively through Müller cells and were not observed to propagate into astrocytes. In 15 waves recorded at high magnification, the waves were always initiated in Müller cells and propagated past astrocytes without a Ca2+ elevation occurring in the astrocyte (n = 8 waves) (Fig. 1B–D). However, we cannot rule out the possibility that astrocytes occasionally also experience Ca2+ increases. Waves propagated at 24.3 ± 1.7 μm/s and reached a maximal diameter of 68.4 ± 2.2 μm (n = 18 waves from 4 animals).
Spontaneous waves increase with age
The frequency of spontaneous wave generation was dependent on the age of the animal (Fig. 2A). The frequency equaled 1.0 per minute per mm2 in 120-d-old animals, 3.8 times higher than the 0.27 per minute per mm2 value in 20-d-old animals. These measurements of wave frequency were made after the retina had been in the superfusion chamber for 20–70 min.
Figure 2.

The frequency of spontaneous Ca2+ wave generation increases with age. A, The average frequency of spontaneous waves (counted from 20 to 70 min after the start of imaging) in animals of different ages. The frequency increases with age (p < 0.05). B, The fraction of animals at each age that exhibited a high initial frequency of waves (defined as 3 or more waves occurring within the first 6 min of imaging). Numbers above the bars indicate the total number of animals in each bin. C, The highest wave rate observed in a rat increased with the rat's age (p < 0.005; R2 = 0.33). Each point represents one animal. D, Exposure to high light levels for 1–4 months did not increase the fraction of rats displaying a high initial wave frequency.
Some retinal areas from older animals exhibited a very high frequency of spontaneous wave generation immediately after the retinas were placed in the superfusion chamber. This high frequency of wave generation decayed within ∼15 min (see Fig. 4A). A stable baseline rate of wave generation was reached after 15 min and was similar to the rate seen in areas of the retina where a high frequency of wave generation did not occur. The probability of retinas displaying an initial high rate of wave generation increased with the age of the animal (Fig. 2B). The maximal wave rate, measured in the first minute of recording, also increased as a function of the animal's age (Fig. 2C). In retinas from 12-month-old animals, the rate was 56 ± 24 waves per minute per mm2.
Figure 4.

Spontaneous Ca2+ wave generation is dependent on P2 receptors and extracellular ATP. A, Suramin (100 μm; P2R antagonist) decreases the frequency of spontaneous waves. The difference between control (ctrl) and suramin values is superimposed on the decay of the high initial rate of wave generation. Spontaneous Ca2+ wave counts are binned in 1 min intervals, and each trial is normalized to the wave count during the first minute of the trial. B, Suramin (100 μm) and apyrase (100 U/ml; ATP-degrading enzyme), but not TTX (200 nm), DL-AP7 (100 μm; NMDAR antagonist), carbenoxolone (100 μm; gap junction blocker), or a mixture of adenosine receptor antagonists (100 nm DPCPX, 1 μm MRS 1191, 1 μm MRS 1706, 1 μm ZM 241385) reduced the frequency of spontaneous wave generation. Spontaneous wave counts were averaged from 3 to 6 min after the start of imaging and were normalized to wave counts during the first minute. Drugs were added 1 min after the start of imaging. *p < 0.05.
Because the rate of glial Ca2+ wave generation increased with age, we speculated that wave occurrence could be a consequence of cumulative damage, perhaps caused by exposure to light. To test this, we exposed rats to 1000 lux ambient light (∼30 times normal light levels) for a period of 1–4 months, hypothesizing that this would hasten the development of waves. We found no effect of light treatment on the incidence of waves, however, indicating that the generation of spontaneous Ca2+ waves was not due to retinal damage caused by light exposure (Fig. 2D). In fact, there was a trend toward reduced wave generation in light-exposed animals, but the interaction between light exposure and age was not significant by two-way ANOVA (p = 0.07).
Spontaneous waves are propagated by release of ATP
Artificially evoked glial Ca2+ waves in the retina are propagated from cell to cell through two mechanisms. Astrocyte-to-astrocyte propagation is mediated by diffusion of a small molecule (probably IP3; Venance et al., 1997) through gap junctions, while astrocyte-to-Müller cell and Müller cell-to-Müller cell propagation are mediated by release of ATP and its action on P2 purinergic receptors (Newman, 2001).
We asked whether the propagation of spontaneous waves through Müller cells was also mediated by ATP release. The luciferin-luciferase ATP chemiluminescence assay was used to monitor ATP release into the extracellular space during spontaneous Ca2+ wave generation. Calcium imaging was first used to locate a wave-rich region of an isolated retina from an older rat (175–325 d). ATP chemiluminescence was then imaged from the same wave-rich retinal region for several minutes. We observed multiple spontaneous chemiluminescence signals that spread outwards, indicating spontaneous waves of ATP release (Fig. 3). The propagation velocity of the spontaneous ATP waves (22.0 ± 2.1 μm/s; n = 4 waves) closely matched the propagation velocity of spontaneous Ca2+ waves. The maximal diameter of the ATP waves (85.3 ± 3.1 μm) was somewhat larger than that of the Ca2+ waves. The luciferin-luciferase chemiluminescence images were calibrated to determine the absolute concentration of ATP at the retinal surface. Peak extracellular ATP concentration equaled 2 μm at the center of spontaneous waves of ATP release. This is an order of magnitude smaller than the peak ATP levels generated by mechanically evoked waves (Newman, 2001). This is reasonable, as the mechanically evoked waves were substantially greater in magnitude, having significantly larger diameters.
Figure 3.

Spontaneous waves of ATP release in the isolated retina. ATP release was visualized with luciferin-luciferase chemiluminescence in areas of the retina with a high frequency of spontaneous Ca2+ waves. A, A chemiluminescence image in x, y coordinates, showing a spontaneous ATP wave at its peak. This image depicts the same spontaneous wave shown in B. B, C, Linescan images of chemiluminescence represented as contour plots of brightness with time shown on the vertical axis. In these two examples, the linescans (illustrated by the red line in A) are centered at the middle of each wave. Like spontaneous Ca2+ waves, the ATP waves expand from a central point (at the center/top of each graph) and then shrink, over a total period of 8–15 s.
The luciferin-luciferase chemiluminescence results demonstrate that ATP is released in a spatial pattern matching the spontaneous Ca2+ waves. To test whether ATP plays a causal role in wave propagation, we blocked the action of ATP on glial purinergic receptors. Pharmacology experiments were performed during the period of high initial wave frequency in older rats (116–327 d). Suramin (a P2 receptor antagonist; 100 μm) reduced the frequency of spontaneous wave generation by 52 ± 7% (n = 7 retinas) (Fig. 4A,B). Suramin has nonselective effects and might be blocking Ca2+ waves by a mechanism other than antagonizing P2 receptors. We therefore blocked the action of ATP with apyrase, an enzyme that selectively hydrolyzes ATP in the extracellular space. Apyrase (100 U/ml) reduced the frequency of spontaneous waves by 95 ± 4% (n = 4 retinas) (Fig. 4B). The greater effect of apyrase compared with suramin may reflect an incomplete block of P2 receptors by suramin.
We also tested whether gap junctions participate in spontaneous wave propagation by applying carbenoxolone, a gap junction blocker. Carbenoxolone (100 μm) did not affect the number of spontaneous waves generated (n = 3 retinas) (Fig. 4B) or the average speed or diameter of waves (data not shown), indicating that gap junctions do not play a significant role in the propagation of spontaneous waves. This is consistent with the lack of astrocyte involvement in spontaneous waves, as wave propagation between retinal astrocytes is mediated by gap junctions but propagation between Müller cells is not (Newman, 2001). We also applied TTX to determine whether neuronal spiking contributes to the generation of spontaneous waves. TTX (200 nm) did not affect the number of spontaneous waves generated (n = 4 retinas) (Fig. 4B). In addition, neither DL-AP7 (n = 5 retinas) (100 μm; an NMDA receptor antagonist) nor a mixture of adenosine receptor antagonists (n = 4 retinas) (100 nm DPCPX for A1, 1 μm ZM 241385 for A2A, 1 μm MRS 1706 for A2B, and 1 μm MRS 1191 for A3 receptors) had any effect on the number of spontaneous waves generated (Fig. 4B).
The pharmacology experiments illustrated in Figure 4 were conducted during the initial period of high-frequency wave generation following dissection. We also characterized Ca2+ wave generation during the period of steady, baseline generation, 20–70 min after dissection, to determine whether these waves were also propagated by ATP release. In control experiments on older animals (265–294 d), Ca2+ waves were generated at a rate of 0.74 ± 0.43 waves per minute per mm2 (n = 3 animals). Addition of apyrase (100 U/ml) abolished wave generation completely (n = 3 animals); no waves were seen during a total of 35 min of observation.
ATP sensitivity does not increase with age
We speculated that an increase in glial ATP sensitivity with age could account for the increase in wave generation frequency observed in older animals. To test this hypothesis, we bath-applied 3 μm ATP to retinas from animals of different ages. The application of ATP always produced a Ca2+ increase in Müller cells and astrocytes, but we found no correlation between the magnitude of this increase and the age of the animal (n = 24 animals) (Fig. 5A). To ensure that the ATP response was not saturated, we also tested ATP at 1 μm and 0.3 μm. While the Ca2+ responses were smaller, we saw no effect of age on the magnitude of responses at these concentrations (data not shown). The results demonstrate that a change in glial cell ATP sensitivity does not underlie the increased rate of spontaneous wave generation in older animals.
Figure 5.

ATP release, but not ATP sensitivity, increases with age. A, ATP sensitivity of glial cells is age independent. Bath-application of 3 μm ATP produced a Ca2+ increase in Müller cells and astrocytes that was not correlated to the age of the animal. B–E, Mechanical stimulation of astrocyte somata triggered waves of Ca2+ and ATP. The amount of ATP released during evoked waves was greater in older animals. B, An evoked Ca2+ wave (maximum brightness projection). C, An evoked ATP wave (single frame at peak diameter). D, The peak Ca2+ increase during evoked waves in old rats is not different from that in young rats. E, The peak ATP concentration during evoked waves in old rats is higher than in young rats. Differences are significant (p < 0.05) from 23 to 34 s. In D and E, brightness measurements for Ca2+ fluorescence and ATP chemiluminescence are averages over the entire microscopic field. F, Spontaneous Ca2+ waves reach a larger maximal diameter in older animals. The diameter shown at each time point is the maximum diameter reached by that time. Differences between younger and older rats are significant when analyzed per wave (p < 0.001) or per animal (p < 0.005).
More ATP is released by glial cells in older animals
Calcium wave propagation involves both ATP release and a Ca2+ elevation in response to the released ATP. Since the Ca2+ elevation observed in response to ATP does not increase with age (Fig. 5A), we speculated that the amount of ATP released during Ca2+ wave propagation might increase with age. We tested this by evoking Ca2+ waves with a mechanical stimulus in retinas from either 20-d-old or 320-d-old animals. We alternated trials between imaging glial Ca2+ with Fluo-4 (Fig. 5B) and imaging ATP release with luciferin-luciferase (Fig. 5C). Although the peak Ca2+ increase of evoked waves was unchanged from 20 to 320 d (Fig. 5D), the peak ATP concentration generated by evoked waves was significantly higher in older animals than in younger animals (Fig. 5E). In intercellular glial Ca2+ waves, ATP is released in a regenerative manner (Newman, 2001). It is likely that the difference in ATP signal between older and younger animals represents an increase in regenerative ATP release, because the difference grows from 5 to 20 s after stimulation (Fig. 5E). Consistent with this greater ATP release in older animals, we also found that spontaneous waves reach a maximal diameter in older animals (137–158 d; n = 18 waves) that is 28 ± 4% larger than in young animals (40–63 d; n = 21 waves) (Fig. 5F).
Spontaneous waves cause blood vessels to constrict
Artificially evoked glial Ca2+ waves, as well as Ca2+ increases evoked in single glial cells by photolysis of caged compounds, can dilate and constrict blood vessels in the retina (Metea and Newman, 2006). We investigated whether spontaneously generated Ca2+ waves have a similar effect on retinal vessels. Blood vessels and glial Ca2+ were monitored simultaneously in retinas from older animals (139–224 d) exhibiting a high frequency of Ca2+ wave generation. In three of three trials (each from a different animal) where a spontaneous wave propagated from one side of an arteriole to the other, the vessel exhibited a constriction that was synchronized with the wave (Fig. 6, supplemental Movie S2, available at www.jneurosci.org as supplemental material). In each case, the Ca2+ wave started at least 20 μm from the vessel and at least two seconds before the constriction began. The constriction always began on the same video frame in which the Ca2+ wave crossed the vessel. Vessels constricted 24, 11, and 9% of baseline diameter. These constrictions occurred over a small length of the vessel within the area of the spontaneous wave and lasted only as long as the glial Ca2+ elevation. Calcium waves which approached an arteriole but did not propagate past the vessel did not trigger vasoconstriction (n = 41 waves from 7 animals). Vasodilations were not observed, as expected since our Ringer's was bubbled with 95% oxygen, which favors vessel constriction over dilation (Gordon et al., 2008; Mishra et al., 2008).
Figure 6.

Spontaneous Ca2+ waves cause constrictions in arterioles. A, A confocal fluorescence image showing a spontaneous Ca2+ wave (maximum projection image). Glial cells are labeled with Fluo-4 and the arteriole filled with dextran-fluorescein to visualize the lumen. B, The arteriole constricts in synchrony with the spontaneous Ca2+ wave. The large Ca2+ rise in both red and green regions represents a spontaneous wave propagating across the vessel. The Ca2+ signals were measured in the two regions outlined in A and the vessel diameter measured at the blue line in A.
Spontaneous waves occur in vivo
Spontaneous Ca2+ waves could be an artifact of the isolated retina preparation and might not occur in vivo. We tested this by looking for spontaneous waves in retinas in vivo. We used an open-globe in vivo preparation where glial Ca2+ could be monitored in Müller cells and astrocytes with confocal microscopy. In the absence of stimulation, we observed waves of Ca2+ elevation in glia propagating outwards from a central point of initiation (Fig. 7, supplemental Movie S3, available at www.jneurosci.org as supplemental material). Waves in vivo displayed more variability in size and rate of expansion than they did in the isolated retina. However, on average, the waves expanded at 22.1 ± 5.0 μm/s and achieved a maximal diameter of 67.7 ± 9.3 μm (n = 3 waves), very similar to the values measured in the isolated retina.
In rats 24–53 d old (n = 3 animals), we observed an average of 0.6 spontaneous waves per minute per mm2. In older rats, 84–270 d old (n = 4 animals), we observed an average of 6.5 spontaneous waves per minute per mm2. Thus, there is a trend toward an increase in the frequency of spontaneous Ca2+ wave generation with age in the in vivo retina, although this effect did not reach significance. Interpolating between these values, the rate of wave generation in 120-d-old rats would be ∼1.8 waves per minute per mm2, similar to the baseline wave generation rate of 1.0 per minute per mm2 measured in the isolated retina of 120-d-old rats.
Discussion
Intercellular glial Ca2+ waves constitute a coordinated signaling mechanism between glial cells and can, potentially, modulate neuronal excitability and blood flow. Recently, spontaneous waves have been observed in vivo in the cerebellum (Hoogland et al., 2009) and the cortex (Kuchibhotla et al., 2009), demonstrating that glial Ca2+ waves are a physiologically relevant phenomenon and not just a product of artificial stimulation. We report here that spontaneous waves, propagated by the release of ATP, occur in both the isolated retina and the retina in vivo.
The spontaneous retinal Ca2+ waves resemble the spontaneous waves reported in vivo in the cerebellum and cortex (Hoogland et al., 2009; Kuchibhotla et al., 2009) in some respects but differ in others. Whereas the waves in cortex were seen only near amyloid plaques in Alzheimer's mice (and did not occur in wild-type animals), waves in retina and cerebellum occurred in the absence of apparent pathology. The waves in cortex, although expanding at a rate similar to waves in retina, reached a maximum diameter of ∼200 μm, similar to waves seen in culture, but much larger than the spontaneous waves observed in cerebellum and in the retina. The rate of spontaneous wave generation was not reported in cerebellum or cortex.
Like the artificially evoked Ca2+ waves reported in the isolated retina (Newman and Zahs, 1997) and in brain slices (Dani et al., 1992), spontaneous waves in the retina are mediated by release of ATP and activation of glial purinergic receptors. ATP imaging reveals spontaneous waves of ATP release matching the spontaneous Ca2+ waves (Fig. 3). Both suramin, a purinergic antagonist, and apyrase, an ATP-degrading enzyme, reduce the frequency of spontaneous waves in the retina. Neither gap junctional coupling between glial cells nor neuronal activity play a significant role in the generation and propagation of spontaneous waves. Spontaneous Ca2+ waves observed in vivo in the cerebellum are also mediated by activation of purinergic receptors (Hoogland et al., 2009).
Spontaneous Ca2+ waves in the retina are initiated in and propagate through Müller cells and do not appear to involve astrocytes. Although evoked glial Ca2+ waves in the retina propagate through astrocytes if they are initiated in astrocytes, evoked waves that are initiated in Müller cells rarely propagate into astrocytes (Newman, 2001). The difference could be attributable to astrocytes having a higher threshold for Ca2+ activation by purinergic receptors than Müller cells.
Some retinas, especially from older animals, exhibited a high initial frequency of spontaneous waves that decayed to a stable baseline within 15 min. We speculate that the high initial wave rate may be a consequence of mechanical trauma suffered during dissection. However, it is likely that the waves that occur during the initial high-frequency period are generated by the same mechanism as those observed during the stable period of low-frequency wave generation as they have similar properties, including propagation velocity, size and sensitivity to apyrase.
The frequency of spontaneous Ca2+ wave generation increases significantly with the age of the animal. In the isolated retina, the stable, basal rate of wave generation increases from 0.27 to 1.0 waves per minute per mm2 as animals age from 20 to 120 d. A similar increase in the rate of spontaneous wave generation is seen in the retina in vivo. The increase could be related to pathology associated with aging. It is not due to damage produced by light exposure, however, as animals exposed to high ambient light for 1–4 months did not exhibit increased wave generation (Fig. 2D). ATP-evoked Ca2+ increases in retinal glial cells did not increase with age, suggesting that increased wave frequency is not due to an upregulation of P2 receptors or downstream signaling molecules in glial cells. However, the ATP released during evoked Ca2+ waves did increase with age, suggesting that an increase in glial ATP release could account for the age-related increase in spontaneous wave generation. In the isolated retina, individual Müller cells, but not astrocytes, frequently display transient, non-propagating Ca2+ increases (Newman, 2005). If spontaneous waves begin as single-cell Ca2+ transients, it is possible that greater ATP release in older animals in response to Ca2+ increases permits more of these transients to propagate as waves. This could account for the higher frequency of wave generation observed in older animals. Consistent with an age-dependent increase in glial ATP release, spontaneous Ca2+ waves reached a larger peak diameter in older animals (Fig. 5F).
Spontaneous glial Ca2+ waves could contribute to pathology in the CNS. Under ischemic conditions in the cortex in vivo, not only are spontaneous glial Ca2+ transients increased compared with healthy brain, but they are also spatially coordinated and contribute to neuronal death (Ding et al., 2009). In Alzheimer's mice, spontaneous Ca2+ waves occur near amyloid plaques (Kuchibhotla et al., 2009), suggesting that the generation of waves could be triggered by pathology.
Conversely, spontaneous Ca2+ waves could act to protect retinal cells. Activation of P2Y receptors on astrocytes boosts the resistance of both the astrocytes and nearby neurons to oxidative stress (Wu et al., 2007). Spontaneous waves could serve as a source of extracellular ATP to stimulate this protective effect, which would become increasingly important in older animals as oxidative stress increases (Sohal and Weindruch, 1996; Kregel and Zhang, 2007).
In addition to their possible role in pathology, spontaneous glial Ca2+ waves comprise a functional signaling pathway that may have important downstream effects on blood vessels and neurons. Artificially evoked Ca2+ waves regulate the diameter of retinal arterioles by the release of arachidonic acid metabolites (Mulligan and MacVicar, 2004; Metea and Newman, 2006). We demonstrate here that spontaneously generated Ca2+ waves can also regulate arteriole diameter, implying that spontaneous waves contribute to the regulation of blood flow. Arteriole constrictions were observed, as expected because the retina was superfused with Ringer's bubbled with 95% oxygen. When the oxygen concentration is lowered to a physiological level, it is likely that spontaneous Ca2+ waves would evoke vasodilations instead of vasoconstrictions (Gordon et al., 2008; Mishra et al., 2008).
Spontaneous waves may also influence neuronal activity. Evoked increases in glial Ca2+ lead to gliotransmitter release that can modulate neuronal excitability and synaptic transmission (Newman, 2004; Agulhon et al., 2008). ATP release from glia causes depression of synaptic transmission in cultured hippocampal neurons (Koizumi et al., 2003) and brain slices (Pascual et al., 2005). Spontaneous Ca2+ transients in individual glial cells cause NMDA receptor-mediated currents in neurons (Parri et al., 2001; Angulo et al., 2004; Fellin et al., 2004). In the retina, stimulated Ca2+ increases in glia cause neuronal hyperpolarization mediated by ATP release (Newman, 2003), and evoked waves can facilitate or depress light-evoked neuronal spiking (Newman and Zahs, 1997). In light of these functional consequences of glial Ca2+ increases, changes in wave generation over the course of early adulthood could represent age-dependent changes in information processing in the retina.
Footnotes
This work was supported by National Institutes of Health Grant EY004077 and NIH Vision Training Grant. We thank Janet Dubinsky, Benjamin Clark, and Anja Srienc for helpful discussions and comments on this manuscript, and Michael Burian for technical assistance.
References
- Aguado F, Espinosa-Parrilla JF, Carmona MA, Soriano E. Neuronal activity regulates correlated network properties of spontaneous calcium transients in astrocytes in situ. J Neurosci. 2002;22:9430–9444. doi: 10.1523/JNEUROSCI.22-21-09430.2002. [DOI] [PMC free article] [PubMed] [Google Scholar]
- Agulhon C, Petravicz J, McMullen AB, Sweger EJ, Minton SK, Taves SR, Casper KB, Fiacco TA, McCarthy KD. What is the role of astrocyte calcium in neurophysiology? Neuron. 2008;59:932–946. doi: 10.1016/j.neuron.2008.09.004. [DOI] [PMC free article] [PubMed] [Google Scholar]
- Angulo MC, Kozlov AS, Charpak S, Audinat E. Glutamate released from glial cells synchronizes neuronal activity in the hippocampus. J Neurosci. 2004;24:6920–6927. doi: 10.1523/JNEUROSCI.0473-04.2004. [DOI] [PMC free article] [PubMed] [Google Scholar]
- Araque A, Sanzgiri RP, Parpura V, Haydon PG. Calcium elevation in astrocytes causes an NMDA receptor-dependent increase in the frequency of miniature synaptic currents in cultured hippocampal neurons. J Neurosci. 1998;18:6822–6829. doi: 10.1523/JNEUROSCI.18-17-06822.1998. [DOI] [PMC free article] [PubMed] [Google Scholar]
- Cornell-Bell AH, Finkbeiner SM, Cooper MS, Smith SJ. Glutamate induces calcium waves in cultured astrocytes: long-range glial signaling. Science. 1990;247:470–473. doi: 10.1126/science.1967852. [DOI] [PubMed] [Google Scholar]
- Dani JW, Chernjavsky A, Smith SJ. Neuronal activity triggers calcium waves in hippocampal astrocyte networks. Neuron. 1992;8:429–440. doi: 10.1016/0896-6273(92)90271-e. [DOI] [PubMed] [Google Scholar]
- Ding S, Fellin T, Zhu Y, Lee SY, Auberson YP, Meaney DF, Coulter DA, Carmignoto G, Haydon PG. Enhanced astrocytic Ca2+ signals contribute to neuronal excitotoxicity after status epilepticus. J Neurosci. 2007;27:10674–10684. doi: 10.1523/JNEUROSCI.2001-07.2007. [DOI] [PMC free article] [PubMed] [Google Scholar]
- Ding S, Wang T, Cui W, Haydon PG. Photothrombosis ischemia stimulates a sustained astrocytic Ca2+ signaling in vivo. Glia. 2009;57:767–776. doi: 10.1002/glia.20804. [DOI] [PMC free article] [PubMed] [Google Scholar]
- Fellin T, Carmignoto G. Neurone-to-astrocyte signalling in the brain represents a distinct multifunctional unit. J Physiol. 2004;559:3–15. doi: 10.1113/jphysiol.2004.063214. [DOI] [PMC free article] [PubMed] [Google Scholar]
- Fellin T, Pascual O, Gobbo S, Pozzan T, Haydon PG, Carmignoto G. Neuronal synchrony mediated by astrocytic glutamate through activation of extrasynaptic NMDA receptors. Neuron. 2004;43:729–743. doi: 10.1016/j.neuron.2004.08.011. [DOI] [PubMed] [Google Scholar]
- Gordon GR, Choi HB, Rungta RL, Ellis-Davies GC, MacVicar BA. Brain metabolism dictates the polarity of astrocyte control over arterioles. Nature. 2008;456:745–749. doi: 10.1038/nature07525. [DOI] [PMC free article] [PubMed] [Google Scholar]
- Haas B, Schipke CG, Peters O, Söhl G, Willecke K, Kettenmann H. Activity-dependent ATP-waves in the mouse neocortex are independent from astrocytic calcium waves. Cereb Cortex. 2006;16:237–246. doi: 10.1093/cercor/bhi101. [DOI] [PubMed] [Google Scholar]
- Hirase H, Qian L, Bartho P, Buzsaki G. Calcium dynamics of cortical astrocytic networks in vivo. PLoS Biol. 2004;2:494–499. doi: 10.1371/journal.pbio.0020096. [DOI] [PMC free article] [PubMed] [Google Scholar]
- Hoogland TM, Kuhn B, Göbel W, Huang W, Nakai J, Helmchen F, Flint J, Wang SS. Radially expanding transglial calcium waves in the intact cerebellum. Proc Natl Acad Sci U S A. 2009;106:3496–3501. doi: 10.1073/pnas.0809269106. [DOI] [PMC free article] [PubMed] [Google Scholar]
- Kanemaru K, Okubo Y, Hirose K, Iino M. Regulation of neurite growth by spontaneous Ca2+ oscillations in astrocytes. J Neurosci. 2007;27:8957–8966. doi: 10.1523/JNEUROSCI.2276-07.2007. [DOI] [PMC free article] [PubMed] [Google Scholar]
- Kang J, Jiang L, Goldman SA, Nedergaard M. Astrocyte-mediated potentiation of inhibitory synaptic transmission. Nat Neurosci. 1998;1:683–692. doi: 10.1038/3684. [DOI] [PubMed] [Google Scholar]
- Koizumi S, Fujishita K, Tsuda M, Shigemoto-Mogami Y, Inoue K. Dynamic inhibition of excitatory synaptic transmission by astrocyte-derived ATP in hippocampal cultures. Proc Natl Acad Sci U S A. 2003;100:11023–11028. doi: 10.1073/pnas.1834448100. [DOI] [PMC free article] [PubMed] [Google Scholar]
- Kregel KC, Zhang HJ. An integrated view of oxidative stress in aging: basic mechanisms, functional effects, and pathological considerations. Am J Physiol Regul Integr Comp Physiol. 2007;292:R18–R36. doi: 10.1152/ajpregu.00327.2006. [DOI] [PubMed] [Google Scholar]
- Kuchibhotla KV, Lattarulo CR, Hyman BT, Bacskai BJ. Synchronous hyperactivity and intercellular calcium waves in astrocytes in Alzheimer mice. Science. 2009;323:1211–1215. doi: 10.1126/science.1169096. [DOI] [PMC free article] [PubMed] [Google Scholar]
- Metea MR, Newman EA. Glial cells dilate and constrict blood vessels: a mechanism of neurovascular coupling. J Neurosci. 2006;26:2862–2870. doi: 10.1523/JNEUROSCI.4048-05.2006. [DOI] [PMC free article] [PubMed] [Google Scholar]
- Mishra A, Hu M, Newman EA. Nitric oxide and oxygen modulate glial-mediated neurovascular coupling. In: Barres B, Stevens B, editors. Glia in health and disease. Cold Spring Harbor, NY: Cold Spring Harbor Laboratories; 2008. [Google Scholar]
- Mulligan SJ, MacVicar BA. Calcium transients in astrocyte endfeet cause cerebrovascular constrictions. Nature. 2004;431:195–199. doi: 10.1038/nature02827. [DOI] [PubMed] [Google Scholar]
- Nedergaard M. Direct signaling from astrocytes to neurons in cultures of mammalian brain cells. Science. 1994;263:1768–1771. doi: 10.1126/science.8134839. [DOI] [PubMed] [Google Scholar]
- Nett WJ, Oloff SH, McCarthy KD. Hippocampal astrocytes in situ exhibit calcium oscillations that occur independent of neuronal activity. J Neurophysiol. 2002;87:528–537. doi: 10.1152/jn.00268.2001. [DOI] [PubMed] [Google Scholar]
- Newman EA. Propagation of intercellular calcium waves in retinal astrocytes and Müller cells. J Neurosci. 2001;21:2215–2223. doi: 10.1523/JNEUROSCI.21-07-02215.2001. [DOI] [PMC free article] [PubMed] [Google Scholar]
- Newman EA. Glial cell inhibition of neurons by release of ATP. J Neurosci. 2003;23:1659–1666. doi: 10.1523/JNEUROSCI.23-05-01659.2003. [DOI] [PMC free article] [PubMed] [Google Scholar]
- Newman EA. Glial modulation of synaptic transmission in the retina. Glia. 2004;47:268–274. doi: 10.1002/glia.20030. [DOI] [PMC free article] [PubMed] [Google Scholar]
- Newman EA. Calcium increases in retinal glial cells evoked by light-induced neuronal activity. J Neurosci. 2005;25:5502–5510. doi: 10.1523/JNEUROSCI.1354-05.2005. [DOI] [PMC free article] [PubMed] [Google Scholar]
- Newman E, Reichenbach A. The Muller cell: a functional element of the retina. Trends Neurosci. 1996;19:307–312. doi: 10.1016/0166-2236(96)10040-0. [DOI] [PubMed] [Google Scholar]
- Newman EA, Zahs KR. Calcium waves in retinal glial cells. Science. 1997;275:844–847. doi: 10.1126/science.275.5301.844. [DOI] [PMC free article] [PubMed] [Google Scholar]
- Newman EA, Zahs KR. Modulation of neuronal activity by glial cells in the retina. J Neurosci. 1998;18:4022–4028. doi: 10.1523/JNEUROSCI.18-11-04022.1998. [DOI] [PMC free article] [PubMed] [Google Scholar]
- Parpura V, Basarsky TA, Liu F, Jeftinija K, Jeftinija S, Haydon PG. Glutamate-mediated astrocyte-neuron signalling. Nature. 1994;369:744–747. doi: 10.1038/369744a0. [DOI] [PubMed] [Google Scholar]
- Parri HR, Gould TM, Crunelli V. Sponataneous astrocytic Ca2+ oscillations in situ drive NMDAR-mediated neuronal excitation. Nat Neurosci. 2001;4:803–812. doi: 10.1038/90507. [DOI] [PubMed] [Google Scholar]
- Pascual O, Casper KB, Kubera C, Zhang J, Revilla-Sanchez R, Sul JY, Takano H, Moss SJ, McCarthy K, Haydon PG. Astrocytic purinergic signaling coordinates synaptic networks. Science. 2005;310:113–116. doi: 10.1126/science.1116916. [DOI] [PubMed] [Google Scholar]
- Porter JT, McCarthy KD. Hippocampal astrocytes in situ respond to glutamate released from synaptic terminals. J Neurosci. 1996;16:5073–5081. doi: 10.1523/JNEUROSCI.16-16-05073.1996. [DOI] [PMC free article] [PubMed] [Google Scholar]
- Scemes E, Giaume C. Astrocyte calcium waves: what they are and what they do. Glia. 2006;54:716–725. doi: 10.1002/glia.20374. [DOI] [PMC free article] [PubMed] [Google Scholar]
- Schipke CG, Boucsein C, Ohlemeyer C, Kirchhoff F, Kettenmann H. Astrocyte Ca2+ waves trigger responses in microglial cells in brain slices. FASEB J. 2002;16:255–257. doi: 10.1096/fj.01-0514fje. [DOI] [PubMed] [Google Scholar]
- Sohal RS, Weindruch R. Oxidative stress, caloric restriction, and aging. Science. 1996;273:59–63. doi: 10.1126/science.273.5271.59. [DOI] [PMC free article] [PubMed] [Google Scholar]
- Stosiek C, Garaschuk O, Holthoff K, Konnerth A. In vivo two-photon calcium imaging of neuronal networks. Proc Natl Acad Sci U S A. 2003;100:7319–7324. doi: 10.1073/pnas.1232232100. [DOI] [PMC free article] [PubMed] [Google Scholar]
- Takano T, Tian GF, Peng W, Lou N, Libionka W, Han X, Nedergaard M. Astrocyte-mediated control of cerebral blood flow. Nat Neurosci. 2006;9:260–267. doi: 10.1038/nn1623. [DOI] [PubMed] [Google Scholar]
- Tian GF, Takano T, Lin JH, Wang X, Bekar L, Nedergaard M. Imaging of cortical astrocytes using 2-photon laser scanning microscopy in the intact mouse brain. Adv Drug Deliv Rev. 2006;58:773–787. doi: 10.1016/j.addr.2006.07.001. [DOI] [PubMed] [Google Scholar]
- Venance L, Stella N, Glowinski J, Giaume C. Mechanism involved in initiation and proagation of receptor-induced intercellular calcium signalling in cultured rat astrocytes. J Neurosci. 1997;17:1981–1992. doi: 10.1523/JNEUROSCI.17-06-01981.1997. [DOI] [PMC free article] [PubMed] [Google Scholar]
- Wu J, Holstein JD, Upadhyay G, Lin DT, Conway S, Muller E, Lechleiter JD. Purinergic receptor-stimulated IP3-mediated Ca2+ release enhances neuroprotection by increasing astrocyte mitochondrial metabolism during aging. J Neurosci. 2007;27:6510–6520. doi: 10.1523/JNEUROSCI.1256-07.2007. [DOI] [PMC free article] [PubMed] [Google Scholar]
- Yang Y, Ge W, Chen Y, Zhang Z, Shen W, Wu C, Poo M, Duan S. Contribution of astrocytes to hippocampal long-term potentiation through release of D-serine. Proc Natl Acad Sci U S A. 2003;100:15194–15199. doi: 10.1073/pnas.2431073100. [DOI] [PMC free article] [PubMed] [Google Scholar]
- Zahs KR, Newman EA. Asymetric gap junctional coupling between glial cells in the rat retina. Glia. 1997;20:10–22. [PubMed] [Google Scholar]
- Zonta M, Angulo MC, Gobbo S, Rosengarten B, Hossmann KA, Pozzan T, Carmignoto G. Neuron-to-astrocyte signaling is central to the dynamic control of brain microcirculation. Nat Neurosci. 2003;6:43–50. doi: 10.1038/nn980. [DOI] [PubMed] [Google Scholar]