

Abstract
The identification of peptides that result from post-translational modifications is critical for understanding normal pathways of cellular regulation as well as identifying damage from, or exposures to xenobiotics, i.e. the exposome. However, because of their low abundance in proteomes, effective detection of modified peptides by mass spectrometry (MS) typically requires enrichment to eliminate false identifications. We present a new method for confidently identifying peptides with mercury (Hg)-containing adducts that is based on the influence of mercury's seven stable isotopes on peptide isotope distributions detected by high-resolution MS. Using a pure protein and E. coli cultures exposed to phenyl mercuric acetate, we show the pattern of peak heights in isotope distributions from primary MS single scans efficiently identified Hg adducts in data from chromatographic separation coupled with tandem mass spectrometry with sensitivity and specificity greater than 90%. Isotope distributions are independent of peptide identifications based on peptide fragmentation (e.g. by SEQUEST), so both methods can be combined to eliminate false positives. Summing peptide isotope distributions across multiple scans improved specificity to 99.4% and sensitivity above 95%, affording identification of an unexpected Hg modification. We also illustrate the theoretical applicability of the method for detection of several less common elements including the essential element, selenium, as selenocysteine in peptides.
The availability of entire genomic sequences and the development of tandem mass spectrometry and liquid chromatography (LC-MS/MS)1, has enabled the widespread use of shotgun or bottom-up proteomics over the last decade (1). Despite imperfect peptide identifications, these techniques effectively catalogue even rare proteins present in cells because most proteins are represented by several unique peptides, diminishing the effects of any single false peptide identification. Recent efforts have also enhanced shotgun proteomics to resolve fine scale protein features, such as post-translational modifications (PTM) (2). However, because many modifications often appear in only a single peptide in typical shotgun proteomics preparations, false peptide identifications can greatly impact the characterization of these modifications.
Preprocessing proteomic preparations to enrich peptides with a PTM of interest is one common strategy used to minimize false identifications. If the modification cannot be enriched, then other independent evidence is needed to increase confidence in PTM identifications. Types of data that have been used for PTM corroboration include characteristic fragmentation such as that for the neutral loss of phosphate (3), or modifications observed on overlapping peptides resulting from digestions with different proteases (4). Here we present a method to discern the anomalous isotope distribution of peptides either post-translationally or cotranslationally modified by an element with a distinctive stable isotope “fingerprint” such as the common xenobiotic metal mercury (Hg). This method advances mass spectrometry based proteomics as a possible method for identifying and characterizing the effects of exposures to certain xenobiotics, an area of growing interest recently called the “exposome” (5, 6).
We first establish theoretically that such perturbations of a peptide's isotope distribution by Hg should be detectable for peptides of unknown sequence, and then demonstrate this experimentally using organomercurial (RHg) modification of a single pure protein and of the entire E. coli proteome. Hg is unusual among metals in making nearly covalent bonds with sulfur that survive the LC-MS/MS process (7, 8), and identifying its most vulnerable protein targets in intact cells is of interest in understanding Hg's pleiotropic toxicity. However, there are no simple preparative procedures with which to extract mercurated proteins from a cell lysate. Thus, we devised a computational filter based on Hg's stable isotope distribution to identify peptides with Hg adducts in the data of an LC-MS/MS proteome.
Because inorganic Hg(II) and organomercurials form very stable bonds with thiols, we have focused on detecting Hg adducts in cysteine-containing peptides. The distinctive isotope distributions of Hg-modified peptides have been qualitatively noted previously (9). Most unmodified peptides have similar isotope distributions. This similarity results from similar ratios of the five peptide elements, C, H, N, O, and S in most peptides, and also from the similar isotope distributions of the five elements: each has only two to four stable natural isotopes of which the lightest is substantially more abundant (Fig. 1A). Thus, no single peptide atom, even of sulfur, which has the most complex isotope distribution, can have a very distinctive effect on the peptide isotope distribution. In contrast, Hg has seven detectable stable isotopes with the lightest being the least abundant (Fig. 1B). Thus, the isotope distribution of a peptide with an Hg adduct will be predictably broadened compared with its unmodified version (Figs. 1C and 1D). We devised a straightforward quantitative scoring function to compare the observed and theoretical isotope distributions of an unidentified peptide that can be used automatically to filter the thousands of spectra produced in typical LC-MS/MS proteomics experiments. Other tools examine isotope distributions to remove signals of nonpeptides or overlapping isotope distributions, e.g. THRASH (10) and MaxQuant (11), but ours is the first case of using isotope distributions as a classifier. We evaluated our scoring function by determining its error rates when thresholds are applied to classify isotope distributions as either an unmodified peptide or a peptide modified with Hg. This technique is independent of peptide sequence identifications, e.g. by SEQUEST (12), so it increases the confidence of SEQUEST-identified modifications and eliminates false SEQUEST identifications. Moreover, because analysis of isotope distributions does not require an exact formula for the modification or the peptide, previously unidentified MS features can be highlighted by their anomalous isotope distributions, allowing for the discovery and identification of unexpected modifications through a more focused examination.
Fig. 1.

Isotope distributions of single atoms and their effects on peptide isotope distributions. Isotope distributions for single atoms of the five typical peptide elements are shown in (A) and for Hg in (B). Panels (C and D) show computed isotope distributions for the same peptide either unmodified (C) or modified with a single Hg(II) (D).
EXPERIMENTAL PROCEDURES
Characterizing Isotope Distributions by Fit Scores
In this study, the isotope distribution characterization is applied to peaks observed in primary MS (MS1) scans from an LTQ Orbitrap hybrid Fourier transform mass spectrometer (Thermo Scientific) with nominal resolution set to 100,000. All software is implemented in the Python programming language except as noted.
Peak Identification
Data files from the MS instrument are first translated to mzXML format in profile mode, which provides a readable list of m/z and intensity data points that define the spectrum. For maximum control over the peak finding and centroiding to aid methods development, we implemented our own procedures, though the software as written can also use pre-centroided mzXML files. Our peak identification procedure tests each data point in the profile as a candidate peak-top; no peaks are filtered as noise. A window of at most four neighboring data points (five total data points) centered on the candidate data point is checked for the presence of any data points with greater or equal intensity to the candidate data point. This window of five data points, equivalent to four data point intervals, corresponds to the full width at half maximum (FWHM) for most isotope peaks. For example, at m/z = 1200, the m/z distance between data points is 0.004, and the FWHM for most observed peaks is near 0.016. If no data points have greater intensity than the peak-top candidate and only adjacent data points have equal intensity, then the candidate is considered a peak-top with intensity set to the intensity of that highest data point. We use peak height, as used by Decon2LS (13) for example, instead of peak area, as used by MaxQuant (11) for example, as a measure of abundance to avoid the problem of determining peak boundaries. The m/z value assigned to the peak is the intensity-weighted average of the m/z of all five data points within the window examined to determine that the candidate data point is a peak-top. If the rare case occurs where two neighboring data-points are peak-tops and of equal intensity, the m/z location for this single peak is determined from the weighted average of only four data-points: the two peak top points, and an additional data point on either side.
Clustering Peaks in Single Scans Into Isotope Distributions
All identified peaks in each individual high-resolution primary MS1 scan are divided into isotope clusters or distributions of peaks that appear to be isotopic shifts of the same ion. The procedure we use has a similar goal to the deisotoping procedures included in tools such as Decon2LS (13), but without a priori expectations of isotope distributions to avoid bias toward modified or unmodified peptides. Starting with the largest peak in the scan, candidate clusters are made that contain the peak for each charge (z) up to charge 6+ by checking m/z interval steps 1.002/z greater and lower than the main peak (with tolerance of ± 0.015 m/z units) for compatible peaks. In each step interval, the largest peak is chosen from among all candidates. Because the presence of noise peaks could join two unrelated clusters, or simply make a 2+ cluster appear to be a 4+ cluster, two constraints on pattern shape are applied to stop runaway cluster growth resulting from small peaks. First, any candidate cluster is trimmed back to the smallest peak between the largest first peak and any secondary peak that is greater than 3 times the smallest intervening peak. Second, any peak with abundance less than 1/100 of the largest first peak halts the stepping in its direction. A charge and final cluster, representing the isotope distribution, is assigned to the starting peak by choosing the charge that produces the cluster with the greatest summed intensity. All peaks assigned to this cluster are removed from subsequent analysis by deleting them from the peak list before starting the cluster search again at the remaining largest peak. A similar algorithm, THRASH (10), removes already clustered peaks by subtracting just the heights of the peaks as predicted by an expected shape of the isotope distribution; thus it is able to assign an individual peak to more than one isotope distribution, and deconvolute peaks arising from multiple different peptides. This procedure is not possible for our method where we are searching for different types of isotope distributions.
Calculation of Fit Scores to Theoretical Isotopic Distributions
When searching for Hg-modified peptides, each observed isotope distribution is scored for its fit to both a theoretical isotope distribution for an unmodified peptide and one for a peptide modified with a single Hg atom. The procedure would be identical for searching for peptides with Sec, substituting Se for Hg. To compute theoretical isotope distributions, first approximate chemical formulas for the theoretical peptides were produced using ‘averagine’ ratios and procedures (14). Isotope distributions based on the theoretical formulas were calculated using the algorithm and source code for emass (15), modified to work as a module for the Python programming language.
Fit Score Minimization and Calculation
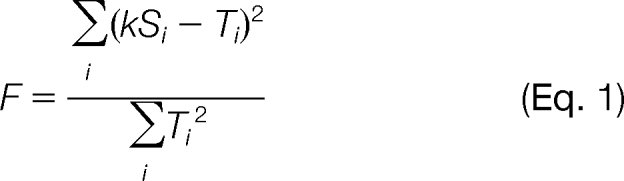
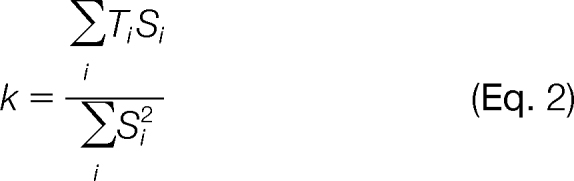
The alignment and scaling of an observed isotope distribution (s) with m peaks, with the theoretical isotope distribution (t) with n peaks is chosen to minimize the deviation of the observed from the theoretical. Keeping consistent with previous nomenclature, as used by Decon2LS (13), we call this measure of deviation a “Fit” score. Absolute m/z values are ignored, and only positions (first, second, third, etc.) in the isotope distribution are considered. The isotope distribution is then treated as a vector of peak abundances. All possible alignments are considered, fully sliding one isotope distribution over the other, one peak at a time, from where only the extreme left peak of s (denoted s1) aligns with the extreme right of t (tn), to the opposite extreme where only sm aligns with t1. For each peak in an isotope distribution that lies beyond the tails of the other, a matching peak of abundance 0 is added to the other distribution. The new aligned isotope distributions are labeled S and T, each with the new length L. The theoretical isotope distribution is normalized to have the abundance of the largest peak set to 1.0. The observed isotope distribution is scaled to optimize the fit, i.e. to minimize F in Equation 1, by the use of a scaling factor k. The scaling factor k used in equation (1) is computed for each alignment according to equation (2). Except for the scaling factor k, this fit score is identical to the peak fit function used by Decon2LS (13).
 |
 |
Multiscan Feature Discovery
We define a multiscan LC-MS feature as a single chemical species that elutes from the LC column over a period of time and so appears in multiple sequential MS scans. For the purposes of the study described here, these multiple scans provided many replicates from a single LC-MS run for examining isotope distributions, and the individual isotope distributions can be summed to minimize the effects of random noise on any single spectrum. Multiscan LC-MS features were discovered using the clustering tools in VIPER (16). In brief, all individual scans were first deisotoped using Decon2LS with or without an Hg tag as appropriate. Deisotoped peaks with matching mass and neighboring elution times were grouped using the tool LCMSFeatureFinder, distributed as part of VIPER. To produce a summed isotope distribution for each multi-scan feature, peak heights for each single scan in the feature were collected according to “Clustering peaks in single scans into isotope distributions” above. The single scan isotope distributions were aligned together and the corresponding peak heights summed to give a summed isotope distribution.
Rabbit GAPDH Pure Protein
Rabbit muscle glyceraldehyde-3-phosphate dehydrogenase (GAPDH) was from Sigma (G2267); all other reagents were of analytical grade. The protein was dissolved in 5 mm potassium phosphate buffer, pH 7.3 to give a stock solution of 10 mg/ml and stored at −20 °C when not in use. An aliquot was used to determine the protein thiol content under denaturing conditions (6 m guanidine hydrochloride) using 5,5′-dithiobis(2-nitrobenzoic acid) (17). For mass spectrometric analysis, an aliquot of the stock was diluted 10-fold with 50 mm NH4HCO3, pH ∼ 8. Phenylmercuric acetate (PMA) was added to the dilute protein to give a final ratio of 0.95 equiv PMA/protein thiol. After incubation at 25 °C for ∼ 5 min, the preparation was divided into two aliquots; one was placed on ice, and iodoacetamide (20 mm final concentration) was added to the other. After 30 min incubation of the latter in the dark at room temperature, both aliquots were frozen at −80 °C and then sent overnight on dry ice to Pacific Northwest National Laboratory (PNNL) for denaturation, trypsinolysis, and LC-MS/MS as described below.
Bacterial Strains and Growth Conditions
E. coli strains K-12 MG1655 and MG1655 containing the NR1 plasmid carrying the Tn21 mer operon, which encodes inorganic mercury resistance (18), were used for model organisms. E. coli cells from −70 °C stocks were grown overnight at 37 °C on Luria-Bertani (LB) plates or LB+25 μg/ml chloramphenicol plates to select for NR1 plasmid. Ten well isolated colonies from each overnight plate were inoculated into Neidhardt MOPS minimal medium (19) supplemented with 20 mg/L uracil and 500 μg/L thiamine and grown overnight at 37 °C with shaking at 250 rpm. These overnight liquid cultures were subcultured (1:40) into the same medium and incubated at 37 °C, 250 rpm until OD595 ≈ 0.6 at which time the culture was split evenly and one half was made 40 μm in PMA. Incubation of both culture aliquots continued for 15 min and then both aliquots were harvested by centrifugation at 17,700 × g, for 10 min at 4 °C. Cell pellets were suspended in 50 mm ammonium bicarbonate (pH 7.8) at 0.01× the original culture volume, iodoacetamide (IAM) was added, and the suspensions were stored at −70 °C until they were shipped overnight on dry ice to Pacific Northwest National Laboratory for final workup and LC-MS/MS analysis.
Data from three separate E. coli proteomics experiments were combined in this analysis. Two experiments involved strain MG1655, which does not have a plasmid, and the third experiment used MG1655 carrying the NR1 plasmid encoding the mercury resistance operon. In one experiment on plasmid-free cultures 40 mm IAM was used to preserve Hg-adducts; the other two experiments used 20 mm IAM. These differences had no significant impact on the detection of Hg adducts in peptides from the PMA-exposed cells. Corresponding unexposed cultures were included in each experiment and their data are also included in the work reported here. Where appropriate, results were pooled across all runs within a single experiment and then averaged across the three experiments. For some statistics, such as counts of PhHg modifications, the counts were too low within individual experiments to treat separately, so all runs were pooled across all three experiments.
Proteomic Methods
Peptide Preparations
Cell suspensions in IAM were diluted as necessary in 100 mm ammonium bicarbonate, pH 8.0, with IAM and lysed with a PBI Barocycler NEP 3229 for ten cycles, holding at 35,000 psi for 20 s. A portion of the lysate was fractionated by ultracentrifugation into soluble and insoluble fractions according to described procedures (20) except that to avoid interference with protein-phenylmercury bonds, DTT and thiourea were not used. As described (20), all samples were digested using sequencing grade modified trypsin (Promega, Madison, WI).
Peptide Detection
Triplicate aliquots of the unfractionated lysate (“global”), and the soluble and insoluble fractions were analyzed by LC-MS/MS using a ThermoScientific Exactive Orbitrap mass spectrometer (Thermo Scientific) outfitted with a custom-built electrospray ionization interface that was fabricated in-house (21, 22). The high performance liquid chromatography (HPLC) gradient used has been described elsewhere (20).
Peptide Identification
Peptides from the MS/MS spectra were identified with TurboSEQUEST version 27, revision 12. We generated peak lists as dta files with extract_msn.exe version 4.0 (ThermoElectron), requiring a minimum of 35 ions per MS/MS spectrum and precursor mass between 200 and 5000 Daltons. We used a custom sequence database combining the peptide translations from the E. coli genome sequence, strain K12-MG1655, GenBank accession number U00096.2, GI:48994873, 4331 proteins, together with the sequence of the NR1 plasmid, GenBank accession number DQ364638.1, GI:89033265, 123 proteins. Mass tolerances were 3.0 Daltons for precursor ions and 1.0 Daltons for fragment ions. Variable modifications were allowed at cysteines equal to the mass of alkylation by IAM (+57.0215), adduction by PhHg (+278.0019), or by Hg(II) (+199.9549). We used a modified static cutoff approach (23) for evaluating the significance of SEQUEST identifications. SEQUEST identifications were accepted if they had at least one tryptic end, any number of missed cleavages, and their XCorr values were greater than 1.9, 2.2, or 3.2 for charge states of +1, +2 and ≥ +3, respectively. Also, except in the rare cases where the second-ranked SEQUEST hit was a permutation of cysteine modifications of the first hit, SEQUEST results were required to have a ΔCn of at least 0.1. These score thresholds are in-house standards that aim for a false discovery rate near 1%. Using a decoy approach (24) we determined these score thresholds to produce a peptide false discovery rate of 1.44%. To demonstrate the utility of isotope distributions with an alternative peptide identification score, all SEQUEST identifications were rescored by PeptideProphet version 1.0.0.4, downloaded as source on May 9, 2006.
RESULTS
Theoretical Spectra Fit to Approximate Formulas for Hg Peptides
We began by examining the theoretical best case for our method: identifying Hg-peptide isotope distributions with no instrument noise (Fig. 2). As noise-free proxies for the observed spectra from an actual experiment, we computed theoretical spectra from exact chemical formulas for the 60,311 cysteine-containing peptides from an in silico tryptic digest of the E. coli MG1655 proteome. We modeled Hg peptides by in silico modification of a single cysteine in each peptide with PhHg.
Fig. 2.

Isotope distributions of Hg peptides of unknown sequence are theoretically separable from typical unmodified peptides. The procedure for generating data for panels (B–D) is outlined in (A). In (A), boxes 1–3 show two examples (blue and red) of the generation of exact isotope distributions of computed E. coli tryptic cysteine peptides in Hg-modified and unmodified states (as proxies for observed, unidentified isotope distributions). Boxes 4 and 5 show the computation of expected isotope distributions based on approximate averagine (14) formulas for these two cases, modified and unmodified. Boxes 6–8 show the fit scores that can be used to classify the unidentified isotope distribution as Hg-modified or unmodified. The relation of these fit scores to the mass of the peptide is shown in panels (B–D) for ∼60,000 E. coli tryptic peptides in either modified (blue) or unmodified (red) states. Panel (B) compares the fitHg scores for computed isotope distributions with isotope distributions from averagine+Hg formulas. Panel (C) shows fitAvgn computed by fitting the E. coli isotope distributions to isotope distributions from averagine formulas without Hg. Panel (D) shows ΔFit, the difference between scores in (C) and (B) for each isotope distribution. Points circled in black in (B–D) correspond to the example peptides shown in (A).
For each theoretical isotope distribution based on an exact formula of a modified (Fig. 2A, blue) or unmodified peptide (Fig. 2A, red), we calculated its fit to isotope distributions based on two different approximate chemical formulas (Fig. 2A, box 4) computed from the target mass and average ratios of elements in peptides, denoted ‘averagine’ (14). The approximate formulas were created for a Hg-modified (purple) and an unmodified (yellow) peptide. Approximate formulas are necessary in a real experiment when the exact formula of an ion detected by MS is unknown. The fit score is a scaled sum of squared deviations in peak heights, with spectra aligned and normalized to produce the best fit score (see Experimental Procedures). A fit score of 0.0 is a perfect match, and a fit score of 1.0 is the asymptotic maximum deviation (i.e. no overlap at all). The theoretical isotope distributions of Hg-modified peptides are detectably distinct from those of unmodified peptides, whether the spectra are fit to an approximate Hg-modified peptide (fitHg, Fig. 2B), an approximate unmodified peptide (fitAvgn, Fig. 2C), or the difference of the two, ΔFit (fitAvgn - fitHg, Fig. 2D). Note that because a perfect match for a Hg-peptide has a fitHg score of 0.0, ΔFit scores for Hg-modified peptides have positive values and, conversely, ΔFit scores for unmodified peptides have negative values. As peptide mass increases, the modified and unmodified peptides more closely resemble each other. However, there is clear separation at masses up to 5000 Daltons, which exceeds the mass of most peptides commonly detected in proteomic preparations: 99% are < 3000 Daltons according to PepSeeker (25), 96% < 4000 Daltons in our own data.
Theoretically, any element with a distinctive natural abundance isotope distribution can give rise to similar distinctions between modified and unmodified peptides depending on the pattern of their isotope distributions (supplemental Fig. S1). Most notably, selenium, which occurs naturally but rarely in proteins as selenocysteine (Sec), may be detectable by this method.
A lower variability of fit values for the modified peptides compared with the unmodified is apparent in Fig. 2 and supplemental Fig. S1. This change in variability can be attributed to the homogenizing effect of adding a single atom with a diverse isotope distribution, such as Hg, to the isotope distributions of different peptides (see supplemental Fig. S2).
Experimental Spectra Fit to Approximate Formulas
To examine whether this distinction in the shape of isotope distributions is detectable with real-world instrument noise, we analyzed peptides from a Hg-exposed pure protein with high resolution LC-MS/MS. To generate peptides with Hg modifications, we exposed rabbit glyceraldehyde 3-phosphate dehydrogenase (GAPDH) to phenyl mercuric acetate (PMA) and digested it with trypsin. The monovalent organomercurial PMA was used to minimize peptide cross-linking which might occur with bivalent Hg(II). We used SEQUEST to search for a variable modification of mass equal to PhHg at cysteines. In four LC-MS/MS runs, SEQUEST predicted seven different peptides (in 39 MS/MS spectra) as modified by PhHg at one of the four cysteines in a GAPDH monomer. MS/MS spectra (e.g. Fig. 3) of PhHg-modified and unmodified peptides are highly similar in terms of the presence and relative abundance of specific y and b ions. However, fragmentation of the PhHg modified peptide appears dominated by a peak consistent with the neutral loss of 78 Daltons, which equals the mass of a phenyl group. Further supporting that this is due to the loss from the PhHg modification, for each of the larger peaks interpreted as y ions that contain a PhHg group, there is a corresponding peak at 78 Daltons less. Although these neutral loss peaks appear to be strong indicators of a PhHg modification, we observed no patterns consistent with the neutral loss of the Hg atom. Therefore, detecting neutral loss in MS/MS will not be a general strategy for detecting other types of Hg modifications.
Fig. 3.

MS/MS Spectra of unmodified (A) and PhHg-modified (B) rabbitt GAPDH peptide VPTPNVSVVDLTCR. ‘C#’ denotes a PhHg adduct of cysteine. Inset plots show the isotope distributions of the precursor ions as observed in MS1. Peaks that match expected y and b fragmentation ions are labeled with m/z values reported as observed from the spectra. In (B), the top of the tallest peak matches a peak consistent with the neutral loss of 78 Daltons, equal to a phenyl group, from the precursor ion. The full height of this peak is not shown here in order to increase the visibility of y and b ions. Red labels under the x axis in (B) indicate peaks that correspond to a loss of 78 Daltons from a y ion.
We expanded this initial set of isotope distributions from PhHg-adducts using an LC-MS feature detection tool (see Methods) to identify corresponding isotope distributions in all primary MS scans neighboring (in time) each scan with a SEQUEST identification. This expanded set included many isotope distributions with relatively low intensity (e.g. Fig. 4E) in addition to the high intensity isotope distributions that preceded the secondary MS (MS2) scans leading to the initial confident assignments by SEQUEST (e.g. Fig. 4D). For a comparison set of isotope distributions from unmodified peptides, we chose a subset of the detected unmodified peptides that represents the mass range of all observed peptides (Figs. 4A and 4C). Plotting the ΔFit scores for these experimentally-derived isotope distributions as a function of mass (Fig. 4B) we found they closely match those observed in the theoretical cases (denoted by the dotted lines in Fig. 4B), except for isotope distributions with lower-intensity peaks (denoted by the shorter dashes in Fig. 4B) where separation between modified and unmodified is degraded (Fig. 4B). There is a slight overlap between the distribution of ΔFit scores for modified and unmodified peptides, the extent of which is made more visible by histograms of the ΔFit scores (Fig. 5A). We used ΔFit in most subsequent analysis as a summary of both fitAvgn and fitHg, as we found it was the best single classifier based on receiver operator characteristic analysis of the GAPDH peptides compared with either single fit score alone (shown in supplemental Fig. S3). To be an accurate binary classifier, a ΔFit threshold must lie above the ΔFit of most unmodified peptides and lie below the ΔFit of most modified peptides, thus separating the ΔFit distributions for the two classes (see Fig. 5A). The proportion of each distribution that is thus accurately classified by ΔFit is called specificity for the unmodified peptides or sensitivity for the modified peptides. The specificity and sensitivity of ΔFit on these peptides from GAPDH, and their relation to the choice of threshold, are shown by the red line in Fig. 5B and the blue line in Fig. 5C, respectively. At a ΔFit threshold of 0.0, specificity is 99.6% and sensitivity is 94%.
Fig. 4.

Observed isotope distributions of PhHg modified and unmodified rabbit GAPDH peptides are distinct. The procedure used to generate ΔFit for observed isotope distributions is identical to that for Fig. 2 except that analysis begins by replacing Fig. 2 boxes 1–3 with observed isotope distributions and observed mass (panels A and C–E). All isotope distributions were collected as described under “Experimental Procedures” from MS1 scans in LC-MS/MS runs of tryptic digests of pure PMA-exposed rabbit GAPDH. Panel (B) plots ΔFit scores for observed isotope distributions of unmodified (red dashes “-”) and modified peptides (blue dashes “-”) as a function of observed mass. The dotted lines are loess smoothed curves of the values computed on the noise-free isotope distributions shown in Fig. 2(D). Each dash (-) represents the fit score for an individual isotope distribution from a single MS1 scan, and the length of the dash indicates the intensity of the tallest peak in that isotope distribution. Labels “a”, “c”, “d” and “e” identify points corresponding to the example distributions in those panels (A, C, D, and E). The distribution displayed in panel (C) is for the same peptide as in (A) but with a stronger signal. Panels (D) and (E) are examples of relatively strong (D) and weak (E) intensity distributions for another PhHg modified peptide.
Fig. 5.

Sensitivity and specificity of ΔFit depends on threshold. A, The distribution of ΔFit scores from rabbit GAPDH peptides shown in Fig. 4B. In blue is a histogram of the 590 ΔFit scores from modified peptides. To match the size of the blue distribution, in red is a random sample of 590 out of the 4507 total ΔFit scores from unmodified peptides. At each ΔFit threshold, the specificity (B, red line) is the fraction of the isotope distributions from unmodified GAPDH peptides (red distribution) that lies to the left of the threshold. The sensitivity (C, blue line) is the fraction of the isotope distributions from GAPDH modified peptides (blue distribution) that lies to the right of the threshold. B and C also show sensitivity and specificity of ΔFit on E. coli proteomic preparations for comparison. In panel (B), the specificity shown by orange lines a-d is the fraction of the orange distribution from the same-lettered histogram in Fig. 6 that is less than the threshold. The specificity line labeled “e” shows the fraction of all summed features (using the orange distribution in Fig. 6D) eliminated by both the ΔFit threshold AND a fitHg threshold of 0.05 to produce the distribution in Fig. 6E. In panel (C) the letters on the purple sensitivity lines refer to the histograms in Fig. 6 that produce the sensitivity estimate.
ΔFit Applied to Single Scans in E. coli Proteomic Preparations
ΔFit Eliminates False Positives in SEQUEST Identifications
In typical LC-MS/MS proteomic analysis, fragmentation data obtained in the second MS step are analyzed by software tools such as SEQUEST to identify the peptide sequence, with or without one of a few expected modification types, and the corresponding identity of the protein. The use of these methods alone can lead to unacceptable numbers of falsely identified modifications, especially when numbers of actual modifications are low. In this work, SEQUEST identified 99 spectra as PhHg-modified peptides from three separate proteomic preparations of E. coli cells that were not exposed to PMA compared with 377 such spectra in three proteomes of cells that were exposed to PMA, indicating that more than 25% of the total PhHg identifications by SEQUEST from PMA-exposed cells were false. However, each MS2 scan and its SEQUEST prediction can be assigned an isotope distribution from the precursor MS1 scan based on the m/z region of the precursor scan that was selected for fragmentation. Using this MS1 scan, we can assign a ΔFit score to each SEQUEST PhHg prediction and accept or reject the SEQUEST prediction.
By comparing the distributions of ΔFit scores for SEQUEST PhHg predictions from our proteomic analyses of PMA-exposed (Fig. 6A, purple) and unexposed cells (Fig. 6A, orange), we find that the distributions have overlapping peaks at ΔFit < 0.0. This is evidence for similar rates of false positives in both experimental conditions. However, only the histogram for the PMA-exposed samples has a large peak at ΔFit > 0.0. Applying a ΔFit threshold to these isotope distributions at 0.0 eliminates most false positives observed in samples from unexposed cells (90 of 99), and eliminates a similar count (102 of 377) in the exposed samples. Of the peptide isotope distributions that pass the ΔFit filter in the PMA-exposed samples, we deduced that 97% (266.3/275) of them are true positives (precision) by assuming the difference between exposed and unexposed samples is due to true positives alone (computation illustrated in supplemental Fig. S4). Using SEQUEST and a ΔFit threshold of 0.0 (Fig. 6A) on these isotope distributions we identified 275 spectra as Hg-modified from 47 peptides and 42 proteins. Example spectra for a PhHg-modified peptide and for the same peptide without PhHg are shown in supplemental Fig. S5. Based on our estimated precision, we expect about 9 of the 275 spectra were false positives. A discussion of specific modified peptides and their biological significance will follow in a later publication.
Fig. 6.

Comparisons of ΔFit distributions from proteomes of PMA-exposed cells with those from unexposed cells show ΔFit combined with fitHg can effectively identify Hg modifications. In all panels, ΔFit scores in purple are for peptide isotope distributions from the proteomes of three different E. coli cultures exposed to PMA. In orange are ΔFit scores from the proteomes of three contemporaneous E. coli cultures not exposed to PMA. A, ΔFit scores (of the MS1 precursor ion) for all PhHg predictions made by SEQUEST. B, ΔFit scores for all MS1 precursors of MS2 scans, regardless of their SEQUEST predictions. Panels (C) and (D) show distributions similar to those in panels (A) and (B), but for isotope distributions summed across all scans of multi-scan features. Panel (D) includes an inset that is an enlargement of the main plot at ΔFit > 0. In (E) only features with summed isotope distributions that closely match a Hg-modified distribution (fitHg < 0.05) are counted.
A precision value depends on the ratio of actual modified to unmodified peptides in each preparation; as the proportion of modified peptides increases, so will precision. Other measures of accuracy, specifically sensitivity and specificity, are independent of ratios of modified to unmodified peptides. To enable the evaluation of ΔFit for use in other preparations with different ratios of modified to unmodified peptides, we computed the sensitivity and specificity of ΔFit (Figs. 5B and 5C) on those (377 + 99) isotope distributions in the proteomic preparations identified as PhHg-peptides by SEQUEST. Sensitivity was estimated indirectly by comparing both sets of PhHg identifications from the exposed and unexposed conditions and inferring that the differences in both the rates of SEQUEST PhHg identifications and ΔFit scores > 0.0 are due to Hg-modified peptides (supplemental Fig. S4 outlines the calculation in detail). The comparison of histograms in Fig. 6 provides an alternative illustration: the purple bars that rise above the orange bars show the contribution of Hg-modified peptides. There is a clear decrease in specificity of ΔFit (from 99.6% to 91%) on these isotope distributions that SEQUEST falsely identifies as PhHg, compared with the pure protein spectra (compare line ‘a’ in Fig. 5B with red line). This is partly due to the complexity of proteomic preparations, including lower intensities of some ions, overlapping spectra (where two different ions with similar masses elute at the same time, see supplemental Figs. S6 and S7), and nonpeptide ions.
Because ΔFit is independent of MS2 data, increasing the accuracy of peptide assignments based on MS2 fit, via tools such as PeptideProphet (26), does not negate the benefit of ΔFit and isotope distributions so long as the MS2 matching still generates some false predictions of modifications. While rescoring the SEQUEST identifications with PeptideProphet decreases false predictions of PhHg adducts by 87% (13 compared with 99), at a probability threshold of 0.97, these 13 false identifications get reduced to only 2 by requiring ΔFit > 0.0 (ΔFit specificity = 85%). This PeptideProphet threshold of 0.97 was chosen to produce a similar number of true PhHg identifications as obtained using SEQUEST thresholds in the exposed samples (293 total hits with 280.5 estimated true positives compared with 281.8 true positives using SEQUEST scores alone). Applying a ΔFit > 0.0 filter on the exposed samples results in 257 total identifications of PhHg in the exposed samples (ΔFit sensitivity = 90%, calculated as in supplemental Fig. S4). If instead we choose a PeptideProphet threshold that results in the same false identification rate as SEQUEST after applying a ΔFit > 0.0 threshold, ΔFit enables us to lower the PeptideProphet threshold as low as 0.5. An identification made with probability of 0.5 is typically not to be believed as it implies that the assignment is as likely to be wrong as correct. However, by applying the additional ΔFit > 0.0 filter, the number of estimated false positives in the exposed samples is only 10 (compare with 9 using SEQUEST and ΔFit) whereas this relaxed threshold increases the number of PhHg adduct identifications by more than 25% to 350 (from 275 with SEQUEST and ΔFit). On this set of modified peptide identifications with PeptideProphet probabilities greater than 0.5, sensitivity and specificity estimates of ΔFit are comparable when applied to the set of identifications made by SEQUEST (supplemental Fig. S8).
Searching for Unexpected Modifications
As the first global proteomic study of the in vivo cellular effects of mercury compounds, we cannot be certain of the full range of Hg modifications to expect. SEQUEST or similar programs cannot identify unexpected modifications as these tools only look for a small number of specified modifications. Instead, we would like to reverse the order of analysis to use isotope distributions first to identify those isotope distributions in LC-MS data that are likely Hg-modified peptides, and then examine their mass and MS2 fragmentation patterns to identify the peptide and its Hg modification. However, with modifications as rare as the expected PhHg modifications observed when using SEQUEST and ΔFit together (see previous section), the number of false positive identifications of modified peptides can far exceed the total number of true positive identifications even with the high specificity of ΔFit. This is made evident in Fig. 6B by the nearly identical distributions of ΔFit scores computed for all MS1 isotope distributions selected for MS2 fragmentation in the three PMA-exposure experiments (purple) versus the three experiments where cells were not exposed (orange). Although the specificity of ΔFit on these isotope distributions (Fig. 5B, line b) is greater than the specificity of ΔFit on the SEQUEST PhHg identifications (Fig. 5B, line a), the number of isotope distributions with ΔFit scores above the 0.0 threshold is over 15,000, all necessarily false positives in the unexposed proteomes. A similar number of false positives must be present in the PMA-exposed proteomes, far outnumbering the few hundred true positive PhHg peptides identified by application of ΔFit to SEQUEST-identified PhHg-adducts above. Thus, use of ΔFit alone on single scans is not sufficient to identify the relatively rare Hg-modifications.
Summed Isotope Distributions of Features Appearing in Multiple Sequential Scans
The LC elution profiles for most ions are broad enough that they appear in multiple sequential MS1 scans. We took advantage of these “multi-scan features,” by summing them to give a more accurate isotope distribution for a given ion (compare Figs. 7B and 7C). One challenge in summing scans is determining the boundaries of the multi-scan feature, i.e. the start and end points of a peptide's elution, as well as choosing which peaks within successive scans are from the same ion. To address this challenge, we used a clustering algorithm developed for the accurate mass and time tag (AMT) approach for identifying peptides in LC-MS as described under “Experimental Procedures” (16).
Fig. 7.

Summing isotope distributions over elution profiles decreases noise. A, Spectra collected in sequential scans of a peptide ion from a proteomic preparation as it elutes from the LC over the time of 10 MS1 scans. The colored bars serve to visually separate the scans which are represented by the black borders between colors. The earliest scan is in the front with later scans following in back. Panels (B) and (C) show two methods of using these scans to compute isotope distributions. The simplest (B) is to use a single scan whose MS2 fragmentation led to SEQUEST identification of this peptide ion as one containing a PhHg-adduct. The scan in (B) is the same scan as the front-most scan in (A). Those peaks that match single mass-unit isotopic shifts and comprise the observed isotope distribution are circled in magenta. In (C) the observed isotope distributions across scans for the same LC-MS feature are summed over all scans included in the feature. The contribution of each scan is drawn with the color that follows it in panel (A), with the last scan represented by black. Panels (D) and (E) show the alignments and fittings of the observed isotope distributions (B and C) with the averagine-based expected distributions for unmodified (yellow) and modified (purple) cases. In this example, the single scan data (D) give a negative ΔFit indicating it is not likely a Hg adduct, but the summed multi-scan data (E) give a positive ΔFit indicating a likely Hg adduct.
The Accuracy of ΔFit on Summed Isotope Distributions from Multiscan Features
The accuracy of ΔFit on summed isotope distributions from multiscan features can be measured as for single scans. As with the single scans, we used only the subset of multiscan features that SEQUEST predicted were PhHg-modified (Fig 6C). We computed specificity and sensitivity of ΔFit for the SEQUEST PhHg identifications as for the single scans, and both specificity and sensitivity improved for summed scans over the single scans (Figs. 5B and 5C, compare lines “c” with lines “a”). To determine if this increase in accuracy allows the detection of Hg-modifications without SEQUEST, we examined all multi-scan features regardless of any SEQUEST identification. Based on only the results from the unexposed cells, the distribution of ΔFit scores (Fig. 6d, orange) gives a specificity of 98.4% at a threshold of 0.0, an improvement over single scans (compare Fig. 5B, line “d” with line “b”). However, the number of total positives from the PMA-exposed cells (5362) was only 27% more than the false positives from the unexposed cells at that threshold (4219); i.e. most isotope distributions that pass ΔFit > 0 are false positives (Fig. 6D).
Use of ΔFit and fitHg Together Allows Detection of Hg-Adducts Without SEQUEST Prefiltering
The lower noise in the summed isotope distributions compared with those from single scans (C versus B in Fig. 7) improved the match between observed isotope distributions and theoretical Hg-peptide isotope distributions, as measured by fitHg (E and D in Fig. 7). Using fitHg as an additional filter (i.e. fitHg < 0.05 AND ΔFit > 0.0) eliminated 90% of the unmodified peptides (compare Fig. 6e with 6d), sharpening the differences in the ΔFit distributions for PMA-exposed and unexposed isotope distributions without relying on SEQUEST. Combining ΔFit and fitHg clearly improved specificity (Fig. 5B, line ‘e’) over ΔFit alone on summed scans, affording a nearly 10-fold decrease in the false positive rate (1-specificity) from 1.6% to 0.18% (s.d. = 0.06%, n = 3 experiments) at a ΔFit threshold of 0.0.
As a first step toward investigating modified peptides that may not have been identified by SEQUEST, it is useful to examine the ΔFit versus mass plots for these Hg-like features in the PMA exposed samples (Fig. 8A, or with an expanded view in supplemental Fig. 9a), in comparison with the Hg-like features in the unexposed samples (Fig. 8B, expanded in supplemental Fig. S9b) to understand patterns of false positives. This comparison makes clear that the PMA-exposed samples have many more Hg-like features in the <3000 Dalton range than appear in the unexposed samples, and also have many repeated observations of the same mass (indicated by vertical clusters of circles) at expected ΔFit scores. Most of these vertical clusters corresponded to SEQUEST-identified phenyl-Hg adducts, thus confirming that most Hg modifications were detected by SEQUEST. However, some clusters clearly stand out and are at masses not identified by SEQUEST as PhHg adducts. These are likely Hg adducts but remain unidentified without further analysis. We identified one of these using an additional SEQUEST run allowing for the previously unexpected Hg(II)-cysteine modification. This cluster (identified by the red ‘*’, Fig. 8) is a peptide with a single Hg(II) chelated by the CTTNC motif in E. coli GAPDH (see supplemental Fig. S10 for a labeled MS2 spectrum), possibly the result of contamination of the PMA stock with Hg(II). Several remaining unidentified clusters appear to be PhHg adducts of tryptic peptides (red lines in Fig. 8A) based on accurate mass, SEQUEST hits below acceptable thresholds, and observations of other peptides from the same proteins. Relatively few features seen in all three experiments remain completely unidentified, leaving little chance that a major type of Hg-modification remains unidentified.
Fig. 8.

All multiscan features with Hg-adduct-like isotope distributions. Each circle corresponds to the summed isotope distribution for one multi-scan feature from three different E. coli cell cultures, each represented by a different color (green, purple, blue). Only features with ΔFit > 0.0 and fitHg < 0.05 are plotted. A, shows data from PMA exposed cultures and (B) shows data from the same cultures with no PMA exposure. See supplemental Fig. S9 for the same plots with an enlarged x axis to minimize overlaps. In (A), black vertical lines show SEQUEST identifications of PhHg adducts in at least one of the LC-MS/MS runs. Clusters marked with red vertical lines were unidentified by SEQUEST because of ambiguous MS2 fragmentation data but are likely PhHg adducts based on accurate mass, SEQUEST hits below acceptable thresholds, and observations of other peptides from the same proteins. The vertical cluster marked with a red asterisk (*) is a peptide that coordinates one Hg(II) with its two cysteines in the CTTNC active site motif of E. coli GAPDH. In (B), clusters of points highlighted with gray backgrounds were selected for further examination to determine the cause of their Hg-like isotope distributions. Those in gray ovals are the result of co-eluting unmodified peptides that are separated by 2.0 or 3.0 Daltons (see supplemental Figs. S11 and S12) so that their combined isotope distributions appear as one broad distribution. Those in gray rectangles could not be classified as co-elutions.
Examination of False Positive Hg-like Isotope Distributions
The set of features with Hg-like isotope distributions from Hg-free E. coli proteome preparations displayed in Fig. 8B provide a picture of false positives for our method. In clear contrast with the abundant features in the PMA-exposed preparations, most false positives occur at higher masses, lower intensities and with lower reproducibility between replicate LC-MS/MS runs and between replicate biological samples. To determine the causes of these false positives, we examined ten features that stand out in this plot because of their high intensities or their reproducibility (highlighted with gray ovals and rectangles in Fig. 8B). Of these ten, seven cases (gray ovals) were clearly the products of overlapping isotope distributions of co-eluting unmodified peptides of similar mass and abundance, apparent either from the elution profiles of the individual isotope peaks or based on SEQUEST identification of the peptides (supplemental Figs. S11 and S12). For the remaining three cases (gray rectangles), the elution profiles and SEQUEST results were inconclusive. Thus, these types of co-elutions are the major cause of the most intense and frequently recurring false positives in the current study.
Although the level of these co-elutions in our work was not high enough to have a major impact on identifications, they may present a larger problem for other more complex proteomes. Therefore, efforts to minimize co-elutions through experimental methods such as fractionating the sample, or to computationally detect and exclude them, offer the most promising area for improving false positive rates. Our current method of identifying multiple scan features already excluded many co-elutions by its procedure for joining isotope distributions from different scans into a single multi-scan feature. The method assigns a single mass to every isotope distribution detected in a single scan, equivalent to “deisotoping” to assign a monoisotopic mass. Only the isotope distributions with the same mass from neighboring scans are joined into a multi-scan feature. This eliminates many co-elutions where the relative abundance of the two peptides shifts over the time period of their elutions, thus shifting the assigned mass. The exceptions are features detected in regions of the overlapping elutions where abundances are similar, either in very short time periods between elutions of the two peptides or where the elution of a low abundance peptide overlaps with the elution tail of a higher abundance peptide (supplemental Fig. S11), as well as those overlapping elutions that have very similar elution times (supplemental Fig. S12 and Table S1). An alternative approach, one used by MaxQuant, is to require the elution profiles of individual isotope peaks to correlate before joining them into a multi-scan feature. This method should exclude those that have significantly different elutions but will not exclude those with similar elutions (see supplemental Fig. S12).
DISCUSSION
As a tool for the identification of peptides modified by or containing atypical elements, the use of isotope distributions provides an independent method for validating identifications made by SEQUEST or other such algorithms, eliminates the need for additional processing outside of the routine shotgun proteomics pipeline, and does not require peptide fragmentation. Isotope distribution detection requires the use of an MS instrument with enough resolution to resolve individual isotope peaks. We present results on data collected at a nominal FWHM resolution of 100,000, but resolutions as low as 10,000 should be adequate. These resolutions are possible from many currently available systems including the LTQ Orbitrap as used here, Fourier transform ion cyclotron resonance (FTICR) instruments, the latest generation time of flight (TOF) instruments (27), and the latest generation triple quadrupoles (28). The only adjustment necessary may be the use of a different peak finding procedure, of which many are available, because the one we used relied on the m/z spacing of data points as provided by the Orbitrap. As modified peptides are usually present in very low abundances (substoichiometric), they can be passed over for fragmentation in favor of the much more abundant unmodified peptides, especially in complex proteomic preparations. By using isotope distributions, we were able to generate a survey of all MS features with Hg-like isotope profiles (Fig. 8) revealing which, if any, Hg-like LC-MS features were missed by MS/MS fragmentation and SEQUEST. Other elements have natural isotope distributions distinct enough to allow for similar detection of their combinations with peptides. This characteristic of selenium is of particular interest because detecting isotope patterns holds promise for the identification of selenocysteine (Sec) peptides and proteins. Isotope distributions could confirm known Sec peptides as well as highlighting LC-MS features that indicate unexpected modifications of Sec peptides. Additionally through construction of a database of alternatively translated protein sequences, by treating the UGA stop codons as Sec codons, the identification of Sec peptides with confirmation by isotope distributions may lead to identification of previously unknown selenoproteins.
Modifications of proteins by bivalent Hg(II) can result in cross-linking of sequentially distant but spatially close cysteines in the folded protein structure. By using the monovalent organomercurial, PMA, we expected to avoid this complicating issue. However, the discovery capability of isotope distributions was demonstrated when their evaluation revealed an ion as a likely Hg-adduct that had failed to be identified by SEQUEST as a PhHg-modification. This peptide proved to be the simplest case of cross-linking by Hg(II), with Hg(II) binding to two cysteines in a single peptide. While SEQUEST was not designed to model the fragmentation patterns caused by this type of internal cross-link, we found that SEQUEST did report significant matches by modeling this bivalent Hg(II) cross-link as a single positively charged modification by Hg(II) at one or the other of the two cysteines in the peptide. This simplification is possible because the main effects on the fragmentation patterns caused by an internal Hg(II) cross-link were simply double peaks for those fragments: i.e. one peak with the added mass of Hg(II) and one without. External cross-links, where two different peptides are joined by a single Hg(II) present a substantially greater challenge for identification by MS/MS (29, 30).
In summary, the scoring of isotope distributions to detect proteins modified by or including isotopically distinct elements such as Hg is easily and effectively applied to routine shotgun proteomics employing high resolution MS. In its simplest form, isotope distribution scoring can be applied to single precursor spectra and compared with SEQUEST or similar peptide identifications by fragmentation. Especially in complex whole proteome samples, isotope distributions become more powerful, but involve more complex data processing of summed spectra within LC-MS features. Used this way, even on proteomic preparations, isotope distributions are accurate enough to resolve modified peptides without other peptide identifications, enabling identification of unexpected modifications, or to confirm that the expected modifications as identified by other methods are the dominant modification.
Acknowledgments
We thank A. Perez for help with GAPDH protein preparations. A portion of the research was performed using the Environmental Molecular Sciences Laboratory (EMSL), a national scientific user facility sponsored by the Department of Energy's Office of Biological and Environmental Research and located at Pacific Northwest National Laboratory in Richland, WA.
Footnotes
* This work was supported by grants from the Department of Energy, Office of Science, Environmental Remediation Science Program; DE-FG02–07ER64409 (to SMM), DE-FG02–07ER64408 (to AOS).
 This article contains supplemental Figs. S1 to S12 and Table S1.
1 The abbreviations used are:
- LC-MS/MS
- liquid chromatography-tandem MS
- PTM
- Post-translational modification
- GAPDH
- Glyceraldehyde 3-phosphate dehydrogenase
- IAM
- Iodoacetamide
- LB
- Luria-Bertani
- MS/MS
- Tandem mass spectrometry
- MS1
- Primary MS
- MS2
- Secondary MS
- PhHg
- Phenylmercury
- PMA
- Phenylmercuric acetate
- Sec
- Selenocysteine
- FWHM
- Full width at half maximum.
REFERENCES
- 1. Han X., Aslanian A., Yates J. R., 3rd (2008) Mass spectrometry for proteomics. Curr. Opin. Chem. Biol. 12, 483–490 [DOI] [PMC free article] [PubMed] [Google Scholar]
- 2. Amoresano A., Carpentieri A., Giangrande C., Palmese A., Chiappetta G., Marino G., Pucci P. (2009) Technical advances in proteomics mass spectrometry: identification of post-translational modifications. Clin. Chem. Lab. Med. 47, 647–665 [DOI] [PubMed] [Google Scholar]
- 3. Gesellchen F., Bertinetti O., Herberg F. W. (2006) Analysis of posttranslational modifications exemplified using protein kinase A. Biochim. Biophys. Acta 1764, 1788–1800 [DOI] [PubMed] [Google Scholar]
- 4. MacCoss M. J., McDonald W. H., Saraf A., Sadygov R., Clark J. M., Tasto J. J., Gould K. L., Wolters D., Washburn M., Weiss A., Clark J. I., Yates J. R., 3rd (2002) Shotgun identification of protein modifications from protein complexes and lens tissue. Proc. Natl. Acad. Sci. U.S.A. 99, 7900–7905 [DOI] [PMC free article] [PubMed] [Google Scholar]
- 5. Rappaport S. M. (2011) Implications of the exposome for exposure science. J. Expo. Sci. Environ. Epidemiol. 21, 5–9 [DOI] [PubMed] [Google Scholar]
- 6. Wild C. P. (2005) Complementing the genome with an “exposome”: the outstanding challenge of environmental exposure measurement in molecular epidemiology. Cancer Epidemiol. Biomarkers Prev. 14, 1847–1850 [DOI] [PubMed] [Google Scholar]
- 7. Rubino F. M., Verduci C., Giampiccolo R., Pulvirenti S., Brambilla G., Colombi A. (2004) Molecular characterization of homo- and heterodimeric mercury(II)-bis-thiolates of some biologically relevant thiols by electrospray ionization and triple quadrupole tandem mass spectrometry. J. Am. Soc. Mass. Spectrom. 15, 288–300 [DOI] [PubMed] [Google Scholar]
- 8. Guo Y., Chen L., Yang L., Wang Q. (2008) Counting Sulfhydryls and Disulfide Bonds in Peptides and Proteins Using Mercurial Ions as an MS-Tag. J. Am. Soc. Mass. Spectrom. 19, 1108–1113 [DOI] [PubMed] [Google Scholar]
- 9. Krupp E. M., Milne B. F., Mestrot A., Meharg A. A., Feldmann J. (2008) Investigation into mercury bound to biothiols: structural identification using ESI-ion-trap MS and introduction of a method for their HPLC separation with simultaneous detection by ICP-MS and ESI-MS. Anal. Bioanal. Chem. 390, 1753–1764 [DOI] [PMC free article] [PubMed] [Google Scholar]
- 10. Horn D. M., Zubarev R. A., McLafferty F. W. (2000) Automated reduction and interpretation of high resolution electrospray mass spectra of large molecules. J. Am. Soc. Mass. Spectrom. 11, 320–332 [DOI] [PubMed] [Google Scholar]
- 11. Cox J., Mann M. (2008) MaxQuant enables high peptide identification rates, individualized p.p.b.-range mass accuracies and proteome-wide protein quantification. Nat. Biotechnol. 26, 1367–1372 [DOI] [PubMed] [Google Scholar]
- 12. Eng J. K., McCormack A. L., Yates J. R., III (1994) An approach to correlate tandem mass spectral data of peptides with amino acid sequences in a protein database. J. Am. Soc. Mass. Spectrom. 5, 976–989 [DOI] [PubMed] [Google Scholar]
- 13. Jaitly N., Mayampurath A., Littlefield K., Adkins J. N., Anderson G. A., Smith R. D. (2009) Decon2LS: An open-source software package for automated processing and visualization of high resolution mass spectrometry data. BMC Bioinformatics 10, 87–87 [DOI] [PMC free article] [PubMed] [Google Scholar]
- 14. Senko M., Beu S., McLafferty F. (1995) Determination of monoisotopic masses and ion populations for large biomolecules from resolved isotopic distributions. J. Am. Soc. Mass. Spectrom. 6, 229–233 [DOI] [PubMed] [Google Scholar]
- 15. Rockwood A. L., Haimi P. (2006) Efficient calculation of accurate masses of isotopic peaks. J. Am. Soc. Mass. Spectrom. 17, 415–419 [DOI] [PubMed] [Google Scholar]
- 16. Monroe M. E., Tolić N., Jaitly N., Shaw J. L., Adkins J. N., Smith R. D. (2007) VIPER: an advanced software package to support high-throughput LC-MS peptide identification. Bioinformatics 23, 2021–2023 [DOI] [PubMed] [Google Scholar]
- 17. Riddles P. W., Blakeley R. L., Zerner B. (1979) Ellman's reagent: 5,5′-dithiobis(2-nitrobenzoic acid)–a reexamination. Anal. Biochem. 94, 75–81 [DOI] [PubMed] [Google Scholar]
- 18. Womble D. D., Rownd R. H. (1988) Genetic and physical map of plasmid NR1: comparison with other IncFII antibiotic resistance plasmids. Microbiol. Rev. 52, 433–451 [DOI] [PMC free article] [PubMed] [Google Scholar]
- 19. Neidhardt F. C., Bloch P. L., Smith D. F. (1974) Culture medium for enterobacteria. J. Bacteriol. 119, 736–747 [DOI] [PMC free article] [PubMed] [Google Scholar]
- 20. Callister S. J., McCue L. A., Turse J. E., Monroe M. E., Auberry K. J., Smith R. D., Adkins J. N., Lipton M. S. (2008) Comparative bacterial proteomics: analysis of the core genome concept. PloS One 3, e1542–e1542 [DOI] [PMC free article] [PubMed] [Google Scholar]
- 21. Kelly R. T., Page J. S., Luo Q., Moore R. J., Orton D. J., Tang K., Smith R. D. (2006) Chemically etched open tubular and monolithic emitters for nanoelectrospray ionization mass spectrometry. Anal. Chem. 78, 7796–7801 [DOI] [PMC free article] [PubMed] [Google Scholar]
- 22. Livesay E. A., Tang K., Taylor B. K., Buschbach M. A., Hopkins D. F., LaMarche B. L., Zhao R., Shen Y., Orton D. J., Moore R. J., Kelly R. T., Udseth H. R., Smith R. D. (2008) Fully automated four-column capillary LC-MS system for maximizing throughput in proteomic analyses. Anal. Chem. 80, 294–302 [DOI] [PMC free article] [PubMed] [Google Scholar]
- 23. Washburn M. P., Wolters D., Yates J. R., 3rd (2001) Large-scale analysis of the yeast proteome by multidimensional protein identification technology. Nat. Biotechnol. 19, 242–247 [DOI] [PubMed] [Google Scholar]
- 24. Elias J. E., Gygi S. P. (2007) Target-decoy search strategy for increased confidence in large-scale protein identifications by mass spectrometry. Nat Methods 4, 207–214 [DOI] [PubMed] [Google Scholar]
- 25. McLaughlin T., Siepen J. A., Selley J., Lynch J. A., Lau K. W., Yin H., Gaskell S. J., Hubbard S. J. (2006) PepSeeker: a database of proteome peptide identifications for investigating fragmentation patterns. Nucleic Acids Res. 34, D649–654 [DOI] [PMC free article] [PubMed] [Google Scholar]
- 26. Keller A., Nesvizhskii A. I., Kolker E., Aebersold R. (2002) Empirical statistical model to estimate the accuracy of peptide identifications made by MS/MS and database search. Anal. Chem. 74, 5383–5392 [DOI] [PubMed] [Google Scholar]
- 27. Domon B., Aebersold R. (2010) Options and considerations when selecting a quantitative proteomics strategy. Nat. Biotechnol. 28, 710–721 [DOI] [PubMed] [Google Scholar]
- 28. Yang L., Amad M., Winnik W. M., Schoen A. E., Schweingruber H., Mylchreest I., Rudewicz P. J. (2002) Investigation of an enhanced resolution triple quadrupole mass spectrometer for high-throughput liquid chromatography/tandem mass spectrometry assays. Rapid Commun. Mass Spectrom. 16, 2060–2066 [DOI] [PubMed] [Google Scholar]
- 29. Chu F., Baker P. R., Burlingame A. L., Chalkley R. J. (2010) Finding chimeras: a bioinformatics strategy for identification of cross-linked peptides. Mol. Cell Proteomics 9, 25–31 [DOI] [PMC free article] [PubMed] [Google Scholar]
- 30. Singh P., Panchaud A., Goodlett D. R. (2010) Chemical cross-linking and mass spectrometry as a low-resolution protein structure determination technique. Anal. Chem. 82, 2636–2642 [DOI] [PubMed] [Google Scholar]
- 31. Cleveland W. S., Devlin S. J. (1988) Locally Weighted Regression: An Approach to Regression Analysis by Local Fitting. J. Am. Stat. Assoc. 83, 596–596 [Google Scholar]